
A Potential Role for Bile Acid Signaling in Celiac Disease-Associated Fatty Liver

 , , , , , , , , and add
Show full author list
, , , , , , , , and add
Show full author list
Abstract
:1. Introduction
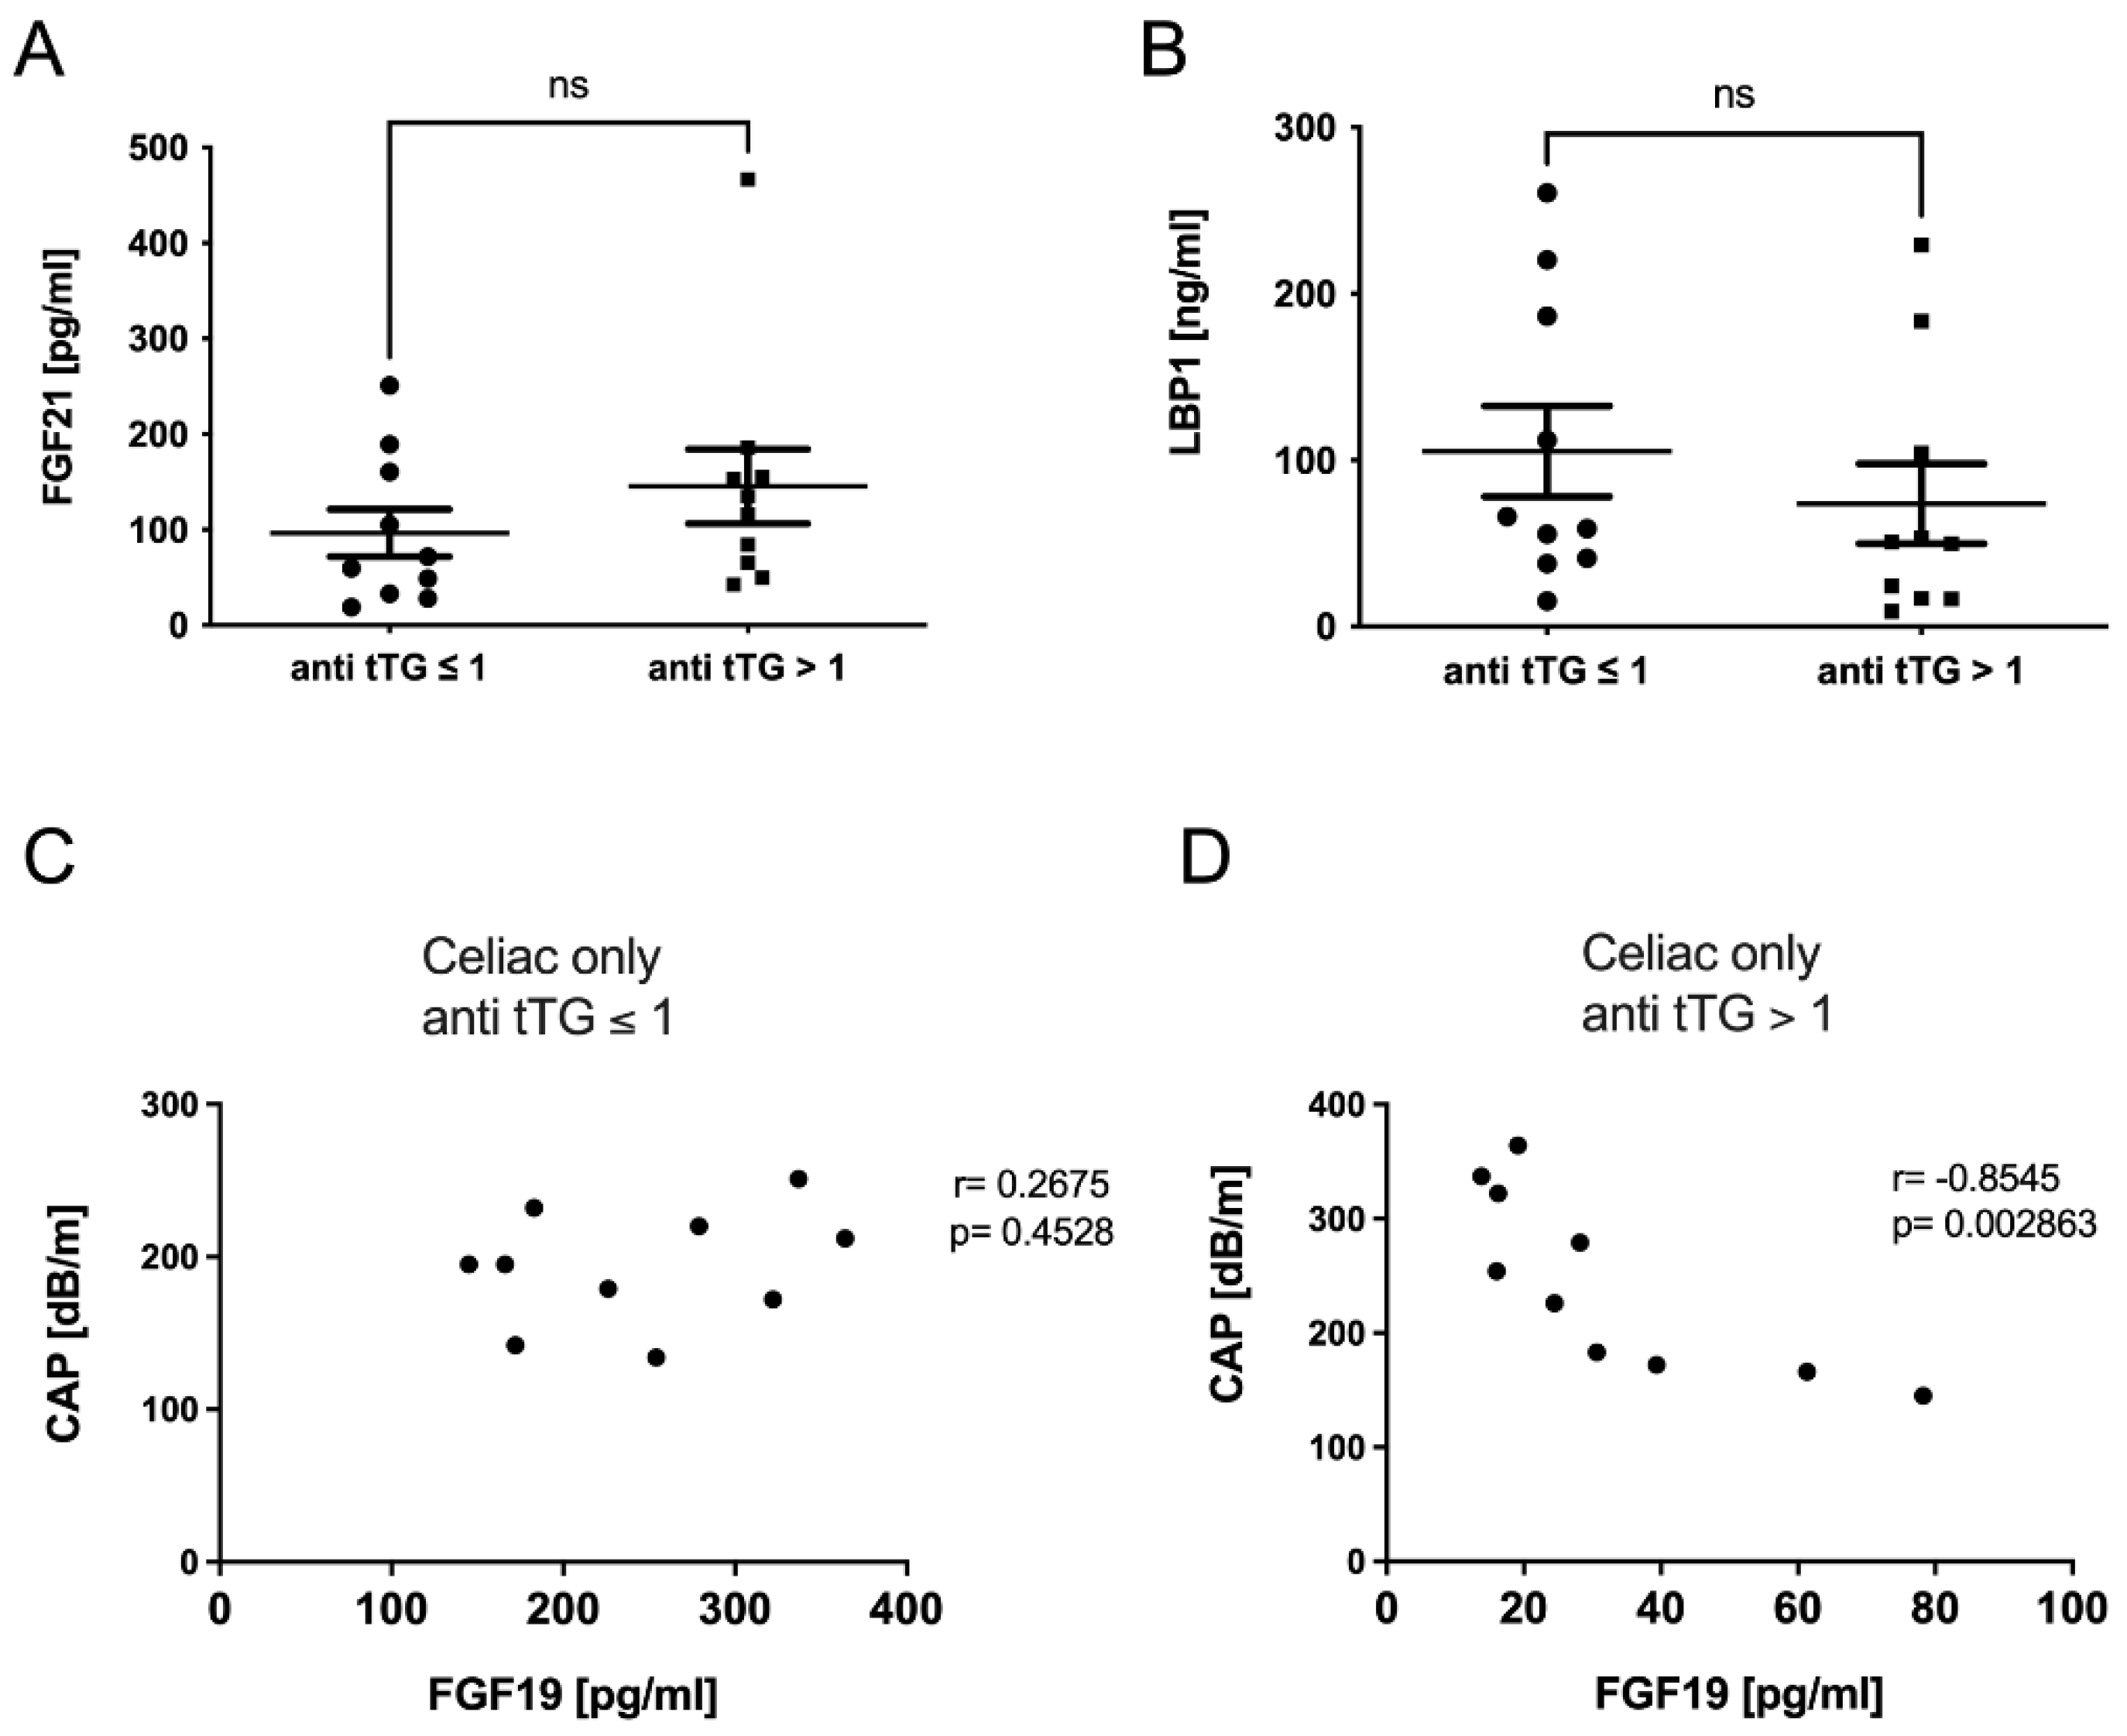
2. Results
2.1. Demographic Data
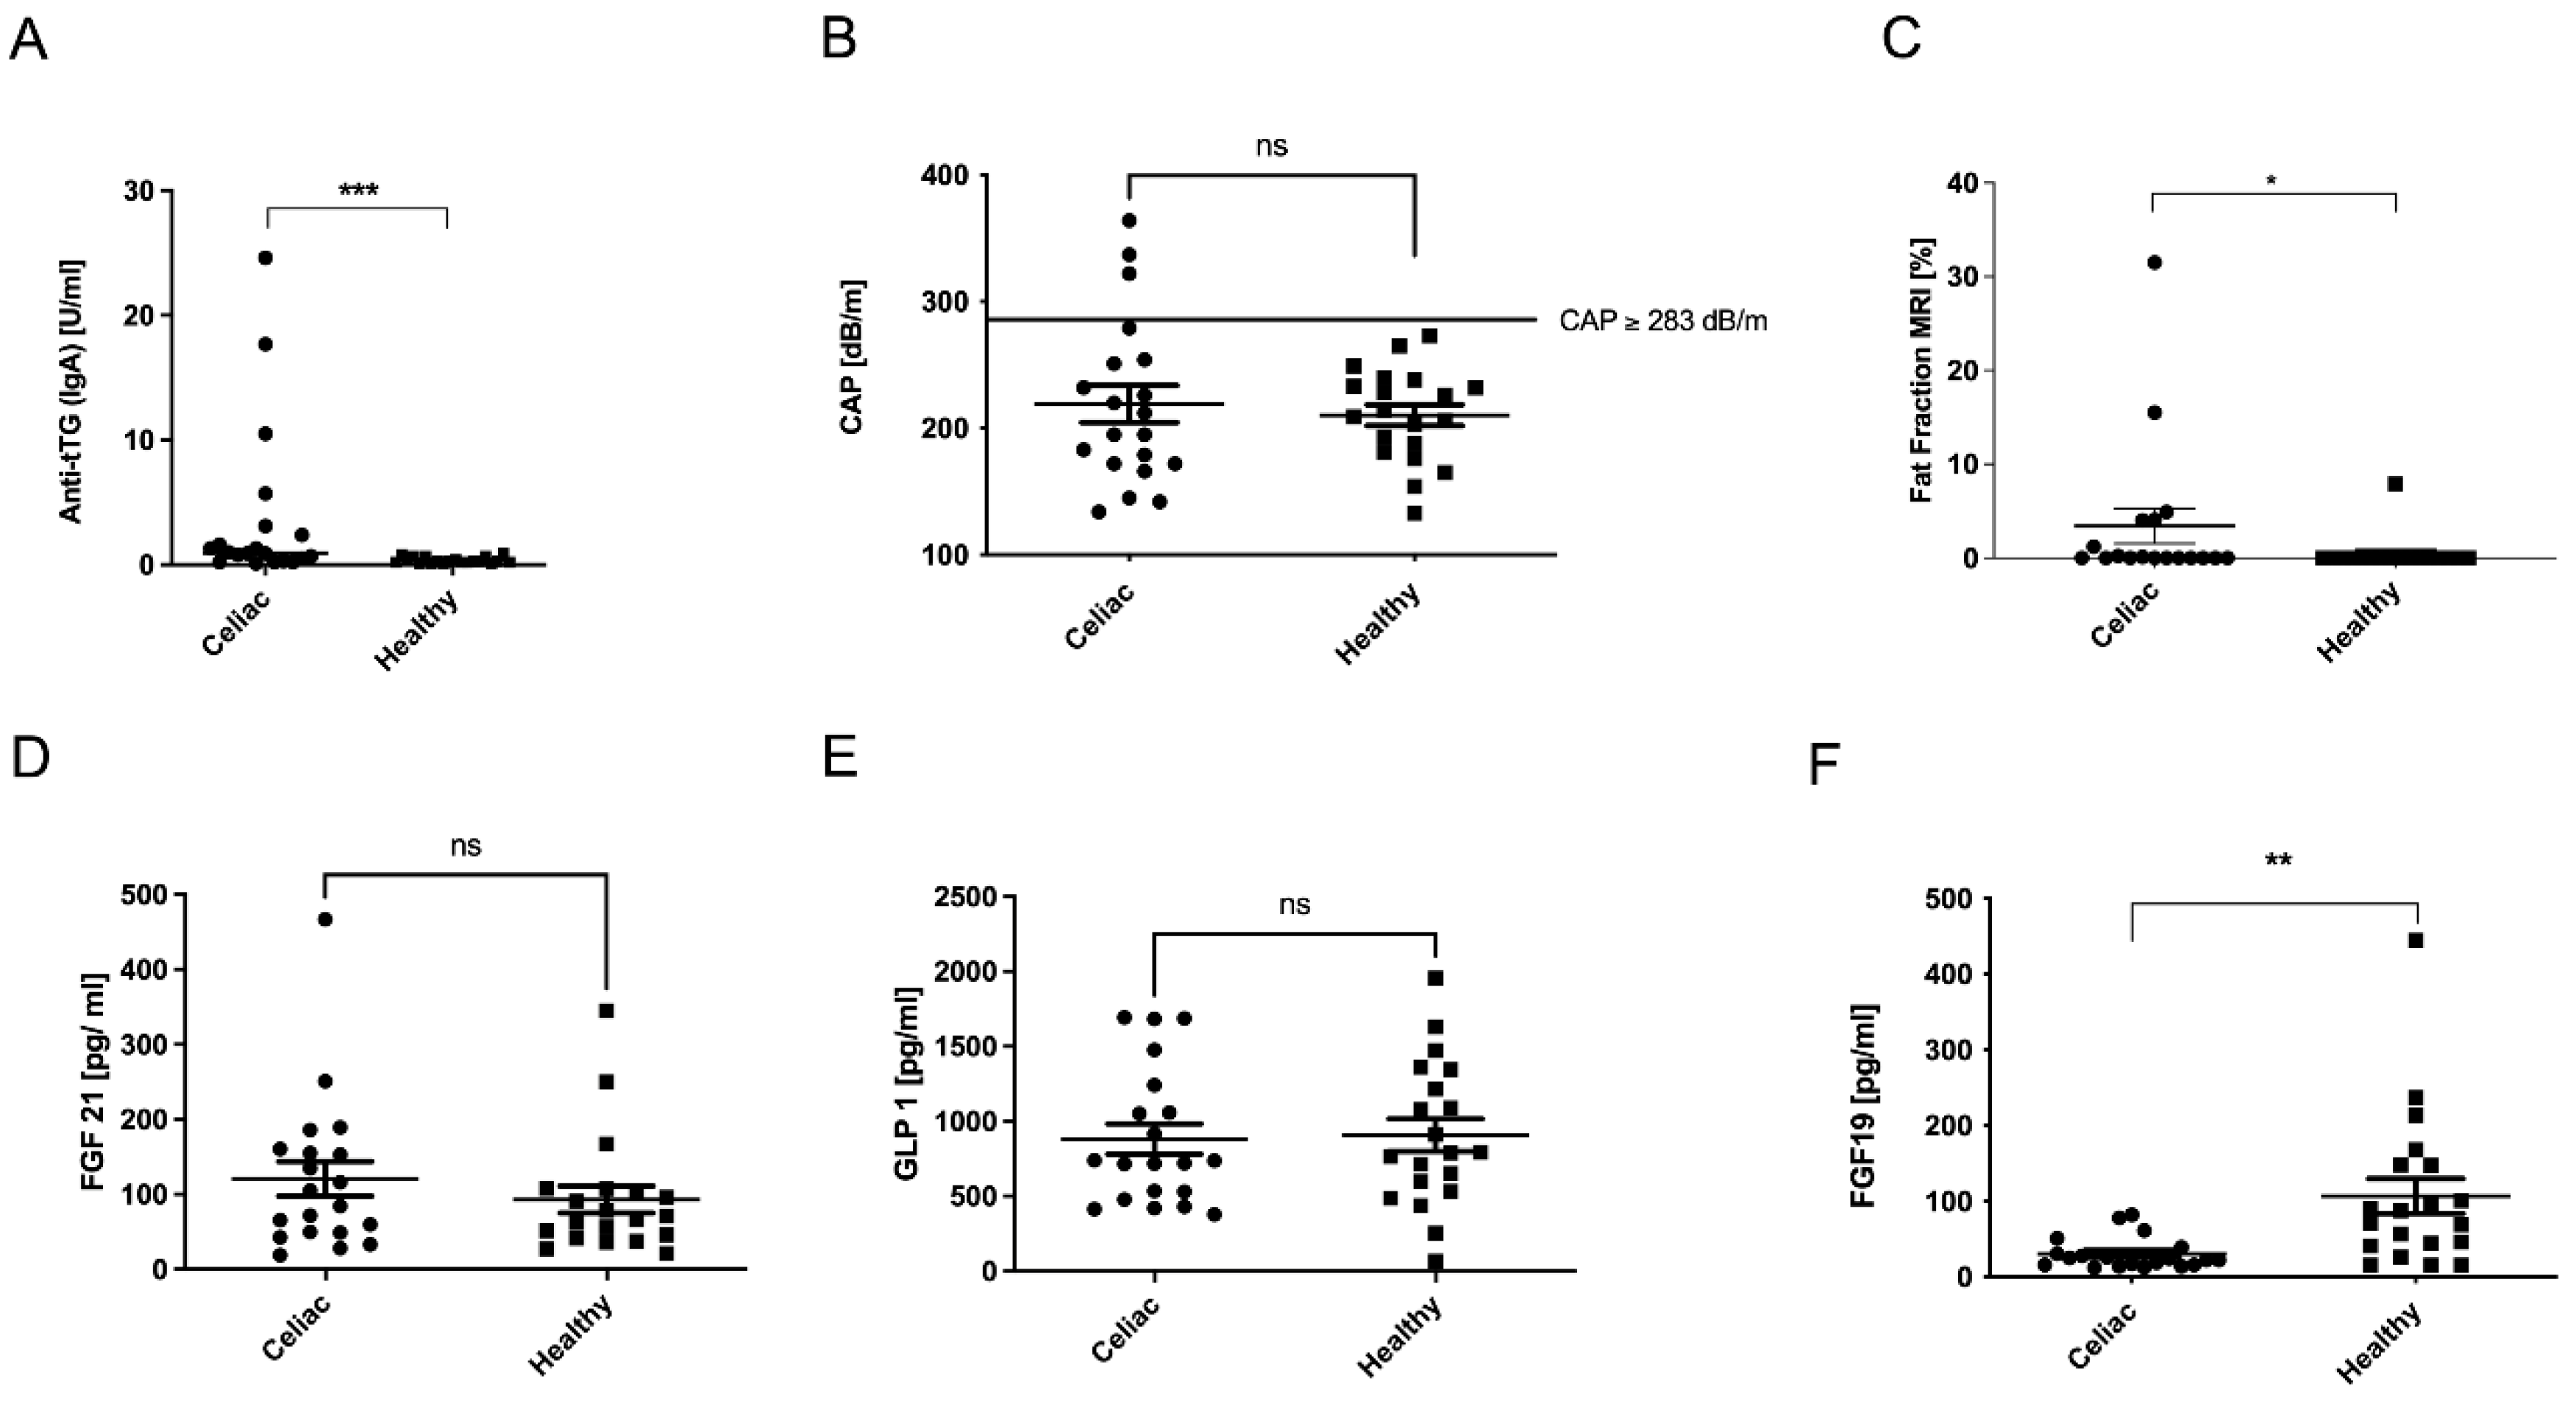
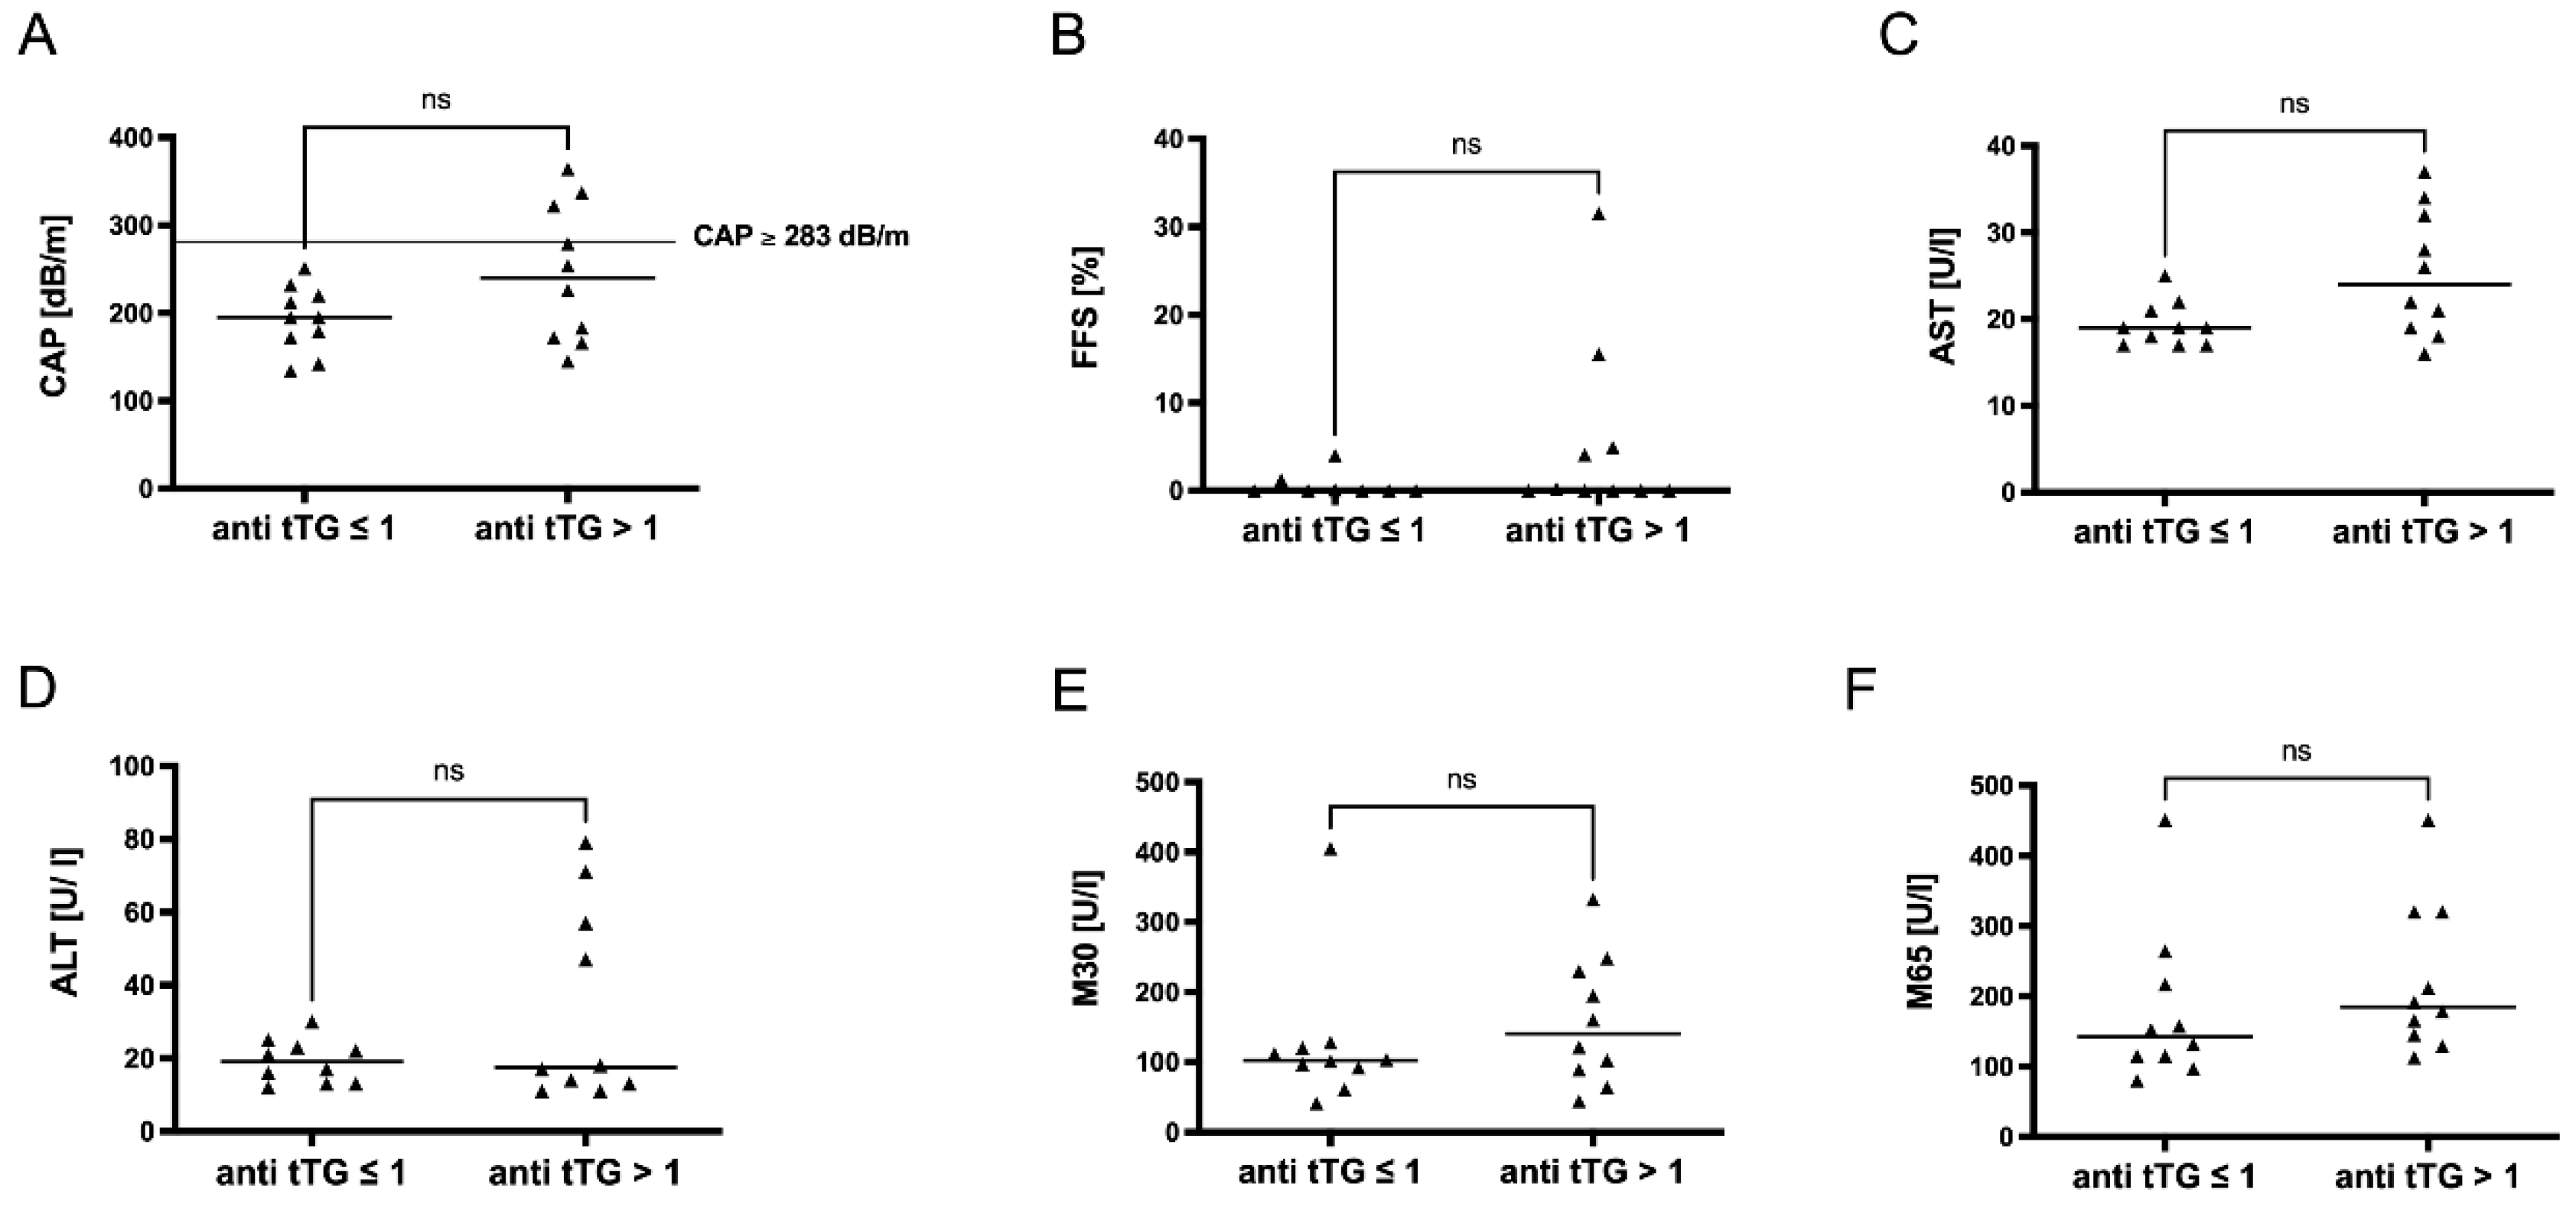
2.2. Celiac Disease and Non-Invasive Liver Tests
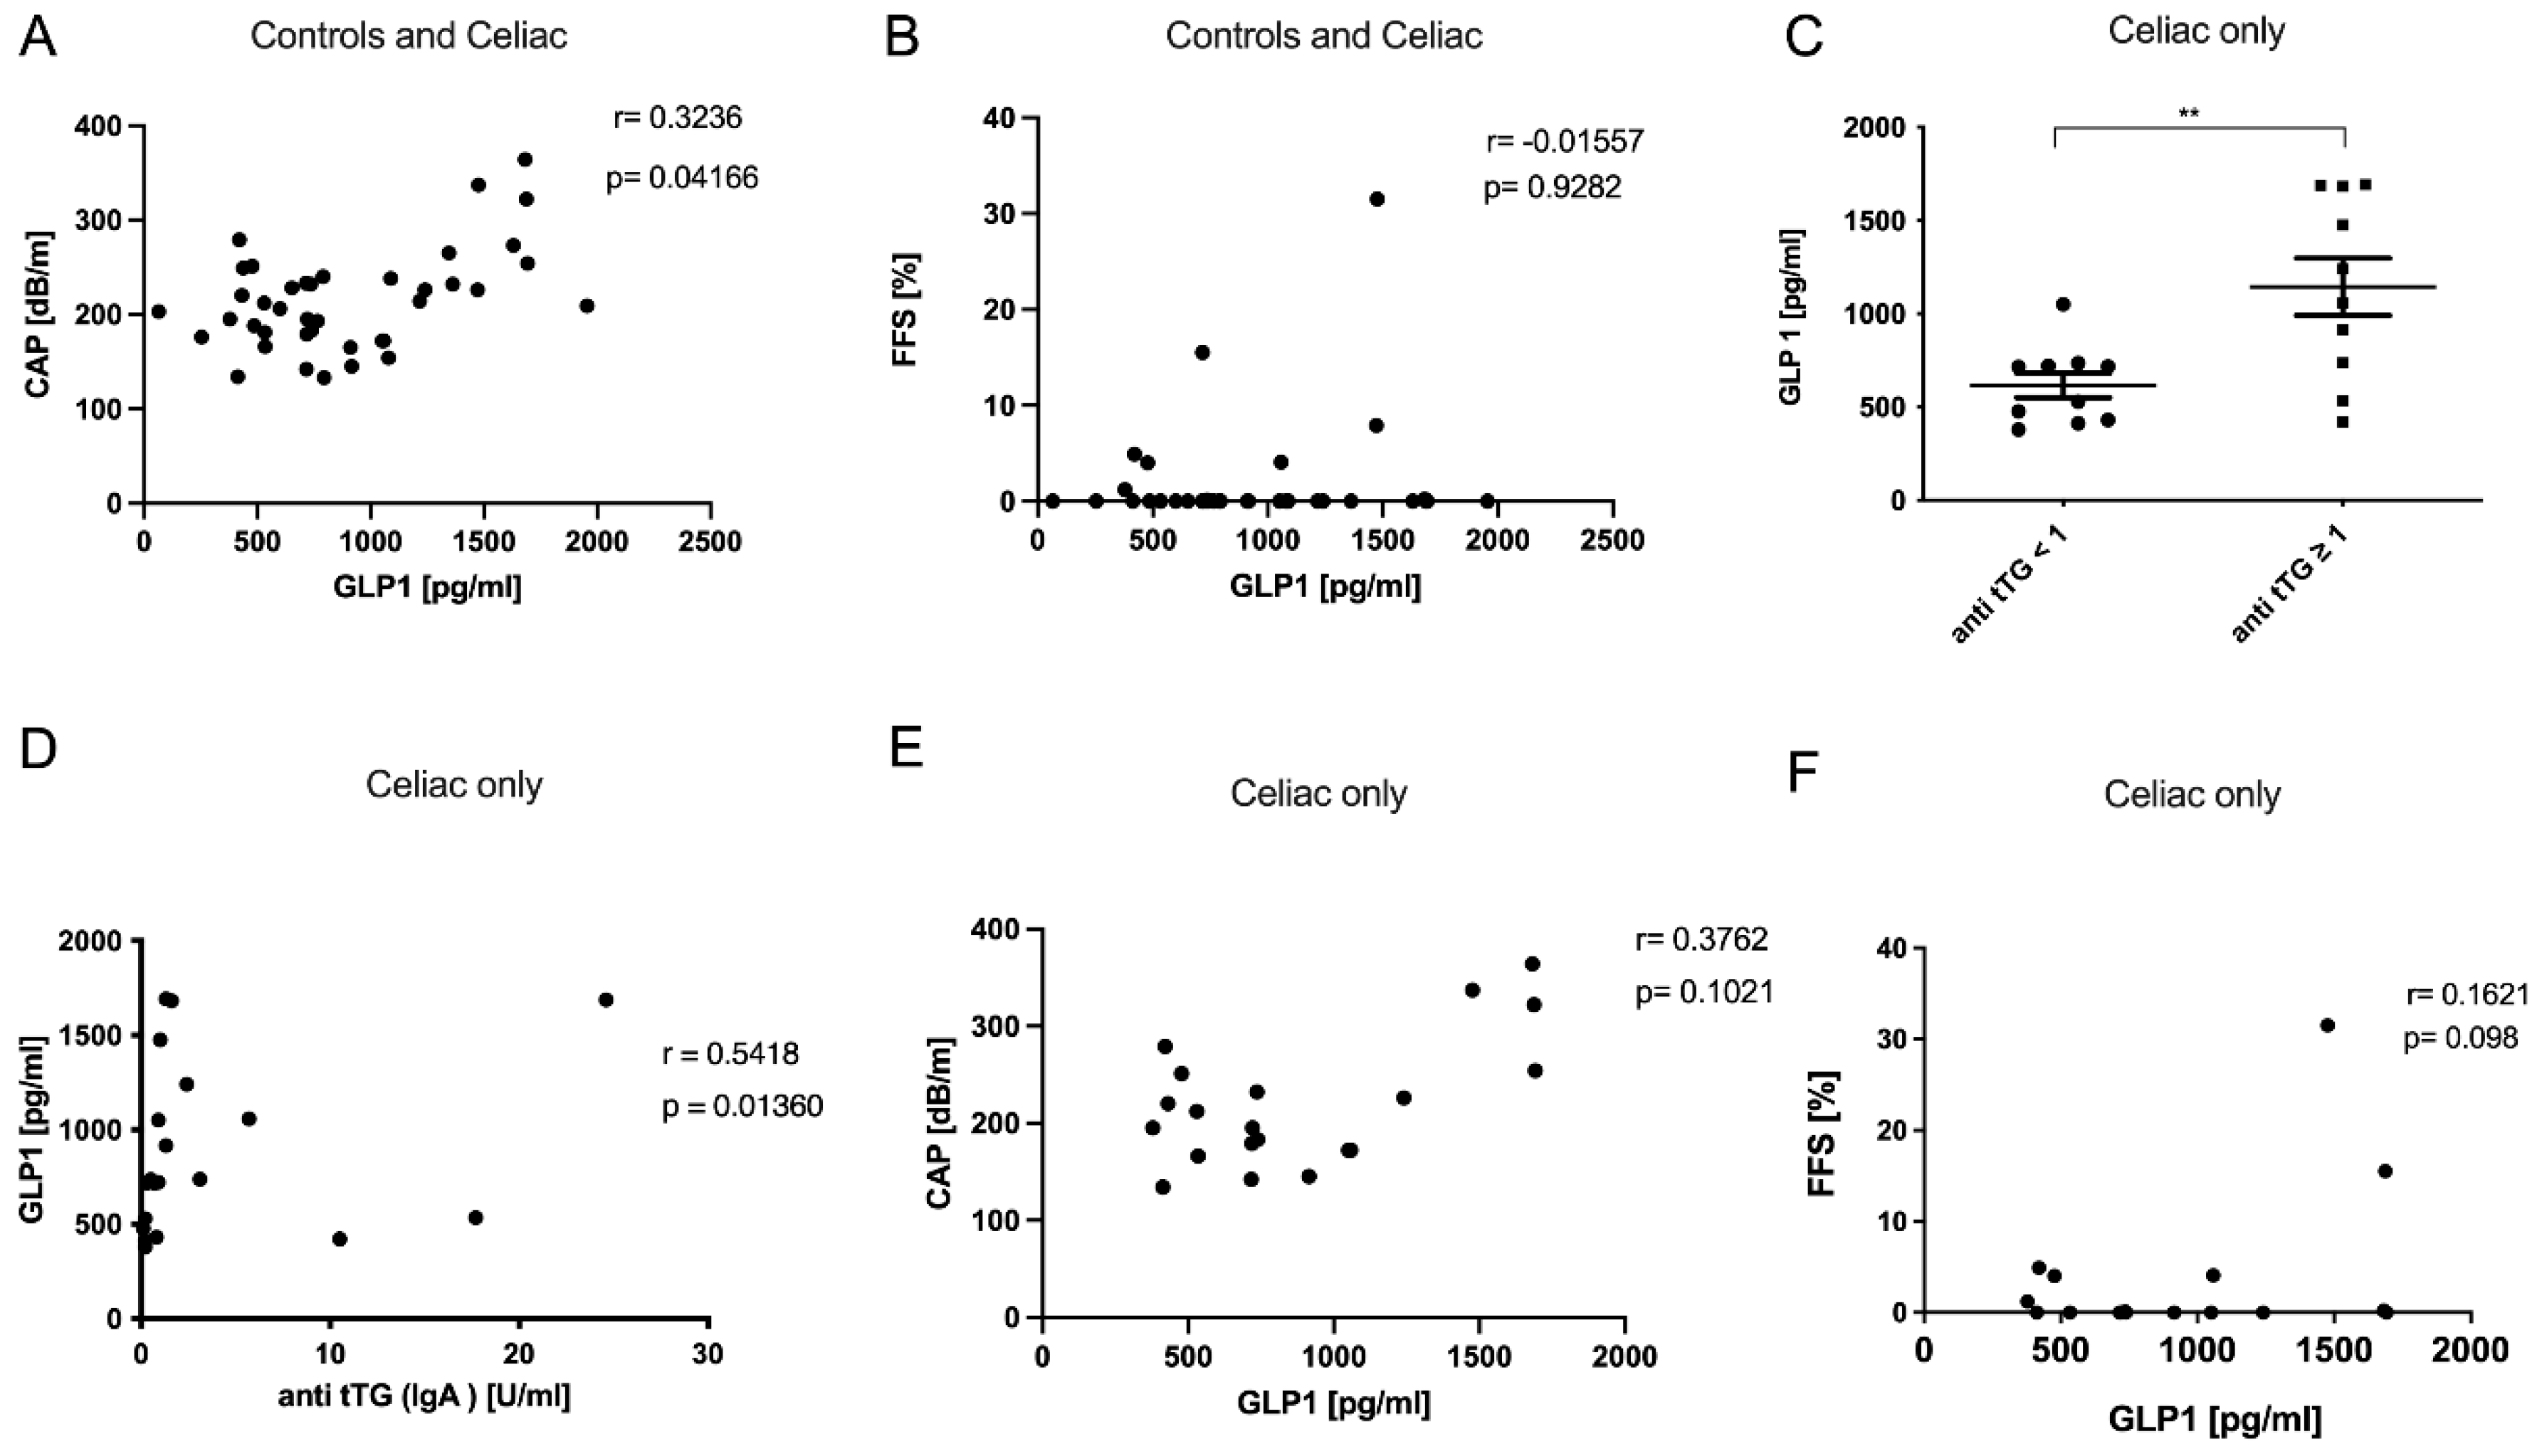
2.3. Incretin Levels in Celiac Disease
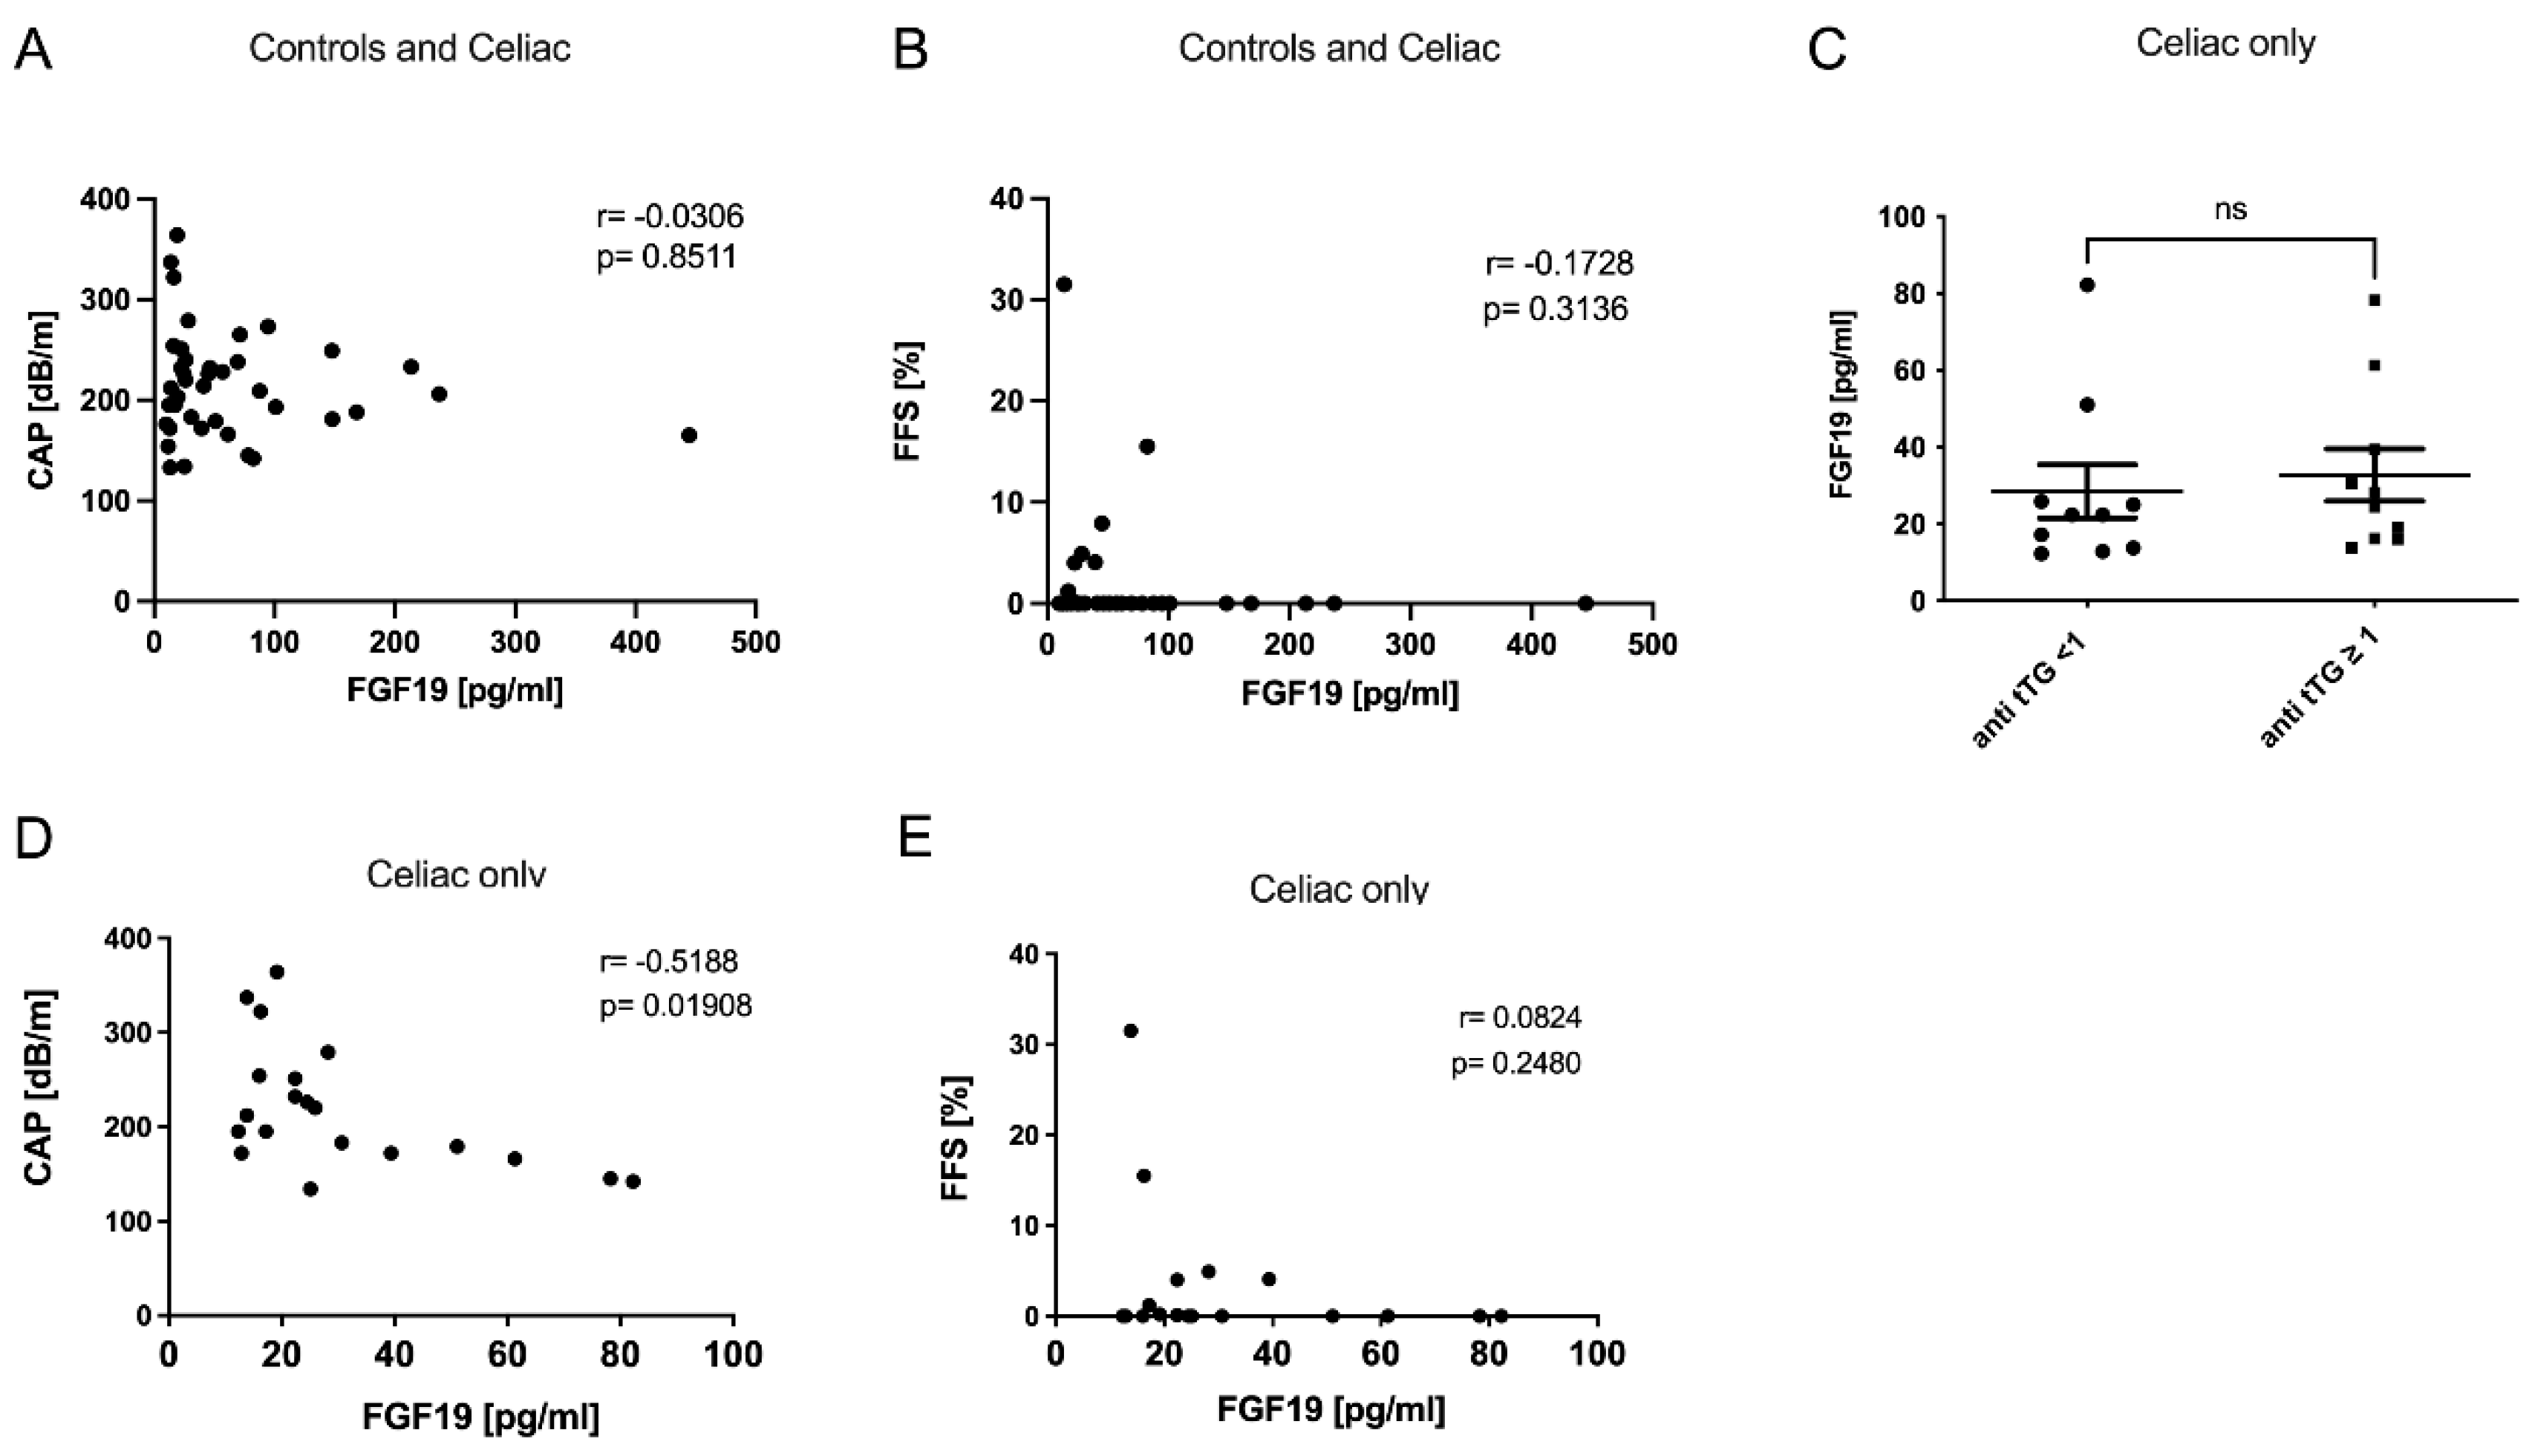
2.4. Bile Acid Metabolism in Celiac Disease
2.5. FGF-19 Levels in Celiac Disease Were Dependent on Disease Activity
2.6. Intestinal Motility Correlated with FGF19 in Celiac Disease
3. Discussion
4. Methods
4.1. Ethical Statement and Sample Collection
4.2. ELISA
4.3. Serum and Fecal Sample Bile Acid Profiling
4.4. Assessment of Liver Steatosis via Transient Elastography
4.5. Bioelectrical Impedance Analysis (BIA)
4.6. Magnetic Resonance Imaging (MRI) for Liver Fat Detection and Bowel Movement Analysis
4.7. Statistical Analysis
Supplementary Materials
Author Contributions
Funding
Institutional Review Board Statement
Informed Consent Statement
Data Availability Statement
Acknowledgments
Conflicts of Interest
References
- Gujral, N.; Freeman, H.J.; Thomson, A.B.R. Celiac Disease: Prevalence, Diagnosis, Pathogenesis and Treatment. World J. Gastroenterol. 2012, 18, 6036–6059. [Google Scholar] [CrossRef] [PubMed]
- Viljamaa, M.; Kaukinen, K.; Huhtala, H.; Kyrönpalo, S.; Rasmussen, M.; Collin, P. Coeliac Disease, Autoimmune Diseases and Gluten Exposure. Scand. J. Gastroenterol. 2005, 40, 437–443. [Google Scholar] [CrossRef] [PubMed]
- Rubio-Tapia, A.; Murray, J.A. Liver Involvement in Celiac Disease. Minerva Med. 2008, 99, 595–604. [Google Scholar] [PubMed]
- Kälsch, J.; Bechmann, L.P.; Manka, P.; Kahraman, A.; Schlattjan, M.; Marth, T.; Rehbehn, K.; Baba, H.A.; Canbay, A. Non-Alcoholic Steatohepatitis Occurs in Celiac Disease and Is Associated with Cellular Stress. Z. Gastroenterol. 2013, 51, 26–31. [Google Scholar] [CrossRef]
- Anania, C.; De Luca, E.; De Castro, G.; Chiesa, C.; Pacifico, L. Liver Involvement in Pediatric Celiac Disease. World J. Gastroenterol. 2015, 21, 5813–5822. [Google Scholar] [CrossRef]
- Al-Hussaini, A.; Basheer, A.; Czaja, A.J. Liver Failure Unmasks Celiac Disease in a Child. Ann. Hepatol. 2013, 12, 501–505. [Google Scholar] [CrossRef]
- Roeb, E.; Steffen, H.M.; Bantel, H.; Baumann, U.; Canbay, A.; Demir, M.; Drebber, U.; Geier, A.; Hampe, J.; Hellerbrand, C.; et al. S2k Guideline non-alcoholic fatty liver disease. Z. Gastroenterol. 2015, 53, 668–723. [Google Scholar] [CrossRef]
- European Association for the Study of the Liver (EASL); European Association for the Study of Diabetes (EASD); European Association for the Study of Obesity (EASO). EASL-EASD-EASO Clinical Practice Guidelines for the Management of Non-Alcoholic Fatty Liver Disease. J. Hepatol. 2016, 64, 1388–1402. [Google Scholar] [CrossRef]
- Kliewer, S.A.; Mangelsdorf, D.J. Bile Acids as Hormones: The FXR-FGF15/19 Pathway. Dig. Dis. 2015, 33, 327–331. [Google Scholar] [CrossRef] [Green Version]
- Sydor, S.; Best, J.; Messerschmidt, I.; Manka, P.; Vilchez-Vargas, R.; Brodesser, S.; Lucas, C.; Wegehaupt, A.; Wenning, C.; Aßmuth, S.; et al. Altered Microbiota Diversity and Bile Acid Signaling in Cirrhotic and Noncirrhotic NASH-HCC. Clin. Transl. Gastroenterol. 2020, 11, e00131. [Google Scholar] [CrossRef]
- Manka, P.; Sydor, S.; Wase, N.; Best, J.; Brandenburg, M.; Hellbeck, A.; Schänzer, J.; Vilchez-Vargas, R.; Link, A.; Figge, A.; et al. Anti-TNFα Treatment in Crohn’s Disease: Impact on Hepatic Steatosis, Gut-Derived Hormones, and Metabolic Status. Liver Int. 2021, 41, 2646–2658. [Google Scholar] [CrossRef]
- Bechmann, L.P.; Hannivoort, R.A.; Gerken, G.; Hotamisligil, G.S.; Trauner, M.; Canbay, A. The Interaction of Hepatic Lipid and Glucose Metabolism in Liver Diseases. J. Hepatol. 2012, 56, 952–964. [Google Scholar] [CrossRef] [PubMed] [Green Version]
- Lanzini, A.; Lanzarotto, F. Review Article: The “mechanical Pumps” and the Enterohepatic Circulation of Bile Acids--Defects in Coeliac Disease. Aliment. Pharmacol. Ther. 2000, 14, 58–61. [Google Scholar] [CrossRef] [PubMed]
- Marasco, G.; Cirota, G.G.; Rossini, B.; Lungaro, L.; Di Biase, A.R.; Colecchia, A.; Volta, U.; De Giorgio, R.; Festi, D.; Caio, G. Probiotics, Prebiotics and Other Dietary Supplements for Gut Microbiota Modulation in Celiac Disease Patients. Nutrients 2020, 12, 2674. [Google Scholar] [CrossRef] [PubMed]
- Myers, R.P.; Pollett, A.; Kirsch, R.; Pomier-Layrargues, G.; Beaton, M.; Levstik, M.; Duarte-Rojo, A.; Wong, D.; Crotty, P.; Elkashab, M. Controlled Attenuation Parameter (CAP): A Noninvasive Method for the Detection of Hepatic Steatosis Based on Transient Elastography. Liver Int. 2012, 32, 902–910. [Google Scholar] [CrossRef] [PubMed]
- Ferraioli, G.; Wong, V.W.-S.; Castera, L.; Berzigotti, A.; Sporea, I.; Dietrich, C.F.; Choi, B.I.; Wilson, S.R.; Kudo, M.; Barr, R.G. Liver Ultrasound Elastography: An Update to the World Federation for Ultrasound in Medicine and Biology Guidelines and Recommendations. Ultrasound Med. Biol. 2018, 44, 2419–2440. [Google Scholar] [CrossRef] [PubMed] [Green Version]
- Newsome, P.N.; Sasso, M.; Deeks, J.J.; Paredes, A.; Boursier, J.; Chan, W.-K.; Yilmaz, Y.; Czernichow, S.; Zheng, M.-H.; Wong, V.W.-S.; et al. FibroScan-AST (FAST) Score for the Non-Invasive Identification of Patients with Non-Alcoholic Steatohepatitis with Significant Activity and Fibrosis: A Prospective Derivation and Global Validation Study. Lancet Gastroenterol. Hepatol. 2020, 5, 362–373. [Google Scholar] [CrossRef] [Green Version]
- Canbay, A.; Kälsch, J.; Neumann, U.; Rau, M.; Hohenester, S.; Baba, H.A.; Rust, C.; Geier, A.; Heider, D.; Sowa, J.-P. Non-Invasive Assessment of NAFLD as Systemic Disease-A Machine Learning Perspective. PLoS ONE 2019, 14, e0214436. [Google Scholar] [CrossRef] [Green Version]
- Abdo, A.; Meddings, J.; Swain, M. Liver Abnormalities in Celiac Disease. Clin. Gastroenterol. Hepatol. 2004, 2, 107–112. [Google Scholar] [CrossRef]
- Abenavoli, L.; Milic, N.; De Lorenzo, A.; Luzza, F. A Pathogenetic Link between Non-Alcoholic Fatty Liver Disease and Celiac Disease. Endocrine 2013, 43, 65–67. [Google Scholar] [CrossRef] [Green Version]
- Miele, L.; Valenza, V.; La Torre, G.; Montalto, M.; Cammarota, G.; Ricci, R.; Mascianà, R.; Forgione, A.; Gabrieli, M.L.; Perotti, G.; et al. Increased Intestinal Permeability and Tight Junction Alterations in Nonalcoholic Fatty Liver Disease. Hepatology 2009, 49, 1877–1887. [Google Scholar] [CrossRef]
- Reilly, N.R.; Lebwohl, B.; Hultcrantz, R.; Green, P.H.R.; Ludvigsson, J.F. Increased Risk of Non-Alcoholic Fatty Liver Disease after Diagnosis of Celiac Disease. J. Hepatol. 2015, 62, 1405–1411. [Google Scholar] [CrossRef] [PubMed] [Green Version]
- Bjørndal, B.; Alterås, E.K.; Lindquist, C.; Svardal, A.; Skorve, J.; Berge, R.K. Associations between Fatty Acid Oxidation, Hepatic Mitochondrial Function, and Plasma Acylcarnitine Levels in Mice. Nutr. Metab. 2018, 15, 10. [Google Scholar] [CrossRef] [PubMed]
- Valvano, M.; Longo, S.; Stefanelli, G.; Frieri, G.; Viscido, A.; Latella, G. Celiac Disease, Gluten-Free Diet, and Metabolic and Liver Disorders. Nutrients 2020, 12, 940. [Google Scholar] [CrossRef] [PubMed] [Green Version]
- Tovoli, F.; Negrini, G.; Farì, R.; Guidetti, E.; Faggiano, C.; Napoli, L.; Bolondi, L.; Granito, A. Increased Risk of Nonalcoholic Fatty Liver Disease in Patients with Coeliac Disease on a Gluten-Free Diet: Beyond Traditional Metabolic Factors. Aliment. Pharmacol. Ther. 2018, 48, 538–546. [Google Scholar] [CrossRef] [PubMed]
- Nobili, V.; Alisi, A.; Mosca, A.; Della Corte, C.; Veraldi, S.; De Vito, R.; De Stefanis, C.; D’Oria, V.; Jahnel, J.; Zohrer, E.; et al. Hepatic Farnesoid X Receptor Protein Level and Circulating Fibroblast Growth Factor 19 Concentration in Children with NAFLD. Liver Int. 2018, 38, 342–349. [Google Scholar] [CrossRef] [PubMed] [Green Version]
- Ijssennagger, N.; van Rooijen, K.S.; Magnúsdóttir, S.; Ramos Pittol, J.M.; Willemsen, E.C.L.; de Zoete, M.R.; Baars, M.J.D.; Stege, P.B.; Colliva, C.; Pellicciari, R.; et al. Ablation of Liver Fxr Results in an Increased Colonic Mucus Barrier in Mice. JHEP Rep. 2021, 3, 100344. [Google Scholar] [CrossRef]
- Weaver, M.J.; McHenry, S.A.; Sayuk, G.S.; Gyawali, C.P.; Davidson, N.O. Bile Acid Diarrhea and NAFLD: Shared Pathways for Distinct Phenotypes. Hepatol. Commun. 2020, 4, 493–503. [Google Scholar] [CrossRef]
- Castillo, N.E.; Vanga, R.R.; Theethira, T.G.; Rubio-Tapia, A.; Murray, J.A.; Villafuerte, J.; Bonder, A.; Mukherjee, R.; Hansen, J.; Dennis, M.; et al. Prevalence of Abnormal Liver Function Tests in Celiac Disease and the Effect of a Gluten-Free Diet in the US Population. Am. J. Gastroenterol. 2015, 110, 1216–1222. [Google Scholar] [CrossRef]
- Felber, J.; Aust, D.; Baas, S.; Bischoff, S.; Bläker, H.; Daum, S.; Keller, R.; Koletzko, S.; Laass, M.; Nothacker, M.; et al. Results of a S2k-Consensus Conference of the German Society of Gastroenterolgy, Digestive-and Metabolic Diseases (DGVS) in conjunction with the German Coeliac Society (DZG) regarding coeliac disease, wheat allergy and wheat sensitivity. Z. Gastroenterol. 2014, 52, 711–743. [Google Scholar] [CrossRef] [Green Version]
- Pham, H.T.; Arnhard, K.; Asad, Y.J.; Deng, L.; Felder, T.K.; St John-Williams, L.; Kaever, V.; Leadley, M.; Mitro, N.; Muccio, S.; et al. Inter-Laboratory Robustness of Next-Generation Bile Acid Study in Mice and Humans: International Ring Trial Involving 12 Laboratories. J. Appl. Lab. Med. 2016, 1, 129–142. [Google Scholar] [CrossRef] [PubMed] [Green Version]
- Reeder, S.B.; Sirlin, C.B. Quantification of Liver Fat with Magnetic Resonance Imaging. Magn. Reason. Imaging Clin. N. Am. 2010, 18, 337–357. [Google Scholar] [CrossRef] [PubMed] [Green Version]
- Hahnemann, M.L.; Nensa, F.; Kinner, S.; Köhler, J.; Gerken, G.; Umutlu, L.; Lauenstein, T.C. Quantitative Assessment of Small Bowel Motility in Patients with Crohn’s Disease Using Dynamic MRI. Neurogastroenterol. Motil. 2015, 27, 841–848. [Google Scholar] [CrossRef] [PubMed]


| Controls (n = 20) 17 Female/3 Male | Celiac Disease (n = 20) 19 Female/1 Male | p-Value | |
|---|---|---|---|
| Age | 29.5 (median) | 30.0 (median) | n.s. |
| SIBO-positive | 2/20 | 1/20 | n.s. |
| Body mass index (kg/m2) | 23.13 ± 4.60 | 23.22 ± 0.94 | n.s. |
| TEM (kPa) | 5.65 ± 0.59 | 4.39 ± 0.29 | n.s. |
| Body Fat Mass BIA (%) | 18.14 ± 9.62 | 19.74 ± 8.93 | n.s. |
| Total bile acids (µmol/L) | 4.43 ± 1.09 | 3.26 ± 0.04 | n.s. |
| Cholesterol (mg/dl) | 188.10 ± 39.50 | 194.80 ± 52.08 | n.s. |
| HDL (mg/dl) | 71.75 ± 18.58 | 62.95 ± 12.66 | n.s. |
| Triglycerides (mg/dl) | 79.50 ± 39.91 | 82.00 ± 37.01 | n.s. |
| HbA1c (%) | 5.33 ± 0.24 | 5.30 ± 0.34 | n.s. |
| Platelets (n/dl) | 240.50 ± 45.79 | 243.00 ± 56.59 | n.s. |
| INR | 0.99 ± 0.04 | 0.99 ± 0.05 | n.s. |
| ALT (U/L) | 19.30 ± 1.27 | 26.50 ± 4.57 | n.s. |
| AST (U/L) | 22.50 ± 2.53 | 22.35 ± 1.37 | n.s. |
| Alkaline phosphatase (U/L) | 60.25 ± 17.62 | 57.75 ± 13.19 | n.s. |
| Bilirubin (mg/dl) | 0.68 ± 0.32 | 0.63 ± 0.34 | n.s. |
| γGT (U/L) | 13.90 ± 7.35 | 18.30 ± 22.02 | n.s. |
| LDH (U/L) | 181.10 ± 51.28 | 168.10 ± 20.11 | n.s. |
| GLDH (U/L) | 2.81 ± 2.80 | 3.30 ± 2.35 | n.s. |
| M30 (U/L) | 88.91 ± 6.00 | 142.40 ± 21.40 | * |
| M65 (U/L) | 169.30 ± 14.18 | 200.40 ± 24.34 | n.s. |
| LBP1 (ng/mL) | 89.25 ± 16.05 | 89.66 ± 18.05 | n.s |
| Calprotectin, feces (µg/g) | 40.49 ± 4.99 | 52.60 ± 7.77 | n.s |
Publisher’s Note: MDPI stays neutral with regard to jurisdictional claims in published maps and institutional affiliations. |
© 2022 by the authors. Licensee MDPI, Basel, Switzerland. This article is an open access article distributed under the terms and conditions of the Creative Commons Attribution (CC BY) license (https://creativecommons.org/licenses/by/4.0/).
Share and Cite
Manka, P.; Sydor, S.; Schänzer-Ocklenburg, J.M.; Brandenburg, M.; Best, J.; Vilchez-Vargas, R.; Link, A.; Heider, D.; Brodesser, S.; Figge, A.; et al. A Potential Role for Bile Acid Signaling in Celiac Disease-Associated Fatty Liver. Metabolites 2022, 12, 130. https://doi.org/10.3390/metabo12020130
Manka P, Sydor S, Schänzer-Ocklenburg JM, Brandenburg M, Best J, Vilchez-Vargas R, Link A, Heider D, Brodesser S, Figge A, et al. A Potential Role for Bile Acid Signaling in Celiac Disease-Associated Fatty Liver. Metabolites. 2022; 12(2):130. https://doi.org/10.3390/metabo12020130
Chicago/Turabian StyleManka, Paul, Svenja Sydor, Julia M. Schänzer-Ocklenburg, Malte Brandenburg, Jan Best, Ramiro Vilchez-Vargas, Alexander Link, Dominik Heider, Susanne Brodesser, Anja Figge, and et al. 2022. "A Potential Role for Bile Acid Signaling in Celiac Disease-Associated Fatty Liver" Metabolites 12, no. 2: 130. https://doi.org/10.3390/metabo12020130