
Abstract
Acetone is one of the most abundant volatile compounds in the human breath and might be important for monitoring diabetic patients. Here, a portable acetone sensor consisting of flame-made, nanostructured, Si-doped WO3 sensing films was used to analyse the end tidal fraction of the breath (collected in Tedlar bags) from eight healthy volunteers after overnight fasting (morning) and after lunch (afternoon). After breath sampling, the gaseous components were also analysed by proton transfer reaction time-of-flight mass spectrometry (PTR-TOF-MS), and each person's blood glucose level was measured. The portable sensor accurately detected the presence of acetone with fast response/recovery times (<12 s) and a high signal-to-noise ratio. Statistical analysis of the relationship between the PTR-TOF-MS measurements of breath gases (e.g., acetone, isoprene, ethanol and methanol), sensor response and the blood glucose level was performed for both sampling periods. The best correlations were found after overnight fasting (morning): in particular, between blood glucose level and breath acetone (Pearson's 0.98 and Spearman's 0.93). Whereas the portable sensor response correlated best with the blood glucose (Pearson's 0.96 and Spearman's 0.81) and breath acetone (Pearson's 0.92 and Spearman's 0.69).
Export citation and abstract BibTeX RIS
Introduction
The potential significance of breath analysis in clinical diagnoses has been increasingly recognized in the literature [1, 2]. Breath analysis is one of the least invasive procedures for monitoring diseases and is particularly attractive for patients who have to control physiological parameters, such as diabetics who monitor routinely their blood glucose level. Among all of volatile organic compounds (VOCs) and gases in the human breath, acetone is one of the most abundant. Its breath concentration increases in patients with uncontrolled diabetes [3, 4], during normal overnight sleep in healthy individuals (up to five-fold) [5] and during prolonged fasting (by a factor of approximately 20) [6]. The acetone concentration in the breath decreases after a protein-rich meal, reaching a minimum after about 4 h [7]. The correlation between breath acetone and oxidative stress is a promising tool for monitoring the state of patients during surgery [8].
Several methods can be used for measurements of breath composition [9], including gas chromatography with mass spectrometry [10], proton transfer reaction-mass spectrometry (PTR-MS) [11, 12], selected ion flow tube-mass spectrometry [13, 14] and differential mobility spectroscopy (DMS) [15]. These techniques provide detailed characterization of breath composition; however, the instruments for these methods are bulky, except for that for DMS, which can be miniaturized [16].
Considerable interest exists in the development of hand-held devices for reliable monitoring of specific breath markers [17]. For this task, chemo-resistive gas sensors based on semiconductor nanoparticles are attractive materials for breath analysis [18]; these sensors offer low fabrication costs, high sensitivity, a sufficiently low limit of detection and high miniaturization potential [19, 20]. Portable gas sensors made of Si-doped WO3 nanoparticles have already been applied to the continuous monitoring of breath acetone from healthy subjects during rest or physical activity [21]. These measurements were in agreement (>98%) with simultaneous PTR-MS analysis of the same breath samples. The signal-to-noise ratio of the breath acetone concentrations measured by these sensors was high, and the response time was approximately half a minute [21].
Breath analysis can be achieved either with off-line [10, 22] or with on-line sampling and analysis [13, 23]. Both off- and on-line techniques have advantages and disadvantages. Off-line gas sampling is already well established and can be achieved using flexible storage bags, compound traps or rigid canisters [24]. Flexible storage bags usually are available at a lower cost than canisters or traps and can be more practical to handle and transport. Off-line measurements could be more attractive for specific clinical trials [25] for which real-time measurements of exhaled breath are difficult (e.g., reproducibility of the measurements). A collected breath sample also provides a steady-state condition at a given time that might be valuable for correlations with other variables, such as blood glucose levels.
Diabetes is a chronic disease that requires continuous medical care and careful patient self-management to prevent serious complications. Blood glucose levels are the most common measurements for diagnosing and monitoring diabetes. Checking blood glucose levels might also be important during pregnancy, in pancreatitis and with aging [26]. Turner et al [27] showed that the concentration of breath acetone declined linearly with decreasing blood glucose concentration in eight patients with type-1 diabetes who had been infused with insulin to lower their blood glucose levels to normal ones. In two different studies that included ten healthy individuals, blood glucose concentrations were predicted using multi-linear regression analysis after the glucose dosing (either by oral intake or infusion) [28, 29]. Methyl nitrate concentrations in the breath have been reported to strongly correlate with hyperglycaemia in type-1 diabetes patients [30]. Nevertheless, sufficient evidence does not yet exist to establish a clear correlation between the levels of exhaled breath components and blood glucose that would allow the replacement of common glucose tests with breath analyser tests. Furthermore, different breath markers could correlate with glucose levels under different conditions, e.g., fasting, hypo- or hyper-glycaemia.
Here, a portable acetone sensor consisting of flame-made, Si-doped, WO3 films [18] was used to analyse the end tidal fraction of the breath collected in Tedlar bags from eight volunteers after overnight fasting and after lunch. These samples were analysed simultaneously by proton transfer reaction time-of-flight mass spectrometry (PTR-TOF-MS) [21]. Furthermore, blood glucose levels were measured for each person after breath sampling to investigate possible correlations with the specific breath markers and the sensor response.
Experimental section
Detector fabrication
A flame spray pyrolysis (FSP) reactor was used for synthesis and direct deposition of 10 mol% Si-doped WO3 nanoparticle films [31] onto Al2O3 substrates featuring a set of interdigitated Pt electrodes. A solution of ammonium (meta)tungstate hydrate (Aldrich, purity > 97%) and hexamethyldisiloxane (HMDSO, Aldrich, purity > 99%) was created as necessary for the final SiO2 content (10 mol%) and diluted in a 1:1 (volume ratio) mixture of diethylene glycol monobutyl ether (Fluka, purity > 98.5%) and ethanol (Fluka, purity > 99.5%) to a total metal (Si and W) concentration of 0.2 M [31]. This solution was supplied at a rate of 5 mL min–1 through the FSP nozzle and dispersed into a fine spray with 5 L min−1 of oxygen (pressure drop 1.5 bar). This spray was ignited by a supporting ring-shaped premixed methane/oxygen flame, as explained in more detail elsewhere [31]. The nanoparticle film composition was selected for optimal thermal stability, selectivity and sensitivity, even in humid conditions [18]. The alumina substrate (0.8 mm thick) contained interdigitated Pt lines (sputtered, 350 µm width and spacing), a Pt resistance temperature detector on one side and a Pt heater on the other. The overall dimensions of the alumina substrate were 15 mm × 13 mm (Electronic Design Center, Case Western Reserve University, Cleveland, OH, USA).
Breath sampling
Eight volunteers (7 males and 1 female) between 22 and 55 years old participated in this study. All of these subjects were generally in good health, had no record of recent or chronic illness, did not smoke and were not taking any medication. The sampling bags used were 3 L Tedlar bags (SKC, Eighty Four, PA, USA) with a wall thickness of approximately 50 µm. Exhaled breath was collected in the bag by a breath-sampling device (developed in-house) that was triggered by the CO2 level (>3%) to specifically sample the end-tidal phase of exhalation. The subjects exhaled without nose clamps into the mouthpiece of the device. Prior to sampling, the bags were thoroughly flushed with N2 gas to remove residual contaminants (6.0, Linde, Stadl Paura, Austria) and then filled with N2 and heated at 85 °C for more than 8 h. At the end of the heating period, the bags were completely evacuated and flushed with additional N2.
Breath characterization
Sensors were placed inside a small T-shaped chamber, as described in detail elsewhere [21]. The sensor response (S) is given by: S = Rair/Rbreath − 1, where Rair is the film resistance in ambient air and Rbreath is the film resistance after the film has been exposed to a breath sample. The sensor response time is the time needed to reach 90% of the steady-state sensor response to the breath. The recovery time is the time required to recover 90% of the sensor response to the baseline resistance (ambient air, Rair).
Prior to analysis of the breath samples, the bags were allowed to stabilize for 1 h in a chamber at 40 °C (figure 1). This stabilisation time allowed the system to reach a steady-state and constant relative humidity (RH) (ambient). Then, the bags were directly connected (at constant flow) to the sensors and to a high-sensitivity PTR-MS (Ionicon Analytik GmbH, Innsbruck) in parallel with a high-sensitivity PTR-TOF-MS (Ionicon Analytik GmbH, Innsbruck) with a measurement accuracy of about 1% [32, 33]. Prior to and between each bag measurement, ambient air was supplied. Furthermore, a short pulse of synthetic air was used to purge the lines when ambient air was switched to bag gases, and vice versa, to avoid contamination by residues from the previous measurements. The ionization conditions were controlled by the drift voltage (600 V), the drift temperature (60 °C) and the drift pressure (2.2 mbar). The acetone, ethanol, methanol and isoprene signals were measured in units of counts per second and at mass-to-charge ratios (m/z) equal to 59.049, 47.049, 33.033 and 69.069, respectively.
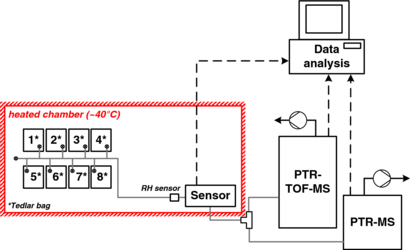
Figure 1. Schematic of the experimental setup for the analysis of breath collected in Tedlar bags (1–8). A humidity sensor (RH sensor) was used to monitor the water content and temperature of the breath entering the device chamber. The breath flow (grey lines) was kept constant by the PTR-MS and PTR-TOF-MS pumps. All of the data (dashed lines) were collected and analysed by the computer.
Download figure:
Standard image High-resolution imageBlood glucose characterization
Blood glucose levels were determined using a commercial Contour Blood Glucose meter (Bayer Vital, GmbH) and test strips (0.6 µl blood sample). The diurnal profiles (blood glucose levels in mmol L−1) of two healthy people were measured before and after lunch (at intervals of approximately 20 min for 3 h), and a reference value was measured in the morning after overnight fasting. For all of the volunteers, blood glucose levels were measured after breath sampling, specifically, after overnight fasting and after lunch (approximately 1 h after the meal).
Results and discussion
Blood glucose
Blood glucose levels vary during the day and from day to day, even for the same person [34]; blood glucose levels also depend on diet [35], stress, medications and physical activity [36]. We observed such variation in this investigation by measuring the fasting blood glucose (FBG) for a single healthy subject for seven mornings. Slight fluctuations in FBG were observed; however, this variation was only approximately 0.4 mmol L−1 with an average FBG of 4.86 mmol L−1. The strongest variation in blood glucose concentration occurs during the daytime, particularly after meals [35]. Figure 2 shows the blood glucose fluctuation for two healthy subjects before and after lunch. The blood glucose increased to 7.3 and 7.9 mmol L−1 for subjects S1 and S2, respectively, approximately 30 min after the meal. This increase in blood glucose concentration after meals is in agreement with results reported in the literature [35], showing that after meals (within 1 h) each person might have different blood glucose concentration profiles [36]. This observation primarily results from individual differences in metabolism and glucose control (e.g., by insulin) [37]. Therefore, comparable and reproducible measurements are more difficult to obtain after food intake. The American Diabetes Association recommends the FBG test (usually measured after at least 8 h of fasting) for diabetes diagnosis [38].
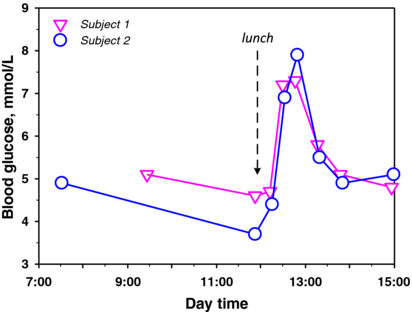
Figure 2. Blood glucose concentrations of two representative healthy subjects.
Download figure:
Standard image High-resolution imageThe blood glucose levels of all eight subjects tested in this study are reported in table 1. The morning (after overnight fasting) measurements, or FBG, were within the same range (4.8–5.8 mmol L−1) for all of the subjects, except for subject S7, who showed a higher blood glucose level (7.9 mmol L−1). According to the American Diabetes Association, such a blood glucose level may already indicate diabetes (>7 mmol L−1) [38]. In the afternoon (after lunch), the level of blood glucose of three of the subjects (S3, S6 and S7) decreased, whereas the blood glucose levels of the other subjects remained constant or increased, as would be expected after food intake (figure 2). Furthermore, the relative increase in blood glucose can be high (S2) or low (S5) depending on the individual's metabolism, glucose regulation (as previously discussed) and meal composition (e.g., whether a sugar/starch-rich meal is ingested) [35], which was not standardized here.
Table 1. Morning and afternoon measurements of VOCs, blood glucose and sensor response of eight subjects.
| PTR-TOF-MS counts (−) of VOCs (σ) | |||||||
|---|---|---|---|---|---|---|---|
| Time | Subject no. | Acetone | Ethanol | Methanol | Isoprene | Blood glucose (mmol L−1) | Sensor response (−) |
| Morning | S1 | 14478 (374) | 195 (2) | 4794 (38) | 2232 (79) | 4.9 | 0.89 |
| S2 | 10239 (195) | 248 (4) | 1829 (10) | 2241 (62) | 4.8 | 0.77 | |
| S3 | 19719 (621) | 308 (7) | 3937 (39) | 3902 (63) | 5.8 | 1.15 | |
| S4 | 16624 (378) | 274 (14) | 4657 (23) | 733 (14) | 5.1 | 0.75 | |
| S5 | 16958 (796) | 246 (4) | 3697 (29) | 1076 (15) | 5.3 | 0.76 | |
| S6 | 18752 (527) | 1036 (10) | 2068 (22) | 2515 (18) | 5.4 | 0.9 | |
| S7 | 40953 (311) | 2321 (38) | 18031 (255) | 1649 (12) | 7.9 | 1.65 | |
| S8 | 16838 (36) | 187 (2) | 4633 (32) | 2356 (30) | 5.6 | 1.06 | |
| Afternoon | S1 | 13628 (68) | 278 (3) | 3871 (31) | 2046 (17) | 5.7 | 0.87 |
| S2 | 16753 (194) | 560 (5) | 1916 (7) | 1678 (27) | 7 | 0.98 | |
| S3 | 17794 (304) | 408 (12) | 5353 (26) | 3410 (25) | 5.3 | 1.06 | |
| S4 | 15401 (38) | 262 (27) | 5687 (31) | 978 (17) | 4.9 | 0.77 | |
| S5 | 18218 (62) | 189 (4) | 2919 (19) | 1518 (12) | 5.5 | 0.88 | |
| S6 | 18080 (15) | 581 (29) | 2052 (15) | 3120 (16) | 4 | 1.1 | |
| S7 | 12805 (156) | 483 (3) | 3860 (30) | 1885 (26) | 6.2 | 1.01 | |
| S8 | 24687 (166) | 383 (11) | 4214 (20) | 1492 (11) | 5.9 | 1.12 | |
Exhaled breath characterization
Water vapour, a major component of human breath that is measured by the breath RH, varies between 89 and 97% [39] and can affect the response of a chemo-resistive gas sensor [40]. The water vapour concentration in Tedlar bags decreases rapidly [24] because water molecules rapidly diffuse out of the polymer bag [41] as a result of the RH gradient between the inside and the outside of the bag. Therefore, standardization during sampling and measurements is critical. For example, strong variations in the breath water content may influence the sensor response and the PTR-TOF-MS signal and should therefore be avoided. Hence, the bags were stored in a chamber at 40 °C for 1 h prior to the measurements to stabilize the RH in the bags. During this incubation, the RH decreased from approximately 90% (average breath content) to less than 30%.
Figure 3 shows the water content (blue line, left axis) and the RH (black line, right axis) as functions of time (after 1 h of stabilization). The water concentration decreased asymptotically towards the ambient air water content (approximately 5% RH at 40 °C). This slight decrease in the RH had a negligible effect on the sensor response, which remained rather constant during the measurements for each subject. Although the sensor response slightly increased with decreasing RH, the sensor resistance was not affected, which confirmed that these sensors were not sensitive to water, as had been previously reported [21]. In addition, other authors have reported that, when relevant breath components (e.g., acetone) were sampled in similar Tedlar bags, the samples were preserved in storage for more than 10 h [24]. This result was also confirmed here: the exhaled-breath acetone concentration measured by PTR-TOF-MS did not change (at least during an observation time of 4 h).
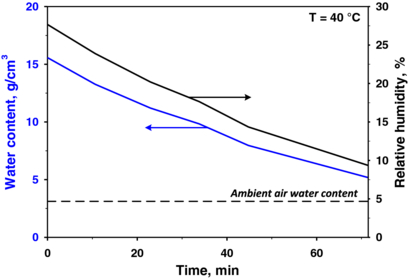
Figure 3. Relative humidity and water content measurements inside a Tedlar bag 1 h after sampling at a constant temperature (40 °C). The water content decreased asymptotically towards its ambient value.
Download figure:
Standard image High-resolution imageFigure 4(a) shows the PTR-TOF-MS signals of acetone (pink line) and ethanol (green dotted line) compared to the Si:WO3 sensor signal (black line) of exhaled breath (collected in bags) sampled from three subjects (S5, S6 and S7) after overnight fasting. These measurements are highlighted in this figure because of the relatively high difference between the acetone level and the ethanol level in the breath of these three subjects compared to the other subjects, whose acetone and ethanol levels were closer. Subjects S5 and S6 showed similar acetone signals (pink line), in agreement with their corresponding sensor responses (black line) of approximately 0.93 and 0.88, respectively. Subject S7, in contrast, showed a higher acetone signal, as measured by PTR-TOF-MS, and this result was also confirmed by the sensor response (1.65). In addition, the strong difference in breath ethanol content between S5 and S6 hardly affected the sensor response, which confirmed the high selectivity of these sensors for acetone [18, 21]. These results showed a reliable sensor response to different breath acetone concentrations from different subjects independent of the background ethanol concentrations.
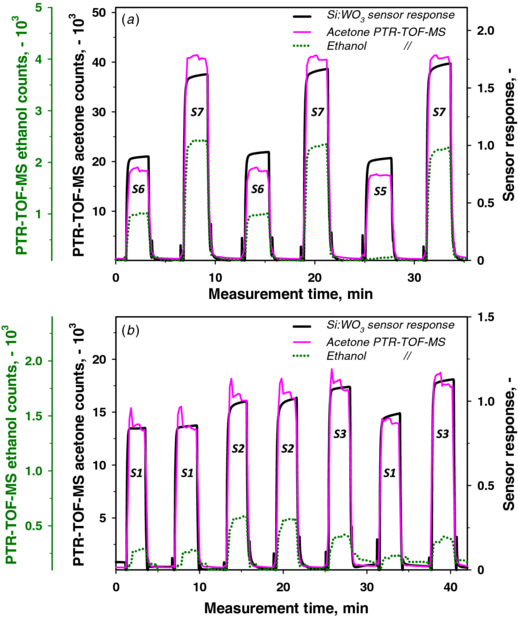
Figure 4. (a) Overnight fasting (morning) and (b) afternoon (approximately 1 h after lunch) exhaled breath PTR-TOF-MS signals of acetone (pink line) and ethanol (green dotted line) for different subjects compared to the portable sensor response (black line). The sensor response follows the acetone signals for every subject and is not disturbed by the different ethanol levels.
Download figure:
Standard image High-resolution imageThe results obtained from the PTR-TOF-MS acetone signal and the sensor responses were in agreement for most of the subjects during their afternoon measurement (approximately 1 h after lunch). Figure 4(b) shows the measurements from three subjects repeated twice or thrice to ensure reproducibility. More specifically, subject S1 showed a constant response, even after 30 min. The sensor responses of these three subjects followed consistently the corresponding PTR-TOF-MS acetone contents regardless of the ethanol levels as in the morning (figure 4(a)). Slight variations between sensor response and PTR-TOF-MS acetone signal were attributed to unsteady exhaled breath composition after lunch (figure 2) and even interfering trace gases. This was supported also by PTR-TOF-MS rather unsteady (spikes) acetone signals in figure 4(b) compared to the morning ones (figure 4(a)).
Figure 5 shows an example of the sensor response (black line) and the measured PTR-TOF-MS acetone concentration (pink line) from the breath of a single person (S3) for both morning and afternoon measurements. The agreement between the two measurements is consistent; the acetone concentration (calibrated PTR-TOF-MS) decreased from approximately 1600 to 1400 ppb after lunch, as expected [7], and the sensor response also exhibited this trend, accurately following the breath acetone concentration profile. Furthermore, the sensor response and recovery times were rapid (both were less than 12 s), which is an attractive feature for breath-analysis applications. The sensor showed a stable response to breath measurements and a very high signal-to-noise ratio (black line), even higher than that from continuous monitoring of breath acetone (on-line) from healthy subjects [21]. This result probably occurred because the analysed mixture (the breath collected in Tedlar bags) is more homogeneous than samples from continuous breathing [21], where the breath composition may change over time. Notably, the spikes observed before and after the sensor response are due to the line being purged with a short pulse of synthetic air when the system was switched from ambient air to bag gases, and vice versa.

Figure 5. The portable sensor response (black line) to a breath sample was consistent with the breath acetone concentration (or counts) measured by PTR-TOF-MS (pink line) for the same sample, after overnight fasting and after lunch.
Download figure:
Standard image High-resolution imageCorrelations between exhaled gases, sensor response and blood glucose
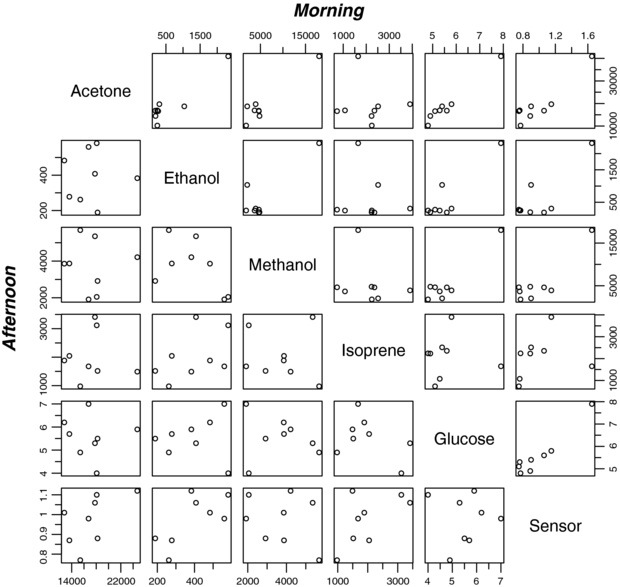
Table 1 shows the actual measurements of acetone, ethanol, methanol and isoprene concentrations (measured by PTR-TOF-MS), sensor response and blood glucose level for the eight subjects after overnight fasting (morning) and after lunch (afternoon): those six variables are plotted against each other (scatter plots) in figure 6 for morning (top right) and afternoon measurements (bottom left). In the morning there are a few linear relationships between variables such as between acetone, glucose and sensor while in the afternoon all variables are rather independent and less correlated to each other.
Figure 6. Scatter plot data of morning and afternoon measurements: acetone, ethanol, methanol and isoprene PTR-MS counts (−), blood glucose (mmol L−1) and sensor response (−) for eight subjects (test persons).
Download figure:
Standard image High-resolution image
Pearson's correlations were calculated from these six variables (table 2) for both morning (top) and afternoon (bottom) measurements. In the morning, the sensor response exhibited the highest correlation with blood glucose (0.96) and acetone (0.92), whereas high correlations were also obtained also among acetone, ethanol, methanol and blood glucose (0.90–0.98). These were statistically significant, at least, at the 99% confidence level [42]. Isoprene does not appear to correlate with any of the variables (<0.24) because it is also related to muscle activity [23] and here apparently less to cholesterol biosynthesis [43], as has also been observed with on-line breath sampling of subjects at rest and during physical activity [21].
Table 2. Pearson's correlations between sensor response, blood glucose and breath VOCs in the morning (fasting overnight) and afternoon (after lunch) for eight subjects.
| Morning | ||||||
|---|---|---|---|---|---|---|
| Afternoon | Acetone | Ethanol | Methanol | Isoprene | Glucose | Sensor |
| Acetone | 0.93 | 0.95 | −0.09 | 0.98 | 0.92 | |
| Ethanol | 0.02 | 0.86 | −0.11 | 0.90 | 0.81 | |
| Methanol | −0.04 | −0.49 | −0.22 | 0.93 | 0.88 | |
| Isoprene | 0.00 | 0.48 | −0.10 | 0.00 | 0.24 | |
| Glucose | −0.08 | 0.11 | −0.16 | −0.40 | 0.96 | |
| Sensor | 0.55 | 0.70 | −0.29 | 0.60 | −0.02 | |
In the afternoon, the correlations between gases (acetone, ethanol and methanol) and the blood glucose level became weaker and rather meaningless (table 2, bottom) because the blood glucose levels are known to change after meals. This finding is attributed to the metabolic system not being in a physiological steady state after food intake, in contrast to its state after overnight fasting, and it is therefore more complex to analyse under these conditions (e.g. additional disturbing VOCs). For completeness, the Spearman's rank correlations that are less sensitive to statistical outliers (e.g. S7 in table 1) have been calculated in table 3. These correlations are slightly lower than Pearson's but quite strong after overnight fasting (morning) between glucose and acetone (0.93) as well as between glucose and sensor (0.81) and respectable between acetone and glucose sensor (0.69). These were statistically significant at the 99, 95 and 90%, respectively, confidence level [44].
Table 3. Spearman's correlations between sensor response, blood glucose and breath VOCs in the morning (fasting overnight) and afternoon (after lunch) for eight subjects.
| Morning | ||||||
|---|---|---|---|---|---|---|
| Afternoon | Acetone | Ethanol | Methanol | Isoprene | Glucose | Sensor |
| Acetone | 0.67 | 0.24 | 0.24 | 0.93 | 0.69 | |
| Ethanol | −0.01 | 0.05 | 0.10 | 0.48 | 0.38 | |
| Methanol | −0.01 | −0.52 | −0.41 | 0.36 | 0.31 | |
| Isoprene | −0.17 | 0.55 | −0.21 | 0.31 | 0.60 | |
| Glucose | −0.24 | 0.14 | −0.33 | −0.19 | 0.81 | |
| Sensor | 0.55 | 0.60 | −0.17 | 0.33 | 0.05 | |
Previous studies that have involved the integrated analysis of breath ethanol and acetone have shown a good approximation of the blood glucose profile at a specific glucose load [28]. In a standard oral glucose tolerance test [28], the correlation between ethanol and glucose (0.55) was greater than that between acetone and glucose (0.40). However, further studies indicated that a correlation between single gases and blood glucose levels might not be possible because different exhaled VOC patterns could occur with similar glucose levels, depending on the overall systemic metabolic conditions [29]. A combination of multiple exhaled VOCs accurately predicted the blood glucose concentrations during the 2 h following an intravenous glucose dose [29]. Nevertheless, this might not be completely necessary at steady-state (e.g., after overnight fasting), as shown in the present correlations (table 2, morning). In addition, in a recent breath-analysis study, PTR-MS was used for gestational diabetes screening via an oral glucose tolerance test (OGTT) in 52 pregnant women [45]. The time evolution of oxidation products of glucose and lipids, acetone metabolites and thiols in breath after glucose intake correlated with diagnoses of gestational diabetes. This correlation is an additional indication that specific VOCs related to glucose metabolism analysis can be used for diabetes diagnosis [45] and for monitoring glucose levels. Our results are promising, even though the present study included only a relatively small cohort of volunteers; further investigations with a greater number of individuals and measurements are needed for stronger statistics.
Conclusions
A portable chemo-resistive sensor based on flame-made, Si-doped, WO3 nanoparticle films accurately monitored the acetone (measured by PTR-TOF-MS) concentration in the end-tidal fraction of breath, collected into Tedlar bags, from eight healthy individuals after overnight fasting (morning) and after lunch (afternoon). This sensor exhibited fast response and recovery times (<12 s), a high signal-to-noise ratio and minimal sensitivity to slight changes in relative humidity or ethanol content. Overnight fasting was confirmed to be a more stable metabolic state and is therefore more suitable for the extraction of correlations between sensor response, blood glucose level and exhaled breath components. The highest correlation coefficients (Pearson's) were those between blood glucose and breath acetone (0.98), and between blood glucose and sensor response (0.96) after overnight fasting (morning), statistically significant, at least, at the 99% confidence level. However, these correlations were weakened after lunch (afternoon). Additionally, Spearman's rank correlation coefficients that are less sensitive to statistical outliers (e.g. subject 7) were quite strong between blood glucose and acetone (0.93) as well as between glucose and sensor (0.81) in the morning, statistically significant, at least, at the 95% confidence level but deteriorated also in the afternoon. Even though higher number of individuals would be needed to obtain stronger statistics, these results hold promise for the further development of portable devices based on chemo-resistive gas sensors that could allow breath-based glucose testing for clinical applications.
Acknowledgments
This research was supported by the Swiss National Science Foundation, grant 200021_130582/1, and the European Research Council under the European Union's Seventh Framework Program (FP7/2007–2013, ERC grant agreement no 247283). AA and AS appreciate funding from the Austrian Federal Ministry for Transport, Innovation and Technology (BMVIT/BMWA, project 836308, KIRAS) and from the Austrian Agency for International Cooperation in Education and Research (OeAD, grant agreement no. SPA/04-158/FEM_PERS) and thank the government of Vorarlberg (Austria) for its generous support. The authors are also grateful to V Koren (ETHZ, Switzerland) and to H Wiesenhofer (Univ.-Clinic for Anesthesia, Innsbruck Medical University Austria) for their assistance.