


Abstract
The use of hadron beams, especially proton beams, in cancer radiotherapy has expanded rapidly in the past two decades. To fully realize the advantages of hadron therapy over traditional x-ray and gamma-ray therapy requires accurate positioning of the Bragg peak throughout the tumor being treated. A half century ago, suggestions had already been made to use protons themselves to develop images of tumors and surrounding tissue, to be used for treatment planning. The recent global expansion of hadron therapy, coupled with modern advances in computation and particle detection, has led several collaborations around the world to develop prototype detector systems and associated reconstruction codes for proton computed tomography (pCT), as well as more simple proton radiography, with the ultimate intent to use such systems in clinical treatment planning and verification. Recent imaging results of phantoms in hospital proton beams are encouraging, but many technical and programmatic challenges remain to be overcome before pCT scanners will be introduced into clinics. This review introduces hadron therapy and the perceived advantages of pCT and proton radiography for treatment planning, reviews its historical development, and discusses the physics related to proton imaging, the associated experimental and computation issues, the technologies used to attack the problem, contemporary efforts in detector and computational development, and the current status and outlook.
Export citation and abstract BibTeX RIS
Corresponding Editor Professor Steve Ritz
1. Charged-particle cancer therapy and treatment planning
More than half a century ago, Robert Wilson [1] recognized that charged particles held an intrinsic potential advantage for cancer therapy, compared with gamma rays and x-rays, and that accelerators capable of accelerating protons or heavier ions to sufficiently high energy would soon be readily available. Since the specific ionization (energy loss per unit distance) of non-relativistic ions varies nearly inversely with the kinetic energy, the radiological dose is greatest near the end of the ion path, in the 'Bragg Peak', named in honor of William Henry Bragg, who discovered the effect in 1903 [2]. Wilson proposed that with sufficient knowledge of the specific ionization, or 'proton stopping power', of the tissue between skin and tumor, the ion energy could be tuned such that the ions stop in the tumor, resulting in minimal dose proximal to the tumor and nearly zero dose distal to the tumor. See figure 1 for a comparison of charged-particle irradiation with x-ray or gamma irradiation, for which the depth of the ionizing interactions cannot be controlled. In the figure, the broad flat proton dose distribution in the tumor region is realized by superimposing Bragg peaks from protons of six different energies.

Figure 1. A comparison of depth doses for 15 MV photons and range/intensity modulated protons of variable energy. Reproduced from [4]. © IOP Publishing Ltd. All rights reserved.
Download figure:
Standard image High-resolution imageIt is clear that in order to take full advantage of this treatment modality, not only does the size of the beam need to be controlled to conform to the morphology of the tumor, but the incident proton kinetic energy must also be controlled independently at each location, in order to conform to both the depth of the cancerous tissue and the properties of the tissue in front of the tumor. Assuming a broad, diffuse proton beam, the lateral size can be controlled by collimators that are custom machined per patient, whereas the overall energy can be controlled by adjusting the accelerator (for a synchrotron or synchro-cyclotron) or by passing the beam though 'degrader' material (for an isochronous cyclotron). The lateral variation in energy can be achieved by passing the beam through a custom-machined plastic 'compensator', which is thicker in regions where less penetration is desired in the patient and thinner where deeper penetration is needed. See [3] for a recent thorough review of the physics behind proton therapy.
See [4] for a review of proton therapy itself, which is outside of the scope of this article. However, it is worth acknowledging here that proton therapy remains controversial, mainly because of its high cost relative to x-ray facilities. A cost-benefit analysis is difficult, because despite the fact that from a purely physics standpoint one expects substantial benefits from proton therapy, due to its better ability to localize the radiation, those benefits in general have not been quantified and proven in large random trials. One difficulty in making comparisons with x-ray treatment is that the x-ray field is more mature, and therefore more advanced, than the field of proton treatment. In particular, it is not valid to compare 'old fashioned' proton treatment, done as described above by use of a diffuse beam together with static collimators and compensators, to advanced intensity modulated radiation therapy (IMRT), a sophisticated x-ray treatment modality in which the radiation dose is made to conform more precisely to the three-dimensional shape of the tumor by modulating the intensity of the radiation beam in multiple small volumes. In fact, proton therapy is now moving away from static collimators and compensators toward greater use of intensity modulated proton therapy (IMPT), a new modality in which a 'pencil beam'1 is scanned across the patient while the beam energy and intensity are modulated according to the treatment program, which could include treatment from multiple directions. IMPT not only allows proton therapy to be applied to tumors that could not be accessed via the older proton-therapy treatment methods, but also allows better control of the dose distribution, and thereby greater success in sparing critical organs from harmful radiation doses. For example, x-ray irradiation of breast cancers is known to increase the risk of subsequent major coronary events [7, 8], but IMPT can deliver the needed irradiation with minimal dose to the heart. Proton therapy has to be evaluated not just in terms of the success of the irradiation in destroying the cancer, but most importantly in terms of how well the effects of the radiation on the rest of the body are minimized. That is difficult to assess when the deleterious effects may not become apparent until years later [8], for example when the breast-cancer survivor has a heart attack. Fortunately, randomized trials are now getting underway to make direct comparisons between IMRT and IMPT. For example, see [9].
Even with the advent of IMPT, the field of proton therapy has almost certainly not yet reached its full potential. One problem that remains to be satisfactorily resolved is the so-called 'range problem'. Clearly, for proton therapy to be successful, the range of the therapy protons in the tissue of the patient must be accurately known in advance, in order to plan the treatment and then machine the compensator or program the IMPT. Up to now the proton 'stopping power' (often called  by particle physicists) of the tissue has been estimated from x-ray CT images by converting the x-ray absorption (linear attenuation coefficient) measured in Hounsfield units (HU) to proton 'relative stopping power' (RSP), the stopping power expressed relative to that of water2. The transformation is usually calibrated by direct measurement of both the water-equivalent path length of protons (WEPL, which is a path-integral of the RSP, or the length of a path in water that would produce the observed proton energy loss) and the photon attenuation in various tissue-equivalent materials. A problem with this approach is that x-rays interact very differently with materials compared with protons, resulting in relations between HU and RSP that are not unique, and can therefore be ambiguous. Artifacts in x-ray images can produce additional errors. Range errors of 5% in the abdomen [10] and up to 11% in the head [11] have been reported. More recent work predicts typical errors of
  % and
% and  % for bone and soft tissue respectively [12], although the presence of higher density materials, and the resulting beam-hardening artifacts, can result in larger errors for specific cases, depending on the position of the sample within the body and the size of the body. In general, errors in the range prediction increase with the complexity of the geometry through which the protons must pass, but the use of Monte Carlo simulations can be a significant aid in reducing the uncertainties [13]. Reference [14] supports the estimates of [12] with in vivo measurements of proton range based on MRI imaging of radiation-induced changes in spinal bone marrow. See the review [15] for more information on in vivo range verification.
Various approaches are being taken, in addition to Monte Carlo simulations, to improve proton range predictions. One, called dual-energy CT (DECT) [16], combines information from two images made using different x-ray energies in order to resolve the ambiguities in the HU to RSP conversion. Another approach is to measure the RSP directly by using protons. That can perhaps be satisfactorily accomplished through use of a proton radiograph to correct the RSP map obtained from x-ray CT, or by quality control of the compensators derived from x-ray CT measurements [17, 18]. Or, for the purpose of treatment planning, one could replace the x-ray CT entirely, in favor of a proton CT scan of the patient.
Whereas solving the range problem is a principal motivation of proton radiology and CT, it is not the only motivation. Early on, it was realized [19] that proton radiography potentially provides better density resolution and tissue contrast, compared to conventional x-ray imaging3, and more recent work appears to bear that out [20]. Proton radiography could also provide quick verification of patient setup in a cancer treatment facility, with very low radiological dose, and an appropriate radiography system might also be suited to real-time monitoring of the treatment beam [21]. Also, proton CT does not suffer from artifacts that often appear in reconstructions of x-ray CT scans, particularly as a result of metallic inserts (see section 6 and figure 14).
Of course, to do a radiograph or a proton-CT scan of a patient, the protons necessarily have to pass completely through the patient. Therefore, they must be of significantly higher energy than the protons used in the cancer treatment itself, which may seem to detract from the advantage of making a direct measurement of the proton stopping power. In fact, proton stopping power does depend strongly on the proton energy, but fortunately that dependence is nearly material independent, such that the relative stopping power (RSP) is close to being energy independent over the relevant energy ranges. For example, from the NIST tables of proton stopping power [22], the RSP of polystyrene (its stopping power in MeV cm2  divided by the equivalent quantity for water) varies by only
  % from 10 MeV to 200 MeV, whereas the RSP of propane-based tissue-equivalent gas varies by
  % over the same energy range. Therefore, measurements of RSP made using fully penetrating protons still represent nearly direct measurements of the RSP needed for treatment planning. However, there does remain a problem that most existing proton therapy centers cannot provide a beam sufficiently high in energy to pass through the thickest parts of the body of many patients.
2. A short history of proton radiography and CT
The idea of using pCT for the purpose of proton-therapy treatment planning was clearly outlined in Cormack's seminal 1963 paper on how to reconstruct images from sets of line integrals, as the last of three radiological applications that he proposed [23]. That decade also saw developing interest in proton radiography, exemplified by Andrew Koehler's 1968 publication in Science [19], which emphasized high contrast while acknowledging poor spatial resolution: 'Energetic protons from an accelerator may be used to produce radiographs showing unusually high contrast but relatively poor spatial resolution'. Cormack and Koehler also participated in the first laboratory implementation of pCT in the mid 1970s, using a 158 MeV pencil beam to image a phantom with small ( %) density variations [24]. Around the same time, Ronald Martin et al at the Argonne National Laboratory proposed building proton accelerators dedicated to diagnostic work, including pCT [25], and in 1977 Martin, together with Ken Hanson and Bill Steward, a University of Chicago M.D., proposed to the NIH 'Development of a prototype proton CAT scan system' [26]. With a 205 MeV beam from a proton synchrotron, the Argonne team of Stephen Kramer, Martin, Steward et al demonstrated significant dose reduction and improved density resolution relative to conventional x-ray techniques [27]. During the 1970s Koehler and Steward's interest in proton radiography continued, with applications to detection of strokes [28] and tumors [29], diagnosis of breast carcinoma [30], and imaging of a brain tumor [31].
Through the 1980s, work proceeded on development of pCT. In 1981, at Los Alamos National Lab, Hanson used protons in a scanned pencil beam (1 mm FWHM minimum width and 6 milliradian divergence) to image a variety of phantoms and human organs [32]4. In his studies of pCT, Hanson emphasized a possible dose advantage of a factor of  relative to x-ray CT [34] but did not consider possible advantages for treatment planning, probably because charged-particle cancer therapy at that time was in its infancy, and therefore rarely used. In 1987, Takada et al at Tsukuba [35] were able to complete pCT scans in eight minutes using a system with 13 pencil beams and a large magnetic spectrometer to measure the residual energy. In 1999 Zygmanski et al at the Massachusetts General Hospital (MGH) [36] implemented a very different method to accomplish proton CT—using a cone-beam, modulated in energy, such that the integrated rate of protons entering a detector depended on the fraction ranging out in the phantom, giving an intensity–depth correlation similar to what is seen with x-ray absorption.
The latter two systems did not measure individual protons, and necessarily assumed straight paths through the phantom. Hanson's apparatus did measure individual protons—using a multi-wire proportional chamber to measure individual proton exit locations—but it still had to assume straight paths through the phantom, and was too slow to be clinically useful—requiring about 10 h to complete a scan. The early proponents of pCT did realize, however, that measurement of individual proton trajectories both before and after the object being imaged could lead to major improvements (see section 8.4 in [35], for example) and that future data acquisition systems would be able to accomplish a full scan in that way within a clinically useful time span. In [34] Hanson forecast a system capable of measuring 108 individual proton histories in 10 s, a rate that he wrote was possible with technology of the day, assuming sufficient parallel processing. Thirty years later, our technology is certainly up to the task—as some large, expensive data acquisition systems in contemporary major particle-physics experiments acquire data at even higher rates. Nevertheless, measurement of 107 proton histories per second is still difficult to accomplish with the modest resources generally available in this field, although—as shown below—several existing pCT and particle radiography systems do successfully operate within a factor of ten of that goal.
3. Physics and technology of particle detection for proton imaging
Since the turn of the century, the challenges and opportunities of proton CT and radiography have led to an increasing number of collaborations in which experimental particle physicists with expertise in data acquisition and particle detection technologies work together with medical physicists on the subject, motivated by the rapidly expanding availability of medical centers for proton cancer therapy. The various ongoing efforts are summarized in section 5, but first, this section discusses the major technological requirements for proton imaging, how they can be met by current instrumentation technology, and what fundamental limitations there are to both spatial and WEPL resolution. Although there is ongoing work on development of proton radiography and CT systems that measure integrated dose in order to minimize detector complexity and cost, this review concentrates on systems that attempt to achieve optimal spatial resolution along with excellent energy-loss resolution. That requires tracking and measurement of individual particles, in order to be able to take into account the large multiple scattering that is inevitable in any thick phantom. The single-particle approach may also be the only way to achieve the lowest possible radiological dose while still producing good, useful images.
A contemporary pCT scanner generally takes the form illustrated in figure 2 [37]. Thin tracking detectors measure the particle trajectories both entering and exiting the phantom5, from which the 'most likely path' (MLP) through the phantom can be estimated particle by particle. Note that a single layer in the front tracker would be sufficient if the incoming proton direction were well known. The second tracker is followed by an energy or range detector, usually in which the particles stop so that their residual energy or range can be measured. The beam is either fanned out into a cone to cover the instrument aperture (for example, by scattering in a thin foil) or else scanned across the aperture by magnets. The instrument must rotate around the phantom, or more easily the phantom can be rotated within the instrument, by at least  , either continuously or in discrete steps. For each particle, the instrument must provide the geometric path through the phantom together with the integrated energy loss, most conveniently in the form of the WEPL.
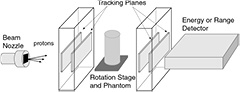
Figure 2. Schematic of a typical contemporary pCT scanner designed to measure individual proton histories.
Download figure:
Standard image High-resolution imageThe second half of the pCT problem is to reconstruct a three-dimensional image, or image slices, from the data—a process that is more complex than the equivalent reconstruction problem in x-ray CT, because of the curved paths. Early pCT experiments in which straight-line paths were assumed used efficient filtered-back-projection (FBP) techniques to reconstruct images. When the curved most-likely-path must be taken into consideration, the FBP technique is still possible, but is significantly more complicated [38]. Alternatively, algebraic reconstruction techniques (ART [39]) have the flexibility to incorporate curved paths, although at much greater computational expense. The image reconstruction problem is further discussed in section 4.
This review concentrates on radiography and computed tomography with proton beams, with only brief mentions of the closely related field of radiography and tomography with heavy ion beams. Carbon ions, for example, suffer relatively little multiple scattering in the phantom but, on the other hand, do suffer from substantial nuclear spallation. Those distinctions result in substantially different requirements for an effective detector system. Helium ions require much less energy than carbon in order to fully penetrate a phantom. With less spallation, they behave more like protons within the phantom, but with significantly reduced Coulomb scattering. Therefore, if helium ions were used in cancer therapy, using the beam also for imaging would be attractive, given the expected improved spatial resolution relative to proton CT. Proton-therapy centers vastly outnumber those using heavy ion therapy, and thus far in the United States there are none of the latter. Nevertheless, interest in heavy ion therapy is expanding, with a similar expansion of interest in heavy-ion imaging. See [40] for a recent review of heavy ion radiography and tomography. Recent reviews of proton radiography and computed tomography also exist. For example, see [41–43].
3.1. Particle energy and spatial resolution
In pCT, all of the incident protons must pass completely through the phantom, so that their energy loss may be measured. Therefore, the incident proton energy is generally at or near the maximum energy of the medical accelerator—typically 230 MeV to 250 MeV kinetic energy. From the NIST range tables [22], the projected range of a 250 MeV proton in water is about 38 cm—not enough to pass in all directions through the hip region of a typical adult, and far short of the shoulder-to-shoulder distance through a human male [44]. But even 200 MeV is sufficient for scanning a human head, and 250 MeV is sufficient for the lung region of most people, as long as the arms are raised out of the way. These facts, together with the typically small aperture of prototype pCT scanners, have led some groups working on pCT to concentrate on instruments that can image at least part of a human head.
Raising the proton energy above what is required to penetrate the phantom can improve the spatial resolution through reduced Coulomb scattering. The rms width of the angular distribution for multiple Coulomb scattering, projected onto a plane, can be approximated by equation (30.15) in [45]:
Here,  is the proton's speed and p its momentum, and
  is the number of radiation lengths of material traversed. For the non-relativistic protons of interest in proton therapy, the denominator is simply twice the kinetic energy, so the amount of scattering is approximately inversely proportional to the incoming proton kinetic energy. However, higher energies can result in more inelastic nuclear interactions, [46] and more importantly, higher energies generally result in reduced WEPL resolution. Therefore, there may exist an optimal energy below the accelerator's maximum, but the optimization depends on judgement of the relative importance of spatial versus WEPL resolution. One should keep in mind that if the image is to be used for treatment planning, then the objective is to map out the proton RSP on a useful spatial scale—not to make beautiful, high-resolution pictures.
For a two-layer tracking device, the error on the projection to the surface of the phantom can be characterized by a transverse displacement error and an angular error. The errors are limited by the point resolution of the detectors, and by multiple scattering in the detector material. For simplicity of discussion, we assume that the tracking is two-dimensional, carried out in two independent orthogonal views—which corresponds to the most commonly used technologies, such as scintillating fibers and silicon-strip detectors. The intrinsic angular resolution of the detectors depends on their point resolution divided by their spacing. The contribution from multiple scattering in the detectors depends mainly on the thickness of the detector layer closest to the phantom. For example, consider two silicon-strip layers, each 300 μm thick, with 250 μm strip pitch, and separated by 50 mm, with 50 mm distance between the second layer and the phantom. Assuming a simple binary readout of each strip (as opposed to pulse-height digitization that could be used to interpolate between strips), the rms point resolution is the strip pitch divided by  . That results in an intrinsic angular resolution for the set of two detectors of
  milliradians. The contribution from multiple scattering of 200 MeV protons in the last silicon layer (
 mm) is, from equation (1),
  milliradians. For the common situation in which two silicon layers, one for each view, are needed at each measurement plane, the multiple scattering contribution is increased by
  to
to  milliradians, nearly equal to the detector resolution contribution, giving a
  milliradian total angular uncertainty. This results in an uncertainty in the 50 mm extrapolation to the phantom of
  mm.
mm.
Systematic errors in tracking due to misalignment should also be considered. In the case that both front and rear trackers exist, corrections to the relative alignment of the four detector layers in each projection can be readily accomplished by use of proton data taken with no phantom present, and with the highest available beam energy. From millions of straight tracks, the alignment corrections can be adjusted to a sufficient precision that remaining errors are negligible. Alignment of the tracking relative to the phantom isocenter is then easily accomplished by imaging a narrow rod phantom.
Not surprisingly, the tracking uncertainties are small compared with the spatial uncertainties that result from the proton passage through a typical phantom, which for the purpose of this discussion we assume to be a cylinder of water with a diameter of 200 mm. The front and rear tracks both contribute to the prediction of a proton's path through the phantom. Consider, for example, trying to predict the location of the proton's path at the phantom center for a 200 MeV proton passing more-or-less along a diameter. From equation (30.19) in [45], the positional uncertainty at the phantom center due to multiple scattering, considering just the front track projection, will be  , but that is with the optimistic and incorrect assumption that the energy of the proton remains constant at 200 MeV, whereas it is expected to decrease to 150 MeV by the time it reaches the center of the phantom. In fact, the rear tracker tends to have significantly less predictive power than the front tracker, because the proton kinetic energy is reduced by the time it exits the phantom. Therefore, the point on the path with the largest predictive uncertainty lies beyond the center, as can be seen in figure 3, where the maximum error on the prediction of the path of a 200 MeV proton passing through 200 mm of water, calculated from both front and rear track vectors, is between
  mm and
  mm, and occurs about 115 mm from the phantom entrance.
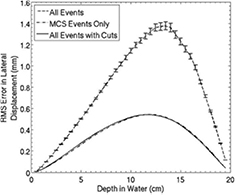
Figure 3. The Monte Carlo predicted deviation of the most likely path (MLP) of a proton from its actual trajectory, for 200 MeV protons passing through 200 mm of water. From [76] John Wiley & Sons. © 2008 American Association of Physicists in Medicine. Most large deviations due to simulated nuclear interactions and hard scattering were easily eliminated by cutting out events with large exit angles, leaving events affected mainly by multiple Coulomb scattering.
Download figure:
Standard image High-resolution imageEvidently, there is very little to be gained by improving the detector spatial resolution relative to the above silicon-strip example. Furthermore, given that the image spatial resolution near the phantom center will never be better than about  mm, the ideal voxel size in the image reconstruction will be in the range of
  mm to
mm to  mm.
mm.
3.2. Detector efficiency
Early optimistic predictions that proton CT and radiography would be imaging modalities with very low radiological dose were based on the expectation that detection of the protons would be highly efficient. Several technologies exist that, with care, can detect protons with nearly 100% efficiency while maintaining low noise levels. In fact, 200 MeV protons yield roughly double the ionization density of minimum ionizing particles typically of interest in particle physics, making the detection problem that much easier. However, near 100% efficiency of each detection layer is also more crucial in a typical pCT system than in a particle physics instrument with many redundant layers. In an instrument such as that described in figure 2, losing the signal from a single tracking layer can make the event unusable or at least significantly compromised. Even a seemingly respectable 95% single-plane efficiency results in a loss of 34% of the events when eight measurements are needed, aggravating the already difficult data acquisition problem one faces in trying to minimize the pCT scan time and correspondingly increasing the patient's radiological dose. And if a range detector is used to measure the WEPL, then it is crucial for each of the 60 or more layers to be close to 100% efficient, in order to identify the proton's stopping point reliably, although achieving that result is aided by the increased ionization inherent in the Bragg peak. High efficiency should be a high priority design goal.
Silicon strip detectors and some detectors that employ gas multiplication of ionization can readily yield particle detection efficiencies well above 99% with insignificant noise levels, at least until limited at high rates by signal pileup. Solid-state pixel detectors can do as well or better, at least in the case of those based on deeply depleted silicon diodes, and are far less susceptible to pileup. Scintillating fibers, while popular, have typically resulted in tracking systems with comparatively marginal signal-to-noise performance, even when employing relatively large fibers (e.g. 1 mm diameter) and some redundancy to cover gaps between fibers. As shown in more detail in section 5, instruments based on scintillating fiber tracking for which efficiency figures have been published yielded low detection efficiencies compared with their silicon-strip based counterparts. However, most have been intended only for proton radiography, for which high efficiency is of reduced importance compared to pCT.
Other factors beyond detector-layer efficiency result in significant losses of events. Nuclear interactions are common, occurring in 20% or more of proton events, depending on how much material is traversed. Those events must be eliminated by data filters to the extent possible, as they contribute confusion or noise to the final images. Similarly, hard Coulomb scattering events should be filtered out, as they do not fit into the MLP framework used to analyze the data. Typically, the filters rely on binning proton events that follow similar trajectories to identify and cut out tails in the WEPL and angle distributions. Overall, at most half of the events from protons that pass through the regions of interest end up being useful for image reconstruction, and that fraction can easily be far smaller if care is not taken with the detector efficiency.
The fraction used of all protons that trigger the detector system is typically much smaller, due to the simple fact that many miss the phantom entirely. Since human patients have not yet been involved in any of the tests of the systems discussed here, collaborations have not yet worried very much about this. A clinical system, however, will have to pay close attention to how well the beam conforms to the region of the patient being imaged, in order not to deliver unnecessary doses. Use of collimators in the beam nozzle will probably result in too many scattered, off-momentum protons that would confuse the image, so appropriate programming of a scanned beam will likely be the best choice.
3.3. WEPL resolution
Although spatial resolution may have the greatest impact on how the image appears to the eye, WEPL resolution and accuracy in a pCT image are more important for the purpose of treatment planning. The WEPL resolution depends not only on the design and performance of the detector system responsible for measuring residual energy or range, but also on the natural fluctuations in energy loss ('range straggling') in any degrader placed upstream of the detector, in the tracking detector, in the phantom and, for the case of a range detector, in the WEPL detector itself. Quality assurance assessment of treatment delivery is expressed in terms of of a percent dose difference ( ) and a 'distance to agreement' (DTA) in mm; recent work advocates for a goal of
  [47]. Therefore, to achieve the goal of improved treatment planning, we would like an RSP resolution and accuracy of one percent, to yield a range prediction at a typical depth of 100 mm with an error no worse than 1 mm [20].
A calorimeter can measure the proton residual energy directly, but because its resolution is generally proportional to the energy deposition, it tends to achieve poor resolution on the WEPL when it is short, since in that case a large measured energy is subtracted from the known beam energy to yield a small result for the energy lost in the phantom. The most straightforward WEPL detector is a range detector, which detects where the proton stops—typically by means of many thin sensor layers interleaved with absorber material. Assuming that the sensors can be made sufficiently thin and numerous, then the WEPL resolution is independent of WEPL and is dominated by range straggling, which for a 200 MeV proton in water is about 3 mm, or  % of its range6. Thus a small sample of measured protons along each path is sufficient, in principle, to achieve the needed resolution. Other detector variations exist. For example, the authors of [49] have built a hybrid of the calorimeter and range-detector concepts that employs five scintillation stages along the beam direction. The signal from each stage has to be digitized as in a calorimeter, but the advantage over a calorimeter is that protons with small WEPL in the phantom pass through several stages before stopping. In principle, the digitized signal is only of interest from the stage in which the proton stopped, as the previous stages contribute known amounts to the proton WEPL. Therefore, such a system does not suffer from poor resolution at short WEPL. For comparison, resolution models for the calorimetric, range counter, and hybrid concepts are illustrated in figure 4.

Figure 4. Models of WEPL resolution for various detector concepts, from [49], figure 2(a). The parameter n is the number of independent detector elements in depth, each of which measures the energy deposition, except for the case of the range counter, for which a simple threshold is applied to each detector signal to indicate the presence of the particle. Reproduced from [49]. CC BY 3.0.
Download figure:
Standard image High-resolution imageThe hybrid multi-stage scintillator concept has an advantage of far fewer channels than the range counter, but each channel must be more complex, as precise pulse-height digitization is necessary. The major advantage of a simple range counter, however, is simplicity of calibration. In fact, each channel of a range counter needs only a single threshold, the setting of which can be extremely stable and non-critical if a high signal-to-noise detector technology is employed. In that case, a single calibration run could be not only very simple to execute, but also sufficient for a long period of operation —and possibly even the life of the instrument. By contrast, calibration of a high precision calorimeter or multi-stage hybrid is complex and demanding, requiring measurements of, and corrections for, many effects such as spatial variations in light collection, nonlinearity—not only of electronics but also of detectors (e.g. Birk's law [50]), time-varying gains and pedestals, aging of components such as scintillators, variations from channel to channel, and in the case of the multi-stage concept, threshold and noise-dependent complexities in dealing with protons that stop near a boundary of two stages. In general, calibration errors will introduce visible artifacts into an image, and reduce the accuracy of proton stopping-power information derived for use in treatment planning.
Other, very different types of detector could be used for the measurement of residual energy. Examples that come to mind are magnetic spectrometers and time-of-flight counters, although neither has been employed in pCT prototype systems designed to track and measure individual protons. These two examples could give an advantage over range counters by avoiding range fluctuations and nuclear interactions in the counters themselves. However, magnetic spectrometers are too expensive, heavy, and bulky (e.g. see [35]), and time-of-flight counters would also be very bulky unless the timing resolution could be pushed to the level of around 10 ps, nearly an order of magnitude beyond the capabilities of present technology for any system with such a large aperture as needed for pCT.
3.4. Detection rate
The time required for acquisition of a pCT image must be kept reasonably short for the obvious reasons of patient comfort and optimal use of the very-expensive proton treatment facilities. Scan times as short as six minutes have been demonstrated with prototype instrumenation that can measure a million protons per second and write 100 million bytes of data per second, to record between 300 and 400 million proton histories [51]. That is within the bounds of possible clinical use, but one would like to shorten the time by an order of magnitude. To do so while still measuring individual protons will require not only faster data acquisition but also detectors that either can make measurements spaced much more closely in time (which would not necessarily help much at a synchrotron if the protons remain tightly bunched) or else measure multiple protons simultaneously. Continuing with [51] as an example, the rate performance of that instrument's multistage scintillator detector is limited by the pulse shaping needed for successful digitization, and there is no lateral segmentation in the scintillators, ruling out simultaneous measurement of two or more protons. The instrument's silicon-strip detectors, which are used for tracking with fine ( mm) spatial segmentation, can readily detect multiple protons simultaneously, but the use of two independent and orthogonal views results in unresolvable ambiguities when associating strips in one view with those in the other. Furthermore, silicon-strip detectors require pulse shaping (integration) of the strip signal to reduce effects of amplifier thermal noise, which limits the rate at which protons can be detected by a given strip without unacceptable pileup and inefficiency.
The problems posed by increased rate can probably best be solved by detectors able to measure multiple protons simultaneously, especially in applications at a synchrotron with tightly bunched beams. In principle that can be done by introducing lateral segmentation into existing detector technologies. However, in addition to increased readout channel count, segmentation tends to be associated with dead gaps, which can easily result in problematic artifacts in the image, something that significantly affected image reconstruction for the instrument of [52], due not only to segmentation of the calorimeter into 16 CsI crystals, but also to segmentation of the silicon-strip detector into two sensors per plane, as necessitated by the limited size of available silicon-strip sensors. In that case, the sensor edges were overlapped to avoid dead gaps, but that also tends to produce artifacts due to increased detector WEPL in the overlap regions.
As noted above, segmentation of tracking detectors in only one dimension, as done in the commonly used silicon-strip and scintillating fiber technologies, results in pattern-recognition ambiguities. Pixelated detectors would be preferable from that point of view, but tend to be either too slow (e.g. CCDs and CMOS active pixel sensors [53, 54]) or else too complex and expensive—for example, silicon-diode pixel detectors, which in existing systems also require readout electronics that add material within the sensitive field. See, for example, the TimePix chip [55], which is popular for photon detection, but can also detect charged particles. The authors of [56] aim to achieve the ultimate tracking and rate performance for pCT by developing pixelated CMOS detectors with integrated high-rate readout. That may become the preferred technology of the future, but for now pattern recognition in multi-track events can be done successfully with one-dimensional segmentation by adding additional 'stereo' layers to give a third view, of course at the cost of more expense and more material. That approach is common in particle physics, and is being taken by the Pravda pCT system [21] discussed below in section 5.
Solid state detectors, whether used as strips or pixels, will inevitably suffer problems with gaps introduced when tiling the large aperture needed for a practical device. Scintillating fibers have an advantage in avoiding this problem, as long as the gaps between fibers get covered by tiling with a second layer. Gap effects with silicon detectors can be ameliorated by minimizing the dead area along the edges [57] and by staggering the gaps from one layer to the next. In fact, the near 100% efficiency of the active areas of silicon-strip sensors can in some cases allow the gap to be used as a track coordinate when a track missing a hit on that layer projects to the vicinity of the gap [51].
Inefficiency from rate limitations of the tracking detectors can get severely aggravated when a narrow 'pencil' beam is used during imaging. In fact, segmentation and stereo layers both become less effective as the beam width is decreased. The beam scan rate is very slow compared with the particle rate, so the detector system responds as though a static narrow beam were impinging always on the same spot. Silicon detectors with long strips have a distinct disadvantage in this regard, because of the relatively long signal-shaping time needed to achieve low noise, and their efficiency will plummet if the same channel gets hit repeatedly at too high a rate. Again, pixel detectors will be preferred if and when they become more practical, and scintillating fibers with appropriate signal processing can also regain some advantage. For now, silicon based tracking detectors that use strips have to operate at megahertz particle rates, with relatively large beam spots, or else employ relatively short strips and power-hungry electronics with pulse shaping that is as fast as possible.
Another common rate-related problem is that the low intensities required by proton CT and radiography in order to accommodate instrument rate limitations lie far below what existing treatment facilities were designed to deliver. As a result, the accelerator operators typically have no instrumentation built into their system that can detect the presence or indicate the quality of the beam when operating at such low current. In an integrated system in the future, this could be resolved by using the pCT instrumentation to provide direct feedback to the operators. In the meantime, verbal communication between the experimenters and beam operators usually has to suffice.
3.5. Instrument simulation
Detailed Monte Carlo simulation of the detector system has long been an essential component of all particle physics experiments, and that practice has carried over into the field of proton CT and radiography. Standard packages from particle physics are used, such as GEANT4 [48] and FLUKA [58], but code developed specifically to support hadron therapy, such as TOPAS [59], is playing an increasingly important role. Simulations are important for instrument design, understanding detector performance, development of instrument software, and development and verification of data processing algorithms such as CT image reconstruction. It is important to simulate not just the instrument, but also the beam that is delivered by the accelerator facility. A good example of such a simulation model has been recently published in [60].
3.6. Requirement summary
In summary, pCT requires a very low intensity proton beam of about 200 MeV energy for the head and 250 MeV or more for larger parts of the body. The RSP resolution and accuracy of the image should be better than 1%, with spatial resolution of about  mm, the limit allowed by multiple scattering in the phantom.
The RSP requirement can be realized by a relatively simple range counter, which can measure WEPL with about 3 mm accuracy, limited by range straggling, and which can operate with stable calibration. Achieving the optimal spatial resolution requires a tracking system that can measure each proton's trajectory before and after the phantom, but the required tracking resolution is easily met by various modern technologies, since the spatial resolution is limited by scattering in the phantom. High tracking efficiency is more important for ensuring good measurement of each proton.
The most difficult challenge is to reduce the pCT scan time to well below the 5 to 10 mins that has already been achieved. To do so will require development of much faster detectors or else WEPL detectors capable of measuring several protons simultaneously, as well as faster data acquisition systems.
The requirements for proton radiography are easier to satisfy. The beam energy needs only to be high enough for the protons to pass through the phantom in one direction, whereas pCT requires full penetration all around in a 360 degree rotation. And present instruments are already sufficiently fast—being capable of producing a radiograph in less than 10 s. The RSP requirements are the same as for pCT, however, and if the best spatial resolution is desired, then it is still advantageous to track the protons before and after the phantom, in order to make use of the MLP.
4. Image reconstruction for proton CT
Computed tomography image reconstruction from x-ray projection data is a highly developed, mature field [61]. In general, the x-ray data, whether in cone-beam CT, helical CT, or multi-detector CT, are amenable to fast, efficient reconstruction by way of filtered back projections, but more general, more computationally intensive methods such as ART have also been well developed and are recognized to hold some advantages, such as yielding lower-noise images with fewer artifacts, especially at low radiation dose levels, and in regions with sharp changes in density, such as might be found around metallic inserts [62].
The filtered back projection is mathematically related to a close relative of the Fourier transform: the Radon transform, which relates a function f defined on the plane to a function  defined on the two-dimensional space of straight lines in the plane, where the value associated with a particular line is equal to the line integral of the function f along that line. Of course, a CT instrument does not measure the uncountably infinite space of lines in a plane but provides only a finite sampling of that space, together with appreciable noise and limited resolution.
A back projection in itself is a very simple concept: just take all the radiographs of the object, each acquired at a different orientation, and project them all back through the object. If the object were simply a small, dense sphere, for example, then each radiograph would have a sharp peak at the location of the sphere, and each back-projection would draw a line back through the image space. The lines would intersect at the sphere's location, and their sum would greatly darken the region occupied by the sphere. But there would also be dim rays passing outward from the sphere's image in all directions, making a blur that falls off in intensity radially from the sphere's location. A simple back-projection thus yields a very blurry image.
A two-dimensional ramp filter can eliminate most of the blur. To greatly increase the computational efficiency in the filter's implementation, in practice one takes advantage of the Fourier slice theorem, which states that the 1D Fourier transform of the projection of an object is the same as the values of the 2D Fourier transform of the object along a line drawn through the center of the 2D Fourier transform frequency plane. Thus, one can apply a 1D ramp filter (high-pass filter) to the discrete Fourier transform of each projection, arrange the results properly in a 2D Fourier transform plane (which requires some interpolation between the discrete radial projections), and then calculate the inverse discrete Fourier transform to obtain the filtered image—in the end, essentially, a discrete inverse Radon transform of the projection data [63]. Unfortunately, the high-pass ramp filter amplifies high-frequency noise that is always present at some level in experimental data, so in practice it is necessary to combine the ramp filter with a suitable low-pass filter. Further technical details are beyond the scope of this paper, but are thoroughly discussed in textbooks, as well as in the literature. What is most important to note here is that all of the discussion has assumed projections made along straight lines. Therefore, the FBP technique is not easily applicable to the curved MLPs inherent in pCT.
ART is conceptually simple, as it treats the image reconstruction as a solution to a large linear problem. The technique is very general, and is readily applicable to pCT, as well as to x-ray CT. It is convenient to jump immediately to discussion of ART as an application for reconstruction of pCT data from a scanner in which the MLP and WEPL have been measured individually for each proton. Divide the space occupied by the phantom into n voxels, each of a size commensurate with the expected spatial resolution—typically around 1  . Let
. Let  be the solution vector, giving the RSP of the material in each of the voxels, and let
  be the measurement vector, giving the WEPL of each of the m measured proton histories. From the proton MLPs, we can construct a
  matrix
  for which each element is the projection of the ith proton's MLP onto the jth voxel. The linear equation
multiplies, for each MLP, the RSP in each voxel by the length of the proton's path through the voxel, and sums over all of the voxels along the MLP. Clearly, each such sum should give the WEPL for that proton history. The matrix A is enormous, because n will typically be the order of one million, while m, the number of proton histories measured, will be the order of at least a few hundred million. However, it is also sparse, since a given proton passes through only a small subset of the voxels.
The objective of ART is to invert equation (2), a task that can only be accomplished approximately by an iterative procedure. The linear system is not only far too large for a straightforward solution, but it is also grossly overdetermined, since  , and is noisy, due not only to random errors in the WEPL measurements but also to the fact that in pCT the MLP is only an estimate of the true path. Therefore, one cannot search for the solution, or even the best solution, but only for a good solution. Once a good solution is found, a heuristic methodology called 'superiorization' is often used to look for another solution that better satisfies some criterion, such as minimizing 'total variation' [64, 65].
The general method of solution by iterative projections was invented by Kaczmarz in 1937 [66], and the methodology used in ART, often called POCS for 'Projections Onto Convex Sets', was first published by Bregman in 1965 [67] and then in 1970 employed in the field of image reconstruction by Gordon, Bender, and Herman [39]. The basic idea is to successively project the solution vector orthogonally onto the hyperplanes defined by each of the proton MLPs according to a recursion formula for the solution at iteration  in terms of the solution at iteration k:
where  is a relaxation parameter and ai is the ith row of the MLP matrix A. The
  is optimized empirically, typically by use of simulated data. While it can in principle vary with iteration k, for example a sequence converging to zero, most often it is taken for simplicity to be a constant, for example
  for the basic ART algorithm in [68]. A trivial example is a solution for finding the intersection of lines in a plane, as illustrated in figure 5, but the application to pCT differs in that the solution vector is of dimension
  instead of 2, the lines are hyperplanes, the number of hyperplanes, m, is much greater than n, and there is no mathematical solution, only an approximate region in which the hyperplanes come close (hopefully!) to intersecting at a common solution.
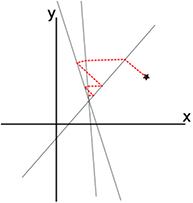
Figure 5. A trivial example of using an iterative sequence of othogonal projections to solve a linear problem. Starting from the star, the successive orthogonal projections onto the three lines converge toward their intersection.
Download figure:
Standard image High-resolution imageApplication of ART to pCT requires knowledge of the shape and extent of the phantom's surface, or its 'hull', as well as a starting guess for the solution. Application of an FBP to the data, assuming straight-line paths for the protons, can provide both. Or a space-carving algorithm can be used to produce the hull, with the starting guess taken to be unity (RSP of water) for all interior voxels [69, 70]. To get an idea of the computational problem, consider that 6 h were required in [68] to reconstruct an image from 130 million proton histories, using a single CPU coupled to one GPU. With more computing power and optimization of code, however, image reconstruction from several hundred million proton histories has been accomplished in a clinically realistic time. Reference [71] presents several interesting examples, using recent data from the LLU/UCSC Phase-II Scanner [51]. The image reconstructions were done by a rack of 60 processors, each with 12 cores, 72 Gbyte RAM, and two GPUs [72]. With this system, an image can be reconstructed from 500 million proton histories in less than a minute [71]. Using different code, Schultze demonstrated that a similar image could be reconstructed in  mins on a single Xeon compute node using one NVIDIA K40 GPU [73]. Table 2 in section 6 shows reconstruction results from [71] for two algorithms, from among many existing variants that differ in how the problem is broken up into parallel computations: DROP (diagonally-relaxed orthogonal projections) [74] and CARP (component averaged row projections) [75]. For the examples given in this reference, CARP achieved better accuracy than DROP, for which the smoothing due to superiorization tended to compress the RSP scale, especially when many 'blocks' were used,
Inherent in the application of ART to pCT is prediction of the MLP, given the incoming and outgoing track vectors. The reconstruction of [71] employs a maximum-likelihood formalism [76] derived from the initial work in [77] and the following work in [76]. A significant fraction of the computing time in the image reconstruction is devoted to calculating all of the necessary MLPs. More recent work in [78] presents an approach based on cubic spline approximations, which could dramatically speed up the pCT reconstruction. Up to now, pCT image reconstructions have assumed MLPs derived for homogeneous media, but that could be generalized in an iterative reconstruction to take into account the heterogeneity of the phantom already known from previous iterations, something that the cubic-spline approach could make practical.
The community has not given up on the possibility of accomplishing the pCT reconstruction task with considerably less computing power than is required by ART. Reference [38] presents a form of filtered back projection along most likely paths. Work is in progress to test that technique with existing data and simulations, to compare the reconstruction quality, as well as speed, with ART.
5. Contemporary instrumentation efforts for proton radiography and CT
Several efforts are in progress around the world to build prototype pCT systems of the type described in figure 2, as listed in table 1. All consist of a combination of a tracking detector and an energy or range detector, but not all use the same detector technologies. Some collaborations have built earlier, simpler prototypes that are not listed in the table, which is meant to reflect just the current state of the art. There are also recent and contemporary efforts to build similar systems that are restricted to proton radiography, as also listed in table 1. Even when computed tomography is not needed, information on particle tracking before and after the phantom can be used to improve greatly the spatial resolution of a radiograph. Therefore, an optimal proton radiography detector system may closely resemble a system designed for pCT, but will have the advantage of producing an image in seconds instead of minutes. None of the efforts has reached the stage at which the instrument could be considered to be ready for clinical or pre-clinical trials.
Table 1. List of some contemporary efforts on prototype pCT systems and particle radiography (pRad) systems with particle tracking. For operational systems the rate is approximately what has been demonstrated to date. Earlier prototypes from the same collaborations are not listed.
| Collaboration | Type | Aperture ( ) ) |
Tracking technology | WEPL detector technology | Rate | Comment |
|---|---|---|---|---|---|---|
| AQUA [90] | pRad |  |
GEM | Scint. range counter | 10 kHz | 1 MHz planned |
| LLU/UCSC phase-II [51] | pCT |  |
Si strip | 5 scint. stages |  MHz MHz |
Operational |
| Niigata [100] | pCT |  |
Si strip | NaI calorimeter | 30 Hz | Larger, faster instr. planned |
| NIU, FNAL [93] | pCT |  |
Sci Fi | Scint. range counter | 2 MHz | Not operational |
| PRaVDA [102] | pCT |  |
Si strip | CMOS APS telescope |  MHz MHz |
Only tracker operating |
| PRIMA [95] | pCT |  |
Si strip | YAG:Ce calorimeter | 10 kHz |  cm2 1 MHz instr. planned cm2 1 MHz instr. planned |
| PSI [84] | pRad |  |
Sci Fi | Scint. range counter | 1 MHz | Program completed |
| QBeRT [88] | pRad |  |
Sci Fi | Sci Fi range counter | 1 MHz | Also a beam monitor |
Integrating approaches, which do not require single-particle tracking, also continue to be studied, but are only briefly mentioned here. Systems based on pencil beams have recently been proposed and studied for pCT [79], as well as for carbon-ion imaging [80]—in which case, multiple scattering in the phantom is not nearly as important. Even emulsion-based detection has seen recent development [81]. An early approach at MGH based on energy modulation has already been mentioned above [36], but the published images were of poor spatial resolution. Recently, another clever approach has been tested at MGH [82], based on time-resolved dose measurements. A range modulator wheel placed upstream of the phantom produces a proton energy that varies with a 100 ms period, thus creating a periodic dose rate in a 2D array of diode detectors placed behind the phantom. The resulting 'dose rate function' depends on the WEPL, and can be calibrated using suitable calibration phantoms. The spatial resolution of the published images were limited more by the course detector segmentation than multiple scattering, making it difficult to judge the power of the technique. Also, the reconstructed RSP values were quite far from the true values in most cases, so additional work is needed to prove this technique.
Some medical physicists believe that simple proton radiographs will be sufficient, when used together with x-ray CT based treatment planning, to solve the range problem. In that case, proton radiography may be used more as a quality assurance tool rather than being employed to develop the RSP map needed in the treatment planning. Or the WEPL map from a single proton radiograph may be compared with a corresponding x-ray image and the differences used to optimize the RSP map derived from x-ray CT [83]. Of course, any system that can accomplish pCT is also well suited for radiography, but radiography does not require such a high data acquisition speed or computing power as needed by pCT to complete an image in a clinically relevant time period.
The radiography instrument developed at PSI in the late 1990s at the Paul Scherrer Institute [84] is the most notable such instrument of that era. It can be viewed as a prototype for the concept being followed by contemporary groups to make pCT scanners that detect protons one by one (sometimes referred to as 'list mode', as opposed to a signal integrating device). Although, apparently, it was never used for CT, the PSI instrument nevertheless follows almost completely the pCT scheme illustrated in figure 2, and was demonstrated to measure a million protons per second—a metric that most contemporary systems have as a goal, but few have yet accomplished. Its main limitation relative to figure 2 is that each tracker is composed of only a single detector layer in each view, such that each provides just a point—not a vector—thus limiting the ability to define the most likely path of a proton through the phantom. This is a significant point even for radiography, because recent research has shown that the MLP formalism that is supported by tracking of individual protons before and after the phantom can significantly improve radiography relative to simpler approaches [85].
Each view of each tracking layer of the PSI instrument is provided by a scintillating fiber hodoscope composed of two overlapping layers of 2 mm square fibers, resulting in an effective detector pitch of 1 mm, and the fibers are read out by 16-channel photomultiplier tubes (PMT), each composed of a  array of independent photocathode and dynode chains. Each PMT views a bundle of two (in x) or seven (in y) fibers, but the bundling is done in such a way that the combination of signals from the two overlapping layers uniquely identifies the x or the y coordinate. This scheme greatly reduces the number of readout channels, and the data volume—facilitating the high speed readout—but it has the disadvantage that both layers must give a signal, in order to yield an unambiguous coordinate location. The inactive material between scintillating fibers results in an overall efficiency of only 33% to get
  coordinates from both tracking layers. Such a low efficiency could be a serious problem for a pCT instrument, but is acceptable for simple radiography.
The range telescope of the PSI instrument is a stack of 64 three-millimeter thick plastic scintillator tiles read out by wavelength shifting fibers connected to PMTs. The proton range is measured according to the last pair of tiles that produced a signal. Figure 6 shows a typical range spectrum from a collection of protons all of the same energy. The location of the peak can be clearly identified, despite there being some protons of shorter range—caused by nuclear collisions in the tracking layers, the phantom, or the range counter. The error on the mean range is dominated by unavoidable range straggling, and is about  , where N is the number of protons in the peak for the given pixel.

Figure 6. A typical range spectrum from the PSI range detector [84], collected from a monoenergetic sample of protons. The counts in front of the peak result from protons that undergo nuclear interactions. Reprinted from [84], Copyright (1999), with permission from Elsevier.
Download figure:
Standard image High-resolution imageThe PSI data acquisition system is based upon 16-channel VME discriminator modules followed by VME-based custom ECL (emitter-coupled-logic) logic modules that both define a trigger and also reduce the data volume down to only 32 bits per event. Then, with a megahertz proton rate a radiograph can be acquired in about 20 s, including about 10 s of dead time. This device holds the distinction of being the only system of this kind to date that has acquired radiographs of live animals—a dog patient being treated for a nasal tumor [86]. Unfortunately, there have been no publications of new results from this instrument since then.
A few other collaborations have followed the PSI lead and developed similar scintillating-fiber trackers. The 'OFFSET' collaboration has built and tested one intended for medical applications with very small  mm fibers, of square cross section [87]. A multianode photomultiplier tube is used for the light detection, but in a scheme reminiscent of that employed by PSI to reduce significantly the number of channels needed. Both ends of the fibers are read out, but with fibers bundled in groups of ten in such a way that a coincidence between the two ends uniquely identifies which fiber was hit. From tests with 62 MeV photons, the group reports an efficiency for a single plane of 62%. Such a low efficiency would be ill suited for such a device as is described in figure 2, in which at least six, preferably eight, independent detector planes must register a hit in order to measure a proton history adequately, but it could be sufficient for other purposes. In fact, the same authors have more recently presented a beam monitoring and radiography system called 'QBeRT' based on similar technology, but read out by multi-pixel photon counters (MPPC, often referred to as silicon photomultipliers, or SiPM). It includes a two-layer tracker and a range detector composed of scintillating fibers [88, 89]. It is intended to handle fluences of 109 particles per second when operated in beam monitoring and verification mode, and 106 particles per second in radiography imaging mode. The existing system is small and of limited range depth, but could be scaled up. Test results have shown good results in measuring beam profiles, and beam range versus energy (see figure 7), and some radiographs of simple high-contrast phantoms have been published.

Figure 7. Experimental and simulated range measurements using the residual range detector of the QBeRT radiography system [88]. The acronym RRD refers to the 'residual range detector'. Reprinted from [88], Copyright (2016), with permission from Elsevier.
Download figure:
Standard image High-resolution imageAnother proton radiography instrument development effort that is more recent than the PSI effort is the advanced quality assurance project (AQUA) at the TERA foundation [90, 91]. The tracking is based on  GEM detectors [92], a pixelated detector that operates with gain from electron multiplication by a gas, which are placed only immediately in front of the range detector. Addition of another set in front of the phantom is being investigated, but the team prefers use of the beam scanning system to define the incoming proton trajectory, in order to enhance the portability of the system within a clinic. The range detector is a stack of 48 three-millimetre-thick (not including wrapping) scintillator planes, each coupled by a wave-shifting fiber to an SiPM. The signals are individually digitized by 12-bit pipelined ADCs, and the data acquisition system can handle a throughput of about a million events per second. Up to this time, results have only been published from the 10 cm square prototype system [91], which had a similar construction but a different electronic readout system. The large 30 cm square system was ready for testing as of March 2015, but no published results have yet appeared.
With the smaller system the proton range was measured event by event in two ways: by using a simple threshold to locate the last scintillator hit and by detailed fitting of the ADC signals to a function shaped similar to the expected Bragg peak. Both methods gave the same range precision, limited by range straggling as well as measurement errors, suggesting that the readout could be simplified by eliminating the ADCs. From analysis of data taken with a 2 cm thick acrylic phantom with cylindrical holes of different depths, the range resolution was about  for N protons passing through a given pixel. Figure 8 shows a radiograph of that phantom. As expected, the spatial resolution was limited by multiple scattering, together with lack of knowledge of the incoming proton trajectory in the broad, disperse beam used in the test.

Figure 8. Radiograph of a 2 cm thick acrylic plate with holes of various size and depth drilled in it, made by the AQUA program of the TERA Foundation [91]. The strip pitch in the GEM tracking detectors is  mm, and units of mm are used for the residual range color scale. Reprinted from [91], Copyright (2011), with permission from Elsevier.
Download figure:
Standard image High-resolution imageScintillating fiber tracking was employed by a collaboration between Northern Illinois University (NIU) and the Fermi National Accelerator Laboratory (FNAL) to build a complete pCT system with the largest aperture of any pCT system completed or planned to date [93]. In this case both front and rear trackers were designed to measure vectors as in figure 2, not just points. They are based on  mm diameter scintillating fibers read out by SiPMs. To achieve sufficient efficiency despite the inactive cladding on each fiber, the round tracking fibers are arranged in close-packed double layers, and are routed to SiPMs in triplets of touching fibers, yielding an effective detector pitch of
  mm. In the tracking layers, the fibers themselves detect the protons, whereas in the range detector, wavelength-shifting fibers collect light from
  mm thick plates of plastic scintillator, and route the light to the SiPMs. An advantage of the scintillating fiber tracking is that large area tracking planes can be built up without any gaps between sensor elements. A potential disadvantage, especially when reading the fibers by room-temperature photodetectors, is that even with a double layer the signal-to-noise is poor, compared with what is easily achieved using silicon-strip or GEM detectors. As discussed in more detail in section 3.2, good signal-to-noise is critical in this kind of system, in which there is little redundancy in the tracking, in order to achieve the necessary near-100% proton detection efficiency while keeping random noise at a low level. Another potential disadvantage is limited spatial resolution, since making the fibers smaller in cross section rapidly reduces the signal-to-noise, but that is greatly mitigated by the fact that in most cases the spatial resolution is limited by multiple scattering in the phantom, not by the intrinsic tracking resolution.
The NIU/FNAL data acquisition is unconventional in that it is data driven, rather than being triggered. The signal from each SiPM is digitized at 75 MHz by pipelined ADCs, and each readout board continuously sends digitized data, including time stamps, through a 1 Gbit  Ethernet link to a rack of six Linux-based workstations that build events based on the time stamps. The publication [93] shows a clean Bragg peak measured by just the range detector in a 200 MeV proton beam, and work has been completed on simulating and calibrating the range detector [94]. However, there have not yet been any results or images presented from operation of the entire scanner, due to problems with malfunctioning SiPMs, difficulties with the data acquisition firmware, and expiration of funding needed for resolution of those problems (personal communication, August 2016).
Several other pCT efforts employ silicon-strip detectors for proton tracking. The raw sensors are expensive relative to scintillating fibers, especially if purchased in small quantities, but they offer significant advantages that can mitigate the cost impact in a complete system. They are solid-state devices that can be integrated into circuit boards using modern electronics assembly techniques—such as automated wire bonding—to produce compact assemblies, and the resulting system can operate with relatively low voltage (compared with GEM detectors). Scintillating fiber trackers, by comparison, require labor intensive work to position and fix the fibers, and to integrate them with photodetectors, resulting in relatively bulky assemblies. The greatest advantage over scintillating fibers, however, is the very high signal-to-noise ratio of 20 or greater that is readily realized for silicon-strip detectors to detect non-relativistic protons, as well as minimum-ionizing particles, which can result in a system with near 100% hit efficiency, and very simple and stable calibration.
Such a system is in development in Italy by the PRIMA collaboration [95], using eight layers of silicon-strip sensors arranged to give two orthogonal views with two measurements in each view, both before and after the phantom. The silicon strips are read out by a 32-channel ASIC (application-specific integrated circuit), that provides a binary readout for each channel. The energy detector is a calorimeter composed of a  array of cerium-activated yttrium aluminum garnet (YAG:Ce) crystals, which is a scintillator with a fast (70 ns) decay time. Each crystal is
  in cross section and 10 cm long, and their scintillation light is detected by silicon photodiodes. Only results from a relatively slow
  prototype with four crystals have been reported, with some simple phantoms reconstructed from data taken in Uppsala Sweden with a 175 MeV beam [96]. For example, see figure 9 for two slices from a CT image of a cylindrical phantom. In that prototype, the photodiode signal was shaped with a 1 μs time constant [97], and the data acquisition operated at a modest rate of 10 000 events per second. The goal for the full-scale system is to operate at a rate of a million events per second, but no published result from it is yet available.
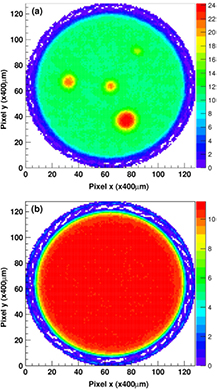
Figure 9. Tomographic reconstructions of a phantom imaged by the PRIMA prototype proton-CT scanner [96]. The top figure is a slice passing through copper and iron inserts, and the bottom figure is a slice passing through a homogeneous cylinder. The data were accumulated using a 175 MeV beam of protons at a rate of 10 kHz. The color palette represents the measured stopping power in units of MeV  . Reprinted from [96], Copyright (2016), with permission from Elsevier.
Download figure:
Standard image High-resolution imageThe 'Phase-II Scanner' by a collaboration of Loma Linda University (LLU) and the University of California at Santa Cruz (UCSC) (with collaborators from Baylor University and NIU contributing to image reconstruction), is the most complete in terms of realizing its original project goals [51], and is a good representation of the state of the art. It builds upon experience with an earlier, smaller, and much slower scanner built by a collaboration of LLU, UCSC, and NIU [52]. The phase-II Scanner has been demonstrated to achieve a sustained acquisition rate of 1.2 million proton histories per second in beam tests at both the LLU synchrotron and the isochronous IBA cyclotron of the Northwester Medicine Chicago Proton Center, and numerous CT scans have been completed in as little as six minutes each at the Chicago Proton Center, by continuously rotating the phantom on a rotation stage during the run (scans at the synchrotron take longer, due to the dead time between proton spills). The high rate was achieved using a triggered, fully-custom hierarchal data acquisition system based on ASICs at the tracking detector front end, 14 FPGAs operating in parallel on the front-end boards, and a Xilinx Vertex-6 FPGA acting as an event builder, which sends event packets over a gigabit-per-second Ethernet link to a computer.
Similarly to the PRIMA instrument, each of the scanner's front and rear tracking detectors use four layers (two in each orthogonal view) of standard single-sided silicon-strip sensors left over from fabrication of the NASA Fermi-LAT orbiting gamma-ray telescope [98], read out by a 64-channel ASIC designed by UCSC specifically for the pCT project [99]. The aperture of the scanner corresponds to the size of four of the sensors placed end-to-end, and is more than large enough to encompass the width of a human head, although two separate scans are required in order to include the full height of a head.
The scanner's '5-stage' energy/range detector is a unique design that measures a combination of energy and range [49], as discussed in section 3.3. The residual energy measurement is taken from only the stage in which the proton stops, allowing good WEPL resolution to be obtained from fast plastic scintillators with only five readout channels. The disadvantage relative to a range detector is complexity of calibration, which is achieved using data in each beam test taken with a special stepped calibration phantom having 41 different known thickness of polystyrene. Preliminary images presented in [51] show significant ring-like artifacts resulting from calibration deficiencies, which have more recently been greatly reduced by further work, as shown below. Nevertheless, the first CT scans published from this device in [51] do demonstrate good reconstruction of the RSP of inserts in a CATPHAN 404 phantom, as well as impressive image slices from a scan of a pediatric head phantom, reproduced here in figure 10.

Figure 10. Slices from pCT (a) and x-ray CT (b) scans of a pediatric head phantom. Reproduced with permission from [51] © Copyright 2017 IEEE.
Download figure:
Standard image High-resolution imageA Japanese group has also presented results from a small-aperture prototype that operates at a low data acquisition rate of 30 Hz, along with plans to build a ten times larger system that can operate at a rate of 100 kHz to 1 MHz [100]. The tracking detector employs the same Fermi-LAT sensors as employed in the LLU/UCSC Phase-II Scanner, although with an aperture corresponding to a single  wafer. The calorimeter consists of a single three-inch thallium-doped cesium-iodide crystal, read out by a photomultiplier tube. To reach higher rates, they are developing a binary readout system for the tracker—similar to that used in the PRIMA and LLU/UCSC instruments—and are studying a range-counter concept with organic scintillators to replace the slow crystal calorimeter.
A group in Korea has also proposed a similar system based on silicon-strip tracking plus a cesium-iodide calorimeter [101], but the work that they have presented thus far is restricted to Monte Carlo simulations of the concept, including full reconstruction of tomographic images from the simulated data. Each simulated tracking layer consisted of a single 10 cm square silicon-strip detector with two orthogonal sets of strips and a relatively course strip pitch of 1 mm. A sensor thickness of  and a spacing between sensors of 10 cm were found by simulation to be optimal. From the publication it is unclear whether the group intends to proceed to build a prototype device. In fact, the specified calorimeter technology would not be capable of reaching the high rates necessary for a practical system.
A British collaboration named PRaVDA (proton radiotherapy verification and dosimetry applications) has ambitious plans for a pCT system based entirely on silicon detectors [102]. The tracking system is more advanced than the LLU/UCSC Phase-II Scanner in several respects [21]:
- The detectors and electronics are designed to withstand high-radiation environments, to support a verification mode in which a therapy-intensity beam is used.
- A double threshold on each channel also supports the treatment mode, as well as allowing tracking of two particles per channel per readout frame.
- Each tracker layer provides three views, with strips oriented
 apart, instead of just two orthogonal views, in order to resolve pattern recognition ambiguities in multi-track events.
 - The tracking readout ASIC and data acquisition have a special mode of operation in which the tracker hits are read out at regular intervals, every 100 μs, and beam profile histograms are accumulated.

A prototype is operational [103], although it has a limited aperture—corresponding to only a single silicon-strip wafer—and is not yet paired with an energy detector or range detector. From data obtained using a 125 MeV proton beam, some radiographs and CT images of a small phantom ( cm diameter) have been published [103], for which scattering power in the phantom was used in place of measurements of energy loss. The reference does not state at what rate the proton histories were acquired, but this is the first time CT images have been produced in this manner (although for radiographs the technique has been demonstrated before [104]). Whereas using scattering power allows rather noisy images to be made in the absence of an energy or range detector, the dependence of multiple-scattering on the phantom material properties is quite different from the dependence of energy loss. Therefore, a measurement of scattering power alone would not be sufficient for use in treatment planning, although it is in itself useful information for understanding the beam penumbra.
The PRaVDA collaboration does plan to implement a range detector stack. Their concept is unique in that, in place of the usual monolithic slabs of plastic scintillator, it is to use a stack of 24 solid-state detector elements with very high spatial segmentation [105], interleaved with absorber. When used together with the PRaVDA tracker, the resulting pCT system could in principle be capable of operating at very high proton rates—at least an order of magnitude faster than the LLU/UCSC Phase-II Scanner—by tracking multiple protons in each readout frame, assuming that the range detector could be read out fast enough.
However, the PRaVDA range telescope is intended to employ CMOS Active-Pixel-Sensor (APS) technology, for which sufficiently fast readout is a major challenge. Reference [54] gives results of testing such sensors, of size  , in 36 MeV and 200 MeV proton beams. They are read out using a rolling shutter, in which rows are read out in sequence to build up a frame. A full-frame readout can be done at a rate of only
  Hz, but region-of-interest readout can run faster, for example at up to
  kHz for a readout of ten rows. The tests on the existing sensors did demonstrate detection of individual protons, but the readout is much too slow for a pCT system. Reference [54] gives a design specification of 1 kHz for full-frame readout for future pCT sensors. In that case, if it were run at ten times the proton rate of the LLU/UCSC Phase-II Scanner, there would be 10 000 proton hits per frame per layer in the range stack, leading to a formidable pattern recognition task in order to correlate those hits with the high-rate information from the silicon-strip tracker. The reference does not explain how that would be accomplished. Note, however, that the more expensive but far faster silicon-strip readout technology could also be used in such a range detector, and would match well with the tracking system.
The iMPACT project [106], with a tracking component called 'ProXY' [56], is the most ambitious of all in terms of planned high-rate performance in pCT. The plan is to develop CMOS monolithic active pixel sensors (MAPS) with an innovative compression readout scheme that could provide efficient tracking at a very high rate over a large area [107]. The pixel geometry would provide simultaneous tracking of multiple particles. Coupled with a fast readout, the authors envisage completing an entire CT scan in a few seconds. While it is arguable whether it is essential, as the authors state in [106], to achieve tracking speeds of a billion protons in one or a few seconds in order to deliver a practical system, it is true that modern x-ray CT systems are able to do complete scans in a fraction of a second. The authors claim that sensors using their technology could be produced as large as  with
with  m pixels, which is as large as a silicon-strip detector from a six-inch wafer, but the near term goal is a
  sensor that could handle up to 250 million proton hits per second per square centimeter, with only four hits per frame.
Of course, a successful pCT system requires more than just particle tracking, so the authors propose a range detector in which each of the 48 to 64 detection planes is segmented into 16 fingers of plastic scintillator, with the fingers rotated by  from one plane to the next, and they propose a rate goal of 200 MHz per finger. The current status is that a small prototype CMOS MAPS sensor of size
  and
and  pixels has been fabricated, although no test results have yet been published for it. Some results of successful testing of an earlier
  pixel prototype with radiation sources have been published [56].
6. Proton CT performance
The best illustrations of the performance of a proton-CT instrument at this time are from the LLU-UCSC Phase-II scanner. Reference [71] presents results from it that are more recent than those found in the instrument paper [51], and with much improved calibration. For example, figure 11 shows a slice from the pCT image of the sensitometry phantom used to obtain the results in table 2. The ring artifacts seen in [51] are no longer evident. The calibration improvements were obtained by means of a new calibration phantom consisting of a smooth wedge, rather than discrete steps. It provides a continuous range of WEPL values, which was found to be particularly important for protons that stop near the boundaries of the five scintillator stages. Perhaps the most important result demonstrated in table 2 is that proton CT can achieve an RSP resolution and accuracy of better than one percent.
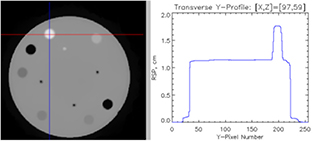
Figure 11. A slice from the pCT of the CATPHAN 404 sensitometry phantom used to obtain the RSP results given in table 2. Reproduced from [110]. CC BY 3.0. The profile on the right was taken along the vertical line plotted over the slice.
Download figure:
Standard image High-resolution imageTable 2. Performance of pCT image reconstruction by ART algorithms for a CATPHAN 404 sensitometry phantom [71]. The data are from the LLU-UCSC Phase-II Scanner [51].
| DROP (10 blocks) | CARP | ||||
|---|---|---|---|---|---|
| Material | RSP | Mean ± std dev | Error | Mean ± std dev | Error |
| Teflon |  |
 |
− % % |
 |
− % % |
| PMP |  |
 |
 % % |
 |
− % % |
| LDPE |  |
 |
 % % |
 |
− % % |
| Polystyrene |  |
 |
 % % |
 |
− % % |
| Delrin |  |
 |
− % % |
 |
− % % |
| Air |  |
 |
 |
The spatial resolution of the LLU/UCSC Phase-II scanner was thoroughly studied by a UCSC graduate student and published in [108]. She evaluated the resolution in terms of the instrument's modulation transfer function (MTF), using data acquired with a custom phantom that she designed specifically for this purpose. It is a plastic cylinder with embedded cubes that simulate enamel, cortical bone, lung and air. Figure 12 shows a slice from a pCT image of the phantom, and figure 13 shows the measured spatial resolution, which depends strongly, of course, on the amount of material through which the proton passed. The results show that the best spatial resolution that one can expect for objects embedded deeply within a phantom is about 2 mm. This is limited by multiple scattering, which cannot be avoided, but it is about double the maximum theoretical MLP uncertainty for protons passing along a 25 cm WEPL [108] (see also figure 3), suggesting that it might be possible for the image reconstruction algorithm itself to improve in terms of approaching the inherent resolution limit. Note that while this measured MTF represents how fuzzy an edge will look in an image, of course the position of the edge could be localized to much greater accuracy, depending on how many protons pass through the region. Also, it is worth mentioning again that the principal purpose of pCT and proton radiography is not to compete with x-ray CT in terms of image sharpness, but rather to improve knowledge of the proton RSP throughout the tissue.

Figure 12. Phantom designed for measurement of pCT spatial resolution. From [108] John Wiley & Sons. © 2016 American Association of Physicists in Medicine.
Download figure:
Standard image High-resolution image
Figure 13. Measured modulation transfer function (spatial resolution) for the LLU/UCSC Phase-II scanner versus water equivalent path length (WEPL) of the protons through the phantom material. The results were derived from a pCT image (see figure 12) reconstructed from experimental data using  mm pixels and
  mm slices. The two separate graphs represent measurements from edges of cubes embedded in the plastic cylinder that are respectively parallel to a chord ('radial') or parallel to a radius ('azimuthal'). 'MTF10%' represents the line spacing for which the instrument would show a 10% modulation of the signal, thus representing the minimum spacing that would be readily visible in an image. From [108] John Wiley & Sons. © 2016 American Association of Physicists in Medicine.
Download figure:
Standard image High-resolution imageAnother point of interest for pCT, however, is its very low susceptibility to production of artifacts (assuming, of course, that the calibration is correct). Figure 14 shows an interesting comparison of pCT and x-ray CT images of a pediatric head phantom in a slice that passes through a gold tooth [71]. The x-ray image shows extremely large artifacts radiating from the gold tooth location, whereas nothing of the sort is visible in the pCT image. Proton CT and radiography do not suffer from beam hardening, a phenomenon inherent in x-ray CT in which a high density, high-atomic-number object absorbs preferentially the lower energy photons in a necessarily multichromatic beam, leaving a 'harder' beam to pass through the remaining material [109]. Such effects are difficult to account for, and correct, in the image reconstruction.
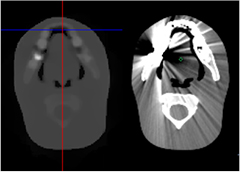
Figure 14. A comparison of pCT (left) and x-ray (right) CT images of a pediatric head phantom in which a gold tooth is visible in the slice displayed. The x-ray image, but not the pCT image, shows severe artifacts due to beam hardening caused by the gold. Reproduced from [71]. CC BY 3.0.
Download figure:
Standard image High-resolution image
As discussed in section 2, low radiological dose was emphasized in the early treatments of pCT, motivated by the very high detection efficiency possible with protons. Proving the point is not trivial, because there are many ways to lose efficiency in a detector system. Protons can be lost because they arrive too closely in time, because an essential detector element is inefficient, because the data acquisition buffers are full, or because they pass through a crack or dead channel in the detector system. They might also be rejected because they scattered too much, did not leave a reasonable signal in the range or energy detector (possibly due to nuclear interactions), or scattered out of the acceptance. During the image reconstruction, additional proton histories will be rejected, because the measured WEPL lies in the tails of the distribution from protons passing along nearly the same path. Overall, even with the best system, less than half of the protons that contribute to the dose will end up being used to reconstruct the image. Additional dose might also be incurred from neutrons produced in nuclear interactions in the patient, as well as in the detector system.
With respect to dose performance in pCT, the LLU/UCSC Phase-II system and the PRIMA system are good examples of the state of the art. For the Phase-II scanner, the dose was measured during a 6 min pCT scan by placing an ionization chamber at the center of a 16 cm diameter acrylic cylinder (Catphan CTP554 dose phantom). The tracking system measured a flux of about 1.2 million protons per  passing through the phantom center, more than sufficient to produce a good CT image, while a dose of
  mGy was measured by the ionization chamber [110]. The PRIMA collaboration published a dose measurement for their pCT scan of a metallic phantom with inserts of various densities (figure 9). They inferred the dose from the observed tracks, using Monte Carlo simulations to correct for unobserved effects, and found that with a
  mGy dose they achieved better than 1% density resolution. Such a dose is small compared with the 30–50 mGy dose typically delivered by an x-ray CT scan of the head [111]. Note that a single radiograph can be expected to deliver a dose of only around
  mGy. The corresponding effective dose will most likely be in the μSv range, but a careful radiobiological evaluation will be needed to confirm that.
7. Proton radiography and computed tomography outlook
Thus far, proton and ion radiography has seen very little use in the clinic, even for range verification and quality control, two decades after the paper by Schneider and Pedroni [17]. Nevertheless, based on the number of instrumentation efforts that are underway this decade, interest appears to be growing along with the rapid worldwide growth in the number of proton and ion therapy centers. Particle integrating systems could see the first widespread clinical use due to their advantages in terms of expense and simplicity, especially for carbon ions, but they will never provide the good spatial resolution that can be afforded by particle tracking, and they also are unlikely to be able to operate with as low a dose as a particle tracking based system. Furthermore, a tracking based system can be made compact and simple. Systems like the LLU/UCSC Phase-II scanner have demonstrated very high tracking reliability, and high data acquisition throughput, via compact, inexpensive FPGAs that stream data over a single Ethernet cable to a standard PC, and they can acquire a quality radiograph in a few seconds with a dose the order of  mGy. The particular Phase-II scanner five-stage energy/range detector requires daily, relatively complex calibration, but such a tracking system paired with a true range detector could operate day after day with essentially no recalibration, since all of the signal processing would be based on simple thresholds. Existing technology is thus ready for the task.
For proton radiography to move toward widespread clinical use, however, will require industrial involvement to manufacture and market a standardized device ready for use. That will probably best be done by or in collaboration with one of the existing proton-therapy facility vendors, because to be useful the system will have to be well integrated into the control system of the facility. For example, for the very low beam currents envisaged, the accelerator operators will likely need feedback from the radiography scanner in order even to know whether the beam is being delivered. The stage is now set for this to happen, as not only does appropriate technology exist, but research has also already demonstrated, long ago, convincing advantages to having such an instrument available for range verification and image guidance [17, 112]. Already, at least one private firm—ProtonVDA Inc.—is engaged in designing a proton radiography/CT system, with a goal of measuring 107 protons per second [113]. Their concept appears to be somewhat different from figure 2, but not enough information is yet public to ascertain in detail how it functions, or how effective it will be.
The outlook for pCT is less certain. Research still needs to be completed demonstrating significant gains in treatment planning quality relative to, for example, dual-energy x-ray CT. Even given some advantage, however, one has to consider the considerable added expense of bringing the patient into the proton beam line prior to treatment planning as well as for the treatment itself. An additional problem is the limited beam energy (e.g. 230 MeV) available in most proton therapy centers, which would preclude doing pCT in some parts of the body, especially for larger patients. A dedicated very-low-intensity, poor-emittance (i.e. potentially inexpensive) proton accelerator dedicated to diagnostic and planning work would be a game changer, as was recognized as far back as 1975 [25], but nothing of the sort is on the horizon. Also, the best existing pCT system still requires the order of six minutes to complete a scan, and a similar time, employing considerable computing resources, to generate an image. More development can almost certainly shrink those times, but may also increase the expense. Nevertheless, it is interesting to note that an optimal system for radiography would look and perform very similarly to one of the existing tracking-based scanners designed for pCT. Hence in the near future such a device located in a treatment room could serve the needs of pCT in special cases for which the extra expense and time are warranted, while more frequently serving the needs of proton radiography for range verification and image guidance.
The ultimate pCT system would be mounted on a gantry, making use of the gantry to rotate 180 degrees or more about the patient during the scan, but to get there would be a huge, unlikely step at this point, requiring major redesign efforts of proton therapy facilities. A much more practical starting point would be to rotate the patient while he or she is sitting in a chair custom designed for that purpose. It is not difficult to envisage for the near future, then, a fast tracking-based proton radiography system in a fixed-beam treatment room, that could also be used on occasion with a rotating chair for pCT—particularly for the head, for which limited beam energy is normally not a problem.
Footnotes
- 1
The full width at half maximum of a 'pencil beam' in air can be as low as about 7 mm at the highest beam energies, with a corresponding width of about 18 mm at the Bragg peak that is nearly independent of the beam energy [5]. However, sometimes beams as wide as 20 to 35 mm in air are called 'pencil beams' [6].
- 2
Sometimes RSP is referred to as 'relative linear stopping power', or RLSP.
- 3
X-ray images are commonly known for giving very high contrast to bones and teeth, due to the very strong atomic-number dependence of x-ray absorption, but in many cases good contrast between soft tissues is more important.
- 4
LANL was not primarily interested in medical applications—proton radiography was employed as a tool for studying the behavior of materials in implosions driven by high explosives [33].
- 5
Since it has not yet been possible to deploy any pCT system in a clinic, and all existing systems are experimental prototypes, for simplicity we use throughout this paper the word 'phantom' to refer to the object being imaged.
- 6
Biographies

Robert Johnson is a professor of physics and the Physics Department chair at the University of California at Santa Cruz. He is a member of the Santa Cruz Institute for Particle Physics and a fellow of the American Physical Society, and his research has been primarily in the area of colliding-beam experimental particle physics and high-energy astrophysics. He was responsible for managing the design, fabrication, and testing of the silicon-strip tracking system of the NASA Fermi-LAT orbiting gamma-ray observatory, and since then he has employed some of the resulting technology in both a high-altitude balloon experiment and a proton-CT scanner. Johnson is married to Ana Dolly Johnson and has six children.