

Abstract
A commercial Monte Carlo (MC) algorithm (RayStation version 6.0.024) for the treatment of brain tumors with pencil beam scanning (PBS) proton therapy is validated and compared via measurements and analytical calculations in clinically realistic scenarios. For the measurements a 2D ion chamber array detector (MatriXX PT) was placed underneath the following targets: (1) an anthropomorphic head phantom (with two different thicknesses) and (2) a biological sample (i.e. half a lamb's head). In addition, we compared the MC dose engine versus the RayStation pencil beam (PB) algorithm clinically implemented so far, in critical conditions such as superficial targets (i.e. in need of a range shifter (RS)), different air gaps, and gantry angles to simulate both orthogonal and tangential beam arrangements. For every plan the PB and MC dose calculations were compared to measurements using a gamma analysis metrics (3%, 3 mm). For the head phantom the gamma passing rate (GPR) was always >96% and on average >99% for the MC algorithm; the PB algorithm had a GPR of ⩽90% for all the delivery configurations with a single slab (apart 95% GPR from the gantry of 0° and small air gap) and in the case of two slabs of the head phantom the GPR was >95% only in the case of small air gaps for all three (0°, 45°, and 70°) simulated beam gantry angles. Overall the PB algorithm tends to overestimate the dose to the target (up to 25%) and underestimate the dose to the organ at risk (up to 30%). We found similar results (but a bit worse for the PB algorithm) for the two targets of the lamb's head where only two beam gantry angles were simulated. Our results suggest that in PBS proton therapy a range shifter (RS) needs to be used with caution when planning a treatment with an analytical algorithm due to potentially great discrepancies between the planned dose and the dose delivered to the patient, including in the case of brain tumors where this issue could be underestimated. Our results also suggest that a MC evaluation of the dose has to be performed every time the RS is used and, mostly, when it is used with large air gaps and beam directions tangential to the patient surface.
Export citation and abstract BibTeX RIS
1. Introduction
Currently, the most common method to calculate and optimize dose distribution treatment planning for proton therapy is based on analytical algorithms (Pedroni et al 2005, Soukup et al 2005). However, Monte Carlo (MC) methods are considered the gold standard to describe particle interactions and to calculate the resulting doses (Paganetti 2014).
MC algorithms to compute proton dose distribution have been tested and compared to analytical pencil beam (PB) algorithms (Soukup et al 2005, Schuemann et al 2014, Fracchiolla et al 2015, Geng et al 2017, Saini et al 2017, Taylor et al 2017).
The superiority of MC algorithms appears to be particularly evident whenever beam modifiers are used (such as a pre-absorber, also known as a range shifter (RS), or an aperture) and/or when the beam has to traverse highly heterogeneous regions.
Dose calculation with a pre-absorber by a research MC algorithm leads to a better agreement with measured data than by an analytical PB algorithm of a commercial treatment planning system (TPS) (Fracchiolla et al 2015). In a very recent study, Saini et al (2017) showed that the management of the pre-absorber by an analytical algorithm may lead to clinically unacceptable results, especially when the pre-absorber is employed for oblique beam directions, in combination with large air gaps between the absorber and the patient surface, and/or passing through heterogeneous media like lung/bone interfaces.
In the present study we focused on the validation of a commercial MC algorithm, comparing it via measurements and analytical calculations in clinically realistic scenarios. We therefore: (a) carried-out tests both in an anthropomorphic head phantom and in a biological sample, (b) used a fast and reliable methodology based on a 2D array chamber to perform validation measurements, (c) investigated the role of air gap and of minimizing the use of a pre-absorber to improve the agreement between measurement and TPS predictions, and finally (d) suggested practical solutions for the optimal management of a pre-absorber in pencil beam scanning (PBS) proton therapy.
2. Materials and methods
The MC dose engine (version 4.0) available in our clinical TPS RayStation (version 6.0.0.24) is a condensed history MC (class II) for primary and secondary protons. Heavier secondaries are transported only accounting for continuous slowing down approximation. Each spot is simulated by using a phase space plane upstream of the patient transport grid. The beam characteristics (spot shape, spot size, energy spectrum, spatial angular distribution moments etc) are derived from the beam model previously commissioned for the PB algorithm. Every material is characterized by its mass density, elemental composition, and mean ionization energy. For each voxel of the patient's CT that information was interpolated from the calibration curve. The dose is scored as dose-to-water taking into account the water-to-local medium mass stopping power ratio evaluated at run-time (RayStation 2016).
To validate this algorithm several dosimetric scenarios were considered: (1) water phantom, (2) anthropomorphic phantom, and (3) biological sample. In addition, we compared the MC dose engine versus the RayStation PB algorithm clinically implemented so far, in critical conditions such as superficial targets (i.e. in need of an RS) and different air gaps.
Methods and results related to water phantom measurements are reported in the supplementary materials available online at (stacks.iop.org/PMB/63/145016/mmedia); hereafter we focus on assessments of heterogeneous material.
2.1. Anthropomorphic phantom
After the preliminary validation of the simpler dose distributions in water, an anthropomorphic phantom was taken into account. The phantom has the same characteristics as described by Albertini et al (2011). Briefly, it consists of five different tissue substitute materials simulating different tissue types and it is cut into sagittal planes. To simulate shallow targets, the most superficial slabs of the phantom (i.e. 1/6 and 2/6 of the head, because the head is divided in six parts) were considered and a 2D ionization chamber array detector was placed underneath the phantom (figure 1 and 2). The detector consists of a 1020 vented ion chamber array arranged in a 32 × 32 grid with the exception of the four corner position (MatriXX PT, IBA Dosimetry GmbH). The distance between the individual chambers is 7.62 mm center-to-center, and the diameter of each ion chamber is 4 mm.
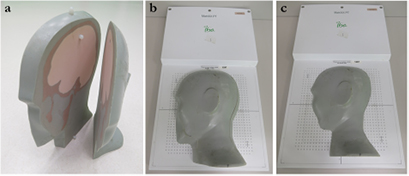
Figure 1. Two outer slabs of the head phantom (a). Two experimental configurations were considered: the two slabs were placed together (i.e. 2/6 of the head) on the 2D ion chamber (b) or just the most superficial one (i.e. 1/6 of the head) was considered (c).
Download figure:
Standard image High-resolution image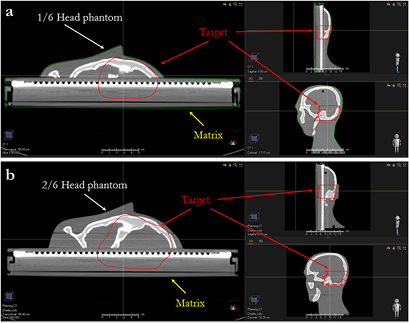
Figure 2. Three projections of the target of the single slice (a) and two slices (b) of the anthropomorphic phantom lying on the MatriXX.
Download figure:
Standard image High-resolution image2.2. Biological sample
Half of the head of a lamb (figure 3) was used to validate the MC code in a biological sample. The head was placed on the same MatriXX PT detector as described above. The head was stored in a freezer, but before the measurements it was brought back to room temperature to prevent the low temperature from influencing the measurements.
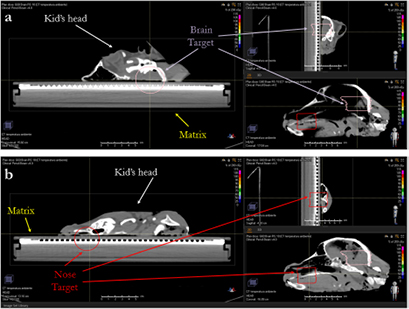
Figure 3. Three projections of the brain (a) and the nose target (b) of the lamb's head lying on the MatriXX.
Download figure:
Standard image High-resolution image2.3. Planning procedure
2.3.1. Anthropomorphic phantom
We assessed the dose calculation accuracy in configurations that should underline the limitations of the PB algorithm, i.e. superficial tumor that required the use of the RS), with different air gaps and gantry angles. We planned to deliver 200 cGyE to a superficial target located in 1/6 (figure 2(a)) or 2/6 of the head (figure 2(b)). The lowest energy of our cyclotron is 70 MeV, so for tumors less than 4 cm deep in water equivalent thickness (WET), an RS is needed, which is a Lexan slab of 3.65 cm (4.1 g cm−2 WET). A CT of the phantom was acquired with a slice thickness of 1 mm and the plans were optimized with a dose grid of 1 mm using the PB algorithm in order to achieve target coverage. The plans were then copied and recalculated with the MC dose engine, with a dose grid of 1 mm and a statistical uncertainty of 0.5%.
We simulated several single beam plans changing gantry angles (0°, 45°, and 70°) and for each gantry angle, three RS positions/air gaps were planned (42, 30, and 20 cm distance of the RS from the isocenter). Our proton gantries have the RS mounted on a motorized drawer at the end of the 'snout'. The RS can be remotely inserted and moved closer to the patient in order to reduce the air gap.
A dedicated CT calibration curve was created for the head phantom, based on the same tissue surrogate included in the phantom. The phantom was provided with six dedicated rods (mass density and average HU are reported in brackets): sinus and cavities (0.21 g cm−3, HU = −799), soft tissue (1.05 g cm−3, HU = 29), spinal cord (1.07 g cm−3, HU = 44), brain (1.07 g cm−3, HU = 54), trabecular bone (1.16 g cm−3, HU = 282), and cortical bone (1.91 g cm−3, HU = 1443). To convert the mass density into a relative stopping power, a list of about 50 fixed materials was created in the TPS by interpolation from a number of well-established core materials. The material closest in mass density is associated with a CT voxel and its atomic composition as well as the mass density associated with the voxel is used to compute the relative stopping power (Farace et al 2016). They were used to create the calibration curve: the use of the same materials eliminates the possibility of assigning an incorrect density (and/or stopping power and/or chemical composition) to each voxel of the image of the head phantom.
2.3.2. Biological sample
On the CT scan of the biological sample two targets (called 'nose' and 'brain', see figure 5) were contoured to evaluate the impact of tumor size and depth on the dose engine accuracy. Both targets need an RS and were independently optimized with a PB algorithm using a dose grid of 1 mm and a CT slice thickness of 1 mm. Then the plans were recalculated with the MC dose engine, with a dose grid of 1 mm and a statistical uncertainty of 0.5%.
For both targets we simulated several single beam plans with two different gantry angles (i.e. 0 and 60°) and, for each gantry angle, three RS position/air gaps were planned (42, 30, and 18 cm distance of the RS from the isocenter). Moreover, we added a plan simulation with an RS 18 cm from the target isocenter, which we call a 'beam split' (Farace et al 2017). The technique consisted of splitting each beam into two components, i.e. if a beam required a pre-absorber, two sub-beams were created. The first sub-beam has an RS and includes only the energy layers needed to irradiate the target at depths lower than the WET of the pre-absorber. The second sub-beam has all the remaining layers, which do not require the RS. That workflow is clinically feasible with our robotic RS.
For the plans for the biological sample, we applied a CT calibration curve clinically implemented for our patients: we created the curve acquiring the CT images of rods of tissue substitutes in a CIRS 2015 Model 062M (nine rods were used: inhale lung, exhale lung, adipose tissue, breast, muscle, liver, water, trabecular bone, and cortical bone) for which we knew the mass density and the relative stopping power.
2.4. Dosimetric and analysis procedure
To avoid dose variations as much as possible due to inaccurate setup of the heterogeneous phantoms, two orthogonal 2D kV images of the phantoms were acquired and compared with digitally reconstructed radiography and the position was corrected until the residual error was <0.2 mm in all directions. Before the measurements, we warmed up the 2D ion chamber array for at least 1 h and, in addition, two reference dose distributions were delivered to check the stability of the MatriXX PT.
For every plan, the PB and MC dose calculations were compared using the gamma analysis metrics with a passing criteria of 3% of the maximum dose, 3 mm distal-to-agreement, global approach, and a dose threshold of 5%.
3. Results
3.1. Anthropomorphic phantom
In figure 4, on the top we have the PB dose distribution optimized with our TPS that showed a good uniformity and conformity to the target of the 1/6 head phantom for a proton field angle of 70° and snout position 42 cm from the isocenter. The MC recalculation of the experimental setup (oblique field and superficial target on the anthropomorphic phantom) showed significant differences with respect to the PB calculation, with under-dosage up to 25% in the target and over-dosage up to 30% outside the target.
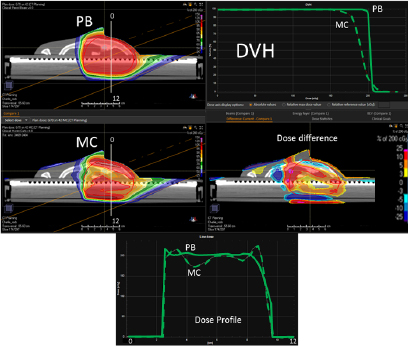
Figure 4. PB optimized dose distribution on the 1/6 head phantom (top left) and the MC recalculation (middle left) with a proton field angle of 70° and the RS 42 cm from the isocenter (i.e. air gap ~24 cm). The white lines represent the dose profiles' (bottom) extraction plans. On the right side of the figure, the DVHs of both the dose distributions (top right) and dose difference (middle right) are displayed.
Download figure:
Standard image High-resolution imageThe MatriXX measurement of the configuration represented in figure 4, confirmed what was expected from the MC recalculation: the PB dose profile was higher compared to the measurements and the γ passing rate of the dose distribution estimated on the MatriXX was 57.6%. The MC recalculation is much closer to the experimental data and had a gamma passing rate of 97.8% (see figure 5 and table 1).
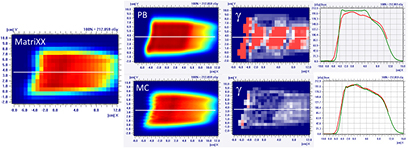
Figure 5. Dose distribution and γ analysis comparison between the MatriXX measurement and the PB or MC dose engine in a transversal plane for the 1/6 head phantom with a gantry angle of 70° and snout position of 42 cm. The white lines represent the dose profiles' extraction plans, the red lines are the measured data profile while the green lines represent the calculated dose distribution. The red region in the γ graph represents the area with γ > 1.
Download figure:
Standard image High-resolution imageTable 1. PB versus MC γ analysis (3%, 3 mm) comparison on transversal planes for nine fields with the target in the brain region for the 1/6 head phantom.
| Gamma analysis results—passing rate (%) | |||
|---|---|---|---|
| Gantry angle | Snout position (cm) | PB versus measurement | MC versus measurement |
| 70° | 42 | 57.6 | 97.8 |
| 30 | 75.3 | 97.6 | |
| 20 | 90.0 | 96.5 | |
| 45° | 42 | 70.0 | 99.7 |
| 30 | 78.7 | 99.2 | |
| 20 | 89.0 | 98.6 | |
| 0° | 42 | 82.9 | 98.6 |
| 30 | 88.6 | 100 | |
| 20 | 95.0 | 100 | |
It is clear that the dose differences inside and outside the target can be higher than those reported in figure 5: because of the experimental setup, the dose distribution estimated with the MatriXX is not 'likely' in the area where the most significant dose differences are (see figure 4).
Table 1 reports the PB and MC gamma passing rates for all the configurations of the gantry angle and snout position simulated on the most superficial slab of the head phantom (i.e. 1/6). It is interesting to note that also in the case of small air gaps (i.e. RS 20 cm from the isocenter) the γ passing rate of the PB algorithm could be <95%.
Figure 6 reports the PB dose distribution of a plan optimized on the two slabs of the head phantom and its MC recalculation.
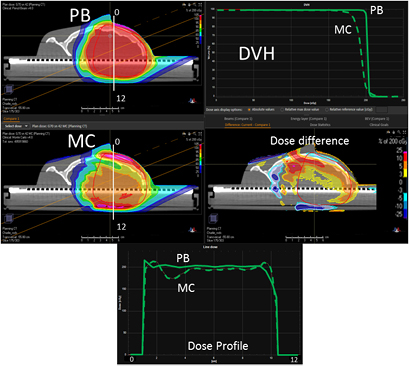
Figure 6. PB optimized dose distribution on the 2/6 head phantom (top left) and MC recalculation (middle left) with a proton field angle of 70° and the RS 42 cm from the isocenter (i.e. air gap ~26 cm). The white lines represent the dose profiles' (bottom) extraction plans. On the right side of the figure, the DVHs of both the dose distributions (top right) and dose difference (middle right) are displayed.
Download figure:
Standard image High-resolution imageThe dose differences between the PB and MC are less pronounced for this configuration compared to the previous one (figure 7 and table 2). Again, it is worth noting that the MatriXX plane of measurement was not placed in the region where the largest disagreement occurs (figure 6).
Table 2. PB versus MC γ analysis (3%, 3 mm) comparison on transversal planes for nine fields with the target in the brain region for the 2/6 head phantom.
| Gamma analysis results—passing rate (%) | |||
|---|---|---|---|
| Gantry angle | Snout position (cm) | PB versus measurement | MC versus measurement |
| 70° | 42 | 72.5 | 99.0 |
| 30 | 89.6 | 100 | |
| 20 | 96.9 | 100 | |
| 45° | 42 | 83.0 | 100 |
| 30 | 91.0 | 98.9 | |
| 20 | 98.3 | 99.6 | |
| 0° | 42 | 87.0 | 100 |
| 30 | 94.9 | 100 | |
| 20 | 96.7 | 100 | |
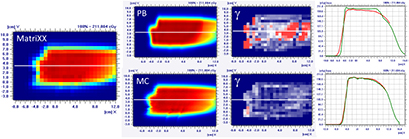
Figure 7. Dose distribution and γ analysis comparison between the MatriXX measurement and the PB or MC dose engine in a transversal plane for the 2/6 head phantom with a gantry angle of 70° and a snout position at 42 cm. The white lines represent the dose profiles' extraction plans, the red lines are the measured data profile while the green lines represent the calculated dose distribution. The red region in the γ graph represents the area with γ > 1.
Download figure:
Standard image High-resolution image3.2. Biological sample
Figure 8 presents the plan optimized and calculated with the PB algorithm for the brain target of the lamb's head with a gantry angle of 0° and the RS 30 cm from the isocenter. MC recalculation shows significant differences in the dose volume histogram (DVH) and mostly located in the distal part of the target.
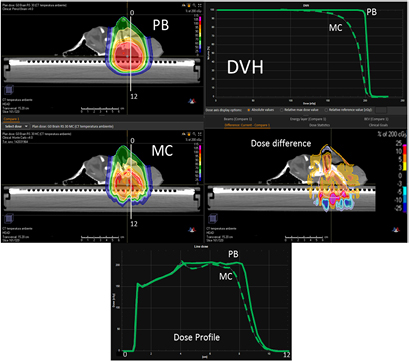
Figure 8. PB optimized dose distribution on the brain target of the lamb head (top left) and MC recalculation (middle left) with a proton field angle of 0° and the RS 30 cm from the isocenter (i.e. air gap ~20 cm). The white lines represent the dose profiles' (bottom) extraction plans. On the right side of the figure, the DVHs of both dose distributions (top right) and dose difference (middle right) are displayed.
Download figure:
Standard image High-resolution imageFrom the MatriXX measurements, it is clear that the PB algorithm over-estimates the target coverage (figure 9) and also in the case of small air gaps (i.e. RS 18 cm from the isocenter) the PB γ passing rate is <90%; the splitting technique improves the agreement between the measurements and the calculation performed with the PB dose engine (table 3).
Table 3. PB versus MC γ analysis (3%, 3 mm) comparison on transversal planes for eight fields with the target in the brain region of the lamb's head.
| Gamma analysis results—passing rate (%) | |||
|---|---|---|---|
| Gantry angle | Snout position (cm) | PB versus measurement | MC versus measurement |
| 60° | 42 | 70.1 | 95.6 |
| 30 | 81.6 | 97.0 | |
| 18 | 87.6 | 97.0 | |
| Split | 90.6 | 99.3 | |
| 0° | 42 | 85.0 | 100 |
| 30 | 86.8 | 100 | |
| 18 | 89.5 | 100 | |
| Split | 95.4 | 100 | |
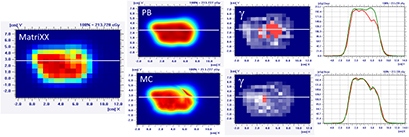
Figure 9. Dose distribution and γ analysis comparison between the MatriXX measurement and the PB or MC dose engine in a transversal plane for a lamb's head, brain target, with a gantry angle of 0° and the snout position at 30 cm. The white lines represent the dose profiles' extraction plans, the red lines are the measured data profile while the green lines represent the calculated dose distribution. The red region in the γ graph represents the area with γ > 1.
Download figure:
Standard image High-resolution imageIn the case of the more superficial target on the 'nose target' of the lamb's head, the dose differences between the PB and MC algorithm increase (figures 10 and 11 and table 4). For the gantry angle of 60°, the γ passing rate is also well below 95% in the case of small air gap (snout position at 24 cm, i.e. air gap of 1.5 cm) and the application of the splitting technique. For such a tangential entrance, the MC algorithm provides superior performances, matching significantly better with the measured data.
Table 4. PB versus MC γ analysis (3%,3 mm) comparison on transversal planes for eight fields with target in the nose region of the lamb's head.
| Gamma analysis results—passing rate (%) | |||
|---|---|---|---|
| Gantry angle | Snout position (cm) | PB versus measurement | MC versus measurement |
| 60° | 42 | 53.4 | 99.4 |
| 30 | 66.0 | 98.6 | |
| 24 | 64.7 | 97.0 | |
| Split | 75.4 | 95.0 | |
| 0° | 42 | 88.1 | 97.3 |
| 30 | 91.5 | 93.9 | |
| 18 | 95.3 | 95.3 | |
| Split | 97.6 | 96.3 | |
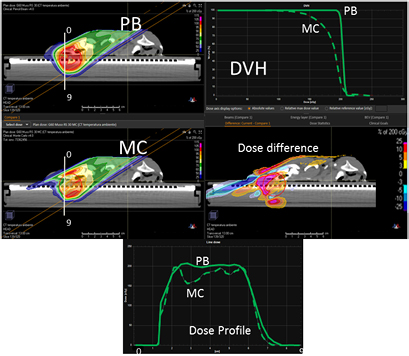
Figure 10. PB optimized dose distribution on the nose target of the lamb's head (top left) and MC recalculation (middle left) with a proton field angle of 60° and the RS 30 cm from the isocenter (i.e. air gap ~7.5 cm). The white lines represent the dose profiles' (bottom) extraction plans. On the right side of the figure, the DVHs of both the dose distributions (top right) and dose difference (middle right) are displayed.
Download figure:
Standard image High-resolution image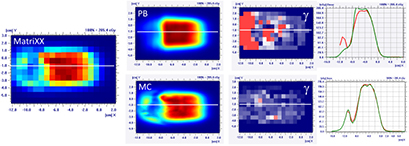
Figure 11. Dose distribution and γ analysis comparison between the MatriXX measurement and the PB or MC dose engine in a transversal plane for the lamb's head's nose target, with a gantry angle of 60° and the snout position at 30 cm. The white lines represent the dose profiles' extraction plans, the red lines are the measured data profile while the green lines represent the calculated dose distribution. The red region in the γ graph represents the area with γ > 1.
Download figure:
Standard image High-resolution image
4. Discussion
Recent results (Saini et al 2017) have shown that the use of an analytical algorithm for calculating the dose in proton therapy can produce relevant discrepancies when compared to measurements, leading in some cases to clinically unacceptable situations. In particular when they are employed in critical conditions, such as oblique beams entrance direction, large air gaps, and/or when heterogeneous media such as lung and bones must be crossed. Often, this is due to the fact that, despite its widespread use in proton therapy to deliver the dose at a shallow depth, the accurate management of a pre-absorber in PBS proton therapy is a critical issue. Pencil beam analytical algorithms model patients as a stack of semi-infinite layers i.e. assuming materials encountered by the central axis of each PB to the beam to be laterally homogenous slabs along the depth (Soukup et al 2005). This approximation is a major limitation in the complex geometries described above.
On the other hand, the use of MC algorithms can improve the accuracy of TPS modeling (Fracchiolla et al 2015), particularly in the above critical conditions (Saini et al 2017) because they track individual particles where for each interaction, energy loss and scattering effects are calculated through the random sampling of cross section data (Paganetti 2014).
In the present study, we report the measurements performed to validate a commercial MC dose calculation algorithm embedded in our TPS before its clinical application to treat skull base and brain tumors at our center and its comparison with the corresponding analytical TPS algorithm for modeling a pre-absorber. Concerning the PB algorithm, our results are specific to the RayStation TPS (version 6.0.0.24) and any generalization should be taken with caution. In a very recent version of the same algorithm (RayStation 6 Service Pack 1) the management of the sub-spot decomposition in the PB algorithm has been updated when the RS is used. Instead of performing the spot decomposition in sub-spots at the RS entrance, it is now done at the patient surface. That should improve the PB performance when the RS is inserted. Other TPSs could implement more sophisticated methods (i.e. a higher spot decomposition) to improve the PB results.
It is acknowledged that MC algorithms are required for accurate treatment planning in highly heterogeneous tissues, such as the lung region, where analytical algorithm are unsuitable (Taylor et al 2017). Our study supports a wider application of the MC algorithm in other treatment sites when using a pre-absorber. In fact, both the anthropomorphic and the biological sample we used mimicked the head region. Our results confirmed that the use of oblique fields with respect to the entrance surface produced large discrepancies between measurements and TPS prediction when using the analytical algorithm, whereas a good agreement (γ-index >95%) was observed using the MC algorithm. Since in head and head-and-neck treatment oblique fields are commonly used, our results suggest caution in the application of analytical algorithms for planning, especially if an RS is needed. In these treatment sites, the air gap and the angle between the patient surface and beam entrance in combination with the use of a pre-absorber can have a greater impact on the computational accuracy than tissue heterogeneities inside the same patients. The PB algorithm is designed to split a PB into several smaller sub-PBs which are then traced one by one across the material, the RS and air gap included. In such a way, once they reach the patient surface, these small PBs will be larger and will start overlapping each other. The problem occurs when the angle of incidence of the PBs to the patient surface is not perpendicular. Indeed the patient is seen by the small beams as a pile of semi-infinite layers, perpendicular to the beam central axis, so an inclined surface is not properly managed by the system. Protons belonging to the different sub-PBs go through materials of different density/thickness, but the algorithm assumes a constant thickness of crossed materials corresponding to the one seen on the central axis of the PB: this tends to increase along with the dimension of the sub-PBs, with the amount of air gap. For the nose target of the lamb's head and the gantry angle of 60°, the γ passing rate is well below 95% also in the case of small air gap (snout position at 24 cm, i.e. air gap of 1.5 cm) and splitting technique: for such tangential beams, MC is suggested.
This marked 'oblique-incidence effect', originally reported by Saini et al (2017) and confirmed in our study, might originate from doubts on the reliability of the current approach for patient-specific QA. Indeed they are mainly based on 2D array measurements performed with beam entrance perpendicular to the surface of a water equivalent phantom (Mackin et al 2013, 2014). These measurements need to be integrated, at least in the commissioning phase of the TPS computation algorithm, with measurements performed at the oblique entrance of the beam delivered with a pre-absorber.
It is worth noting that the reported disagreement could be underestimated in our measurements. In fact, due to the phantom's thickness, it was not possible to select the plane level, which was used to perform the γ-analysis, whereas greater differences might be detected at different planes, as clearly suggested by the difference map between the two algorithms computed at the TPS (figures 4, 6, 8, and 10). On the other hand, only single fields were investigated here. Although the use of multiple fields coming from different angles would not solve the PB limitations, it could improve the plan reliability.
We presented a new methodology to perform validation measurements, using a 2D array chamber instead of the film dosimetry approaches (i.e. Gafchromic) used in other studies (Saini et al 2017). Even though the 2D array has limited spatial resolution, it did not negatively affect the quality of the validation procedure, as the tested beams were planned by an single field optimized technique, i.e. the dose distribution produced by each beam was homogeneous. On the other hand, the 2D array chambers allowed easily obtaining measurements with a fast and direct procedure, avoiding the cumbersome calibration and reading procedures required in film dosimetry. Furthermore, the measurements obtained by the ionization chambers are not affected by the dose-response effect that can impair Gafchromic measures (Zhao and Das 2010, Castriconi et al 2017).
A limitation of our study was the assessment of one single WET for the pre-absorber (around 4 cm WET), which was the one implemented and commissioned in our system. Pre-absorbers with different thicknesses can produce variable results. However, it is reasonable to speculate that the thicker the RS is, the greater the inaccuracy is in its management by the TPS. To our knowledge, since the thickness of the RS is linked to the minimum available beam energy, an RS of 7 cm or thicker is typically used, and only a few centers thinner RS (e.g. 2 cm WET) is currently available. A second limitation could be the fact that in both phantom studies the target area for treatment was designed to include a large volume of the measurement device, and it is well known that CT scans with a 2D array detector system will suffer from some metal artifacts and in principle the MC algorithm could be more sensitive than the PB. However our results showed that the agreement between measured and calculated MC dose distributions is very good, leading us to believe that the influence of artifacts is not marked, at least not for the investigated setup. The last limitation could be the angular dependency of the MatriXX response as reported by Shimohigashi et al (2012) and by Boggula et al (2011). However, both papers found an appreciable angular dependency for gantry angles close to 90° or close to 180°: our delivery setup is in a 'safe' range of the gantry angles from this point of view (max gantry angle 60° or 70°). Moreover, hundreds of measurements done for our clinical patient QA, where we applied a similar delivery setup as proposed here (i.e. MatriXX on the treatment couch and fields delivered with their clinical gantry angle, if the gantry angle is between 315° and 55°) provided a very good agreement (γ passing rate >99%, 3 mm, 3%) between the calculated data (with the MC algorithm) and the measurements, without any need for angular correction.
In PBS treatments, the RS should be positioned as close as possible to the patient surface by an extendable snout to reduce the effective spot size at the patient entrance. Furthermore, due also to the well-known difficulties in its accurate modeling, a splitting technique (i.e. two sub-beams were created, the first one with the pre-absorber to cover only the shallowest part of the target) has recently been proposed (Farace et al 2017) to minimize the number of layers delivered with the RS, thus potentially improving the quality of the plan and the agreement between measurements and predictions. Accordingly, our results confirmed that these methods allow reducing the disagreement of the analytical algorithm with measurements, but did not guarantee an approvable agreement in the worse cases with more oblique gantry angles. The same positioning and splitting procedure only minimally affected the accuracy in the MC modeling of the pre-absorber, which was already good.
In conclusion, our results suggest that in PBS proton therapy pre-absorber needs to be utilized with caution when planning treatment by an analytical algorithm due to potentially great discrepancies between the planned dose and the dose delivered to the patients. This is valid also in the case of brain tumors where this issue could be underestimated. For proton centers that have not yet commissioned an MC code and that need to use an analytical algorithm the application of methods to reduce this negative effect is strongly recommended, such as positioning the RS as close as possible to the patient surface by a movable snout and the utilization of a beam splitting approach. For some types of tumors (i.e. cranio spinal irradiation or sacrum chordoma with the patient in supine position) a very effective way to limit the air gap problem, is to apply a flat RS directly on the treatment couch or, for head tumors, around the head of the patient (Both et al 2014).
Nevertheless, these methods do not protect against the potential clinical impact of the residual uncertainty, particularly at an oblique beam entrance with respect to the patient surface. A further verification, even with a non-clinical MC code, might be desirable. In the centers equipped with a clinically approved MC algorithm, the agreement between TPS prediction and measurements should be good under all the conditions, regardless of the snout position, so that shorter air gap does not seem necessary to improve treatment accuracy. In these cases, the application of a movable snout and/or of a splitting technique can be decided only on the basis of the quality of the plan (Farace et al 2017), which could potentially be improved due to reduced lateral penumbra of the proton beam spots.