

Abstract
Proton therapy treatment planning systems (TPSs) are based on the assumption of a constant relative biological effectiveness (RBE) of 1.1 without taking into account the found in vitro experimental variations of the RBE as a function of tissue type, linear energy transfer (LET) and dose. The phenomenological RBE models available in literature are based on the dose-averaged LET (LETD) as an indicator of the physical properties of the proton radiation field. The LETD values are typically calculated taking into account primary and secondary protons, neglecting the biological effect of heavier secondaries. In this work, we have introduced a phenomenological RBE approach which considers the biological effect of primary protons, and of secondary protons, deuterons, tritons (Z = 1) and He fragments (3He and 4He, Z = 2). The calculation framework, coupled with a Monte Carlo (MC) code, has been successfully benchmarked against clonogenic in vitro data measured in this work for two cell lines and then applied to determine biological quantities for spread-out Bragg peaks and a prostate and a head case. The introduced RBE formalism, which depends on the mixed radiation field, the dose and the ratio of the linear–quadratic model parameters for the reference radiation  , predicts, when integrated in an MC code, higher RBE values in comparison to LETD-based parameterizations. This effect is particular enhanced in the entrance channel of the proton field and for low
  tissues. For the prostate and the head case, we found higher RBE-weighted dose values up to about 5% in the entrance channel when including or neglecting the Z = 2 secondaries in the RBE calculation. TPSs able to proper account for the mixed radiation field in proton therapy are thus recommended for an accurate determination of the RBE in the whole treatment field.
Export citation and abstract BibTeX RIS
1. Introduction
Radiotherapy with light ions is a promising technique for cancer treatment, and proton therapy centers are increasingly spreading worldwide. Protons are currently the most frequently used particles in hadron therapy (Jermann 2015). Despite the fact that relative biological effectiveness (RBE) for protons depends on linear energy transfer (LET), dose level and tissue radiosensitivity, a constant RBE of 1.1 is currently recommended and used for patient treatment (Paganetti et al 2002, ICRU 78 2007, Paganetti 2014). However, several phenomenological and biophysical models have been proposed for taking into account the main RBE dependences in proton therapy (see Polster et al (2015) and Giovannini et al (2016)).
Absorbed dose in proton therapy is the sum of the dose deposited by the primary beam as well as by the secondary particles produced in nuclear interactions, mainly protons and alpha particles (Paganetti 2002, Grassberger and Paganetti 2011). In treatment planning systems (TPSs), the attenuation of the primary beam resulting in a build-up of secondary radiation is considered by measuring/simulating Bragg curves, which are the results of energy deposition by both primary and secondary radiation (Parodi et al 2012). The impact of the secondary radiation on the broadening of the beam in depth is taken into account, for example, by describing the lateral dose distribution by a sum of two Gaussian components (Parodi et al 2013).
For performing biological calculations the information of the mixed radiation field produced should be taken into account. For proton therapy, this has been achieved in two ways: knowing for each depth the energy spectrum of the mixed radiation field and weighting it with a biological database (Mairani et al 2013), or calculating the dose-averaged linear energy transfer (LETD) and then converting it to biological effect, as for example in Polster et al (2015), McNamara et al (2015) and Giovannini et al (2016).
In Grassberger and Paganetti (2011), the authors studied the impact of target fragmentation on LETD by performing Monte Carlo (MC) calculations in water and for two patient cases, considering all the primary and secondary particles, including recoils from inelastic nuclear interactions. Their results showed the importance of taking into account secondary protons in LETD-based radiobiological effectiveness calculations for proton therapy. They also comment on the importance of including the effect of the alpha particles for biological calculations. However, to adhere to the convenient usage of LETD for biological calculations, alpha particles should not be taken into account in the calculation. This is due to the different RBE–LET relationship of alpha particles and protons (Belli et al 1989, Goodhead et al 1992).
In this work, we applied and refined the calculation method introduced and benchmarked against in vitro clonogenic survival data in Mairani et al (2016b) for He ion beams. In fact, both proton and helium ion beams have similar mixed radiation fields in terms of particle species. The major contributions are protons, deuterons, tritons (Z = 1) and 3He, 4He (Z = 2) ions (Grassberger and Paganetti 2011, Ströbele et al 2012), produced in the target fragmentation in the case of proton beams or in both projectile and target fragmentation in the case of helium ion beams.
Starting from the Wedenberg et al (2013) model, we have refined the approach described in Mairani et al (2016b) optimizing a parameterization for predicting the RBE for proton beams, based on dose, LET and the tissue specific parameter  of the linear–quadratic (LQ) model (Joiner and van der Kogel 2009) for photon reference radiation. Extensions of the linear initial RBE–LET dependence found by Wedenberg et al (2013) have been additionally investigated through the set of functions already defined in Mairani et al (2016a) for He ion beams, to eventually improve the description of data as available in literature and to consequently increase the predicting power of the proposed parameterization.
The updated modeling approach for proton therapy has been experimentally benchmarked against in vitro clonogenic data acquired in clinically relevant scenarios for two cell lines: A549 (human alveolar adenocarcinoma) and RENCA (murine renal adenocarcinoma). Spread-out Bragg peaks (SOBPs) and one prostate and one head patient case have been simulated with the MC code FLUKA (Böhlen et al 2014, Ferrari et al 2005). MC-based biological predictions, applying the data-driven approach introduced here, have been compared against LETD-based results calculated taking into account only Z = 1 particles and against values obtained using the clinically assumed constant RBE value of 1.1.
2. Material and methods
2.1. Refinement of the proton RBE model
Wedenberg et al (2013) have introduced a phenomenological model which is able to predict proton RBE based on LET, dose and tissue specific parameter  for the reference radiation. The experimental data analyzed in Wedenberg et al (2013) included cells irradiated with near monoenergetic proton beams with well defined LET values up to around 30 keV μm−1. In this work, we extended the available set of data by including tabulated values characterized by LET > 30 keV μm−1. These additional data are listed in table 1. The final database consists of a total of 31 data (24 from Wedenberg et al (2013) plus seven additional ones; see table 1) and extends the LET interval up to 37.8 keV μm−1. Biological data, from proton beams with beam energies
  5 MeV as well as from deuteron beams at all energies, have not been included in the database to prevent a possible double counting of the biological effect of the He secondaries produced in the nuclear interactions. In fact, in the case of light target nuclei composing the cell nuclei, such as 12C and 16O, the lowest threshold energies11 for the production of 4He secondaries are, respectively, about 7.9 MeV and 5.6 MeV in the case of proton irradiations and about 1.6 MeV and 0 MeV for deuteron beams.
Table 1. The list of cell lines (in the order of increasing  of the reference radiation) added in this study to the published (Wedenberg et al 2013) database, with the calculated
  parameters. Uncertainties are expressed as
  standard deviations.
| Cell line |  [Gy] [Gy] |
Reference radiation |  [keV/ [keV/ m] m] |
Reference |
|---|---|---|---|---|
| V79-753B | 2.804 ± 0.319 | 200 kVp | 1.164 | Belli et al (1998) |
| C3H10T1/2 | 15.000 ± 12.751 | 60Co γ-rays | 0.400 | Bettega et al (1998) |
| M/10 |  |
60Co γ-rays | 0.400 | Belli et al (2000) |
As in Mairani et al (2016a) and Mairani et al (2016b), we used the following formalism:

and

 ,
,  and
and  ,
,  are the linear and quadratic terms for photons and for Z = 1 particles. In accordance with the findings of Folkard (1996) for protons and deuterons, in this work protons, deuterons and tritons are assumed to have the same RBE–LET relationship.
As concerns  , L* represents the rescaled proton LET in water as suggested by Paganetti (2014) and f is the actual (rescaled) LET-dependent core of the parameterization. By following the same strategy as in Mairani et al (2016a), the ten analytical formulas for f(L*) listed in table 2 have been studied, ranging from a simple linear expression as in Wedenberg et al (2013) to more complex ones. Following the goal of possibly refining the existing and validated (Wedenberg et al 2013) model for the
  ratio, we forced the parameter k0 to a null value in equation (1). This way, we reproduced the same (Wedenberg et al 2013) analytical parameterization when adopting the linear function
  , except for the independent variable, here assumed to be the rescaled proton LET. For consistency, all the remaining nine models were also tested with the assumption
  on a wider LET range with respect to Wedenberg et al (2013). For the studied models, the expression of
  (equation (1)) was fitted to the experimentally obtained
  ratios with the
  minimization method for all the cell lines and LET values of the collected database. In contrast to the resampling approach used for He ions by Mairani et al (2016a), in this work all the
  data were available with their experimental uncertainties, allowing for a unique definition of the minimization function (
 ). Fit results were compared using the reduced
  values, i.e.
  ;
;  number of degrees of freedom.
Table 2. List of  parameterizations under investigation (
 ).
).
| Equation | |
|---|---|
| Model | ![$\text{RB}{{\text{E}}_{\alpha}}\left(x|{{\left(\alpha /\beta \right)}_{\text{ph}}}\right)=1+\left[{{k}_{0}}+{{\left(\frac{\beta}{\alpha}\right)}_{\text{ph}}}\right]\centerdot f(x)$](https://content.cld.iop.org/journals/0031-9155/62/4/1378/revision1/pmbaa51f7ieqn031.gif) |
 |
 |
 |
 |
 |
 |
 |
 |
 |
 |
 |
 |
 |
 |
 |
 |
 |
 |
 |
 |
As for  , both parameterizations in equation (2) neglect the
  dependence (Friedrich et al 2013), with the second one additionally disregarding the LET dependence. The LET-dependent model has been fitted on a weighted running average of experimental
  ratios as already applied in Mairani et al (2016a) for helium ion beams.
2.2. Experimental investigation
Human adenocarcinoma cells (A549, ATCC) were grown in Dulbecco's modified Eagle medium (DMEM, ATCC) containing 10% heat-inactivated fetal bovine serum (FBS, Millipore), 2 mM glutamine and 1% penicillin–streptomycin (Gibco). Murine renal adenocarcinoma cells (RENCA, ATCC) were cultured in RPMI-1640 medium (Gibco) supplemented with 10% FBS (Gibco), non-essential amino acids (0.1 mM, Sigma), sodium pyruvate (1 mM, Sigma) and L-glutamine (2 mM, Sigma). Cells were cultured at 37 °C in 5 CO2 atmosphere. Clonogenic assay was performed as previously described by Mairani et al (2016a). Cells were grown in 25 cm2. For the reference photon irradiations, RENCA cells were irradiated using a linear accelerator (LINAC, 6 MV, Artist Siemens) at the German Cancer Research Center (DKFZ), while the irradiation of A549 cells was performed with a 320 kV x-ray irradiator (Precision X-Ray, XRAD 320). Six dose levels have been used from 1 to 10 Gy. The calculated LETph values were 0.204 keV μm−1 and 0.981 keV μm−1 for the 6 MV and 320 kV machines, respectively. The clonogenic photon survival data have been fitted with the LQ model and the best fit parameters (mean ± standard deviation) are reported in table 3.
Table 3. Photon parameters applied in this work.
 (Gy−1) (Gy−1) |
 (Gy−2) (Gy−2) |
 (Gy) (Gy) |
Simulation | References |
|---|---|---|---|---|
| 0.053 ± 0.045 | 0.028 ± 0.005 | 1.89 | RENCA experiment | |
| 0.134 ± 0.025 | 0.021 ± 0.003 | 6.38 | A549 experiment | |
| 0.1 | 0.05 | 2.0 | SOBP9, SOBP21 | |
| 0.1 | 0.01 | 10.0 | SOBP9, SOBP21 | |
| 0.036 | 0.024 | 1.5 | Prostate case | Brenner and Hall (1999) |
| 0.0890 | 0.0287 | 3.1 | Prostate case | Terry and Denekamp (1984) |
| 0.077 | 0.009 | 8.6 | Head case | Jones and Sanghera (2007) |
| 0.0499 | 0.0238 | 2.1 | Head case | Meeks et al (2000) |
Two different proton irradiation set-ups, described in section 2.3.1, have been used at the Heidelberg Ion Beam Therapy Center (HIT, (Haberer et al 2004)) for the experimental biological investigation presented in this work, studying both the dose and depth dependence in clinically relevant scenarios. Two flasks per position, per dose and per irradiation have been used. The water equivalent thickness of the flasks has been measured and taken into account in the determination of the measurement position. However, more distal positions have been avoided to reduce uncertainties from unavoidable positioning errors and possible reproducibility issues of the flask material/thickness. The clonogenic results are presented as mean ± standard deviation which has been used for plotting the experimental data with their error bars. Dosimetric measurements have been additionally performed using a Farmer ionization chamber (TM30010, PTW, Freiburg) in order to verify the dose values calculated by FLUKA.
2.3. Monte Carlo simulations
For the results presented in the next section a research TPS (Krämer et al 2000) applying the HIT physical database (Parodi et al 2012) has been used, while for the results outlined in sections 2.3.2 and 2.3.3, the commercial CE (European Conformity)-labeled TPS 'syngo RT Planning' by Siemens was used to optimize the studied SOBP and patient-like cases, applying the clinical settings of the Italian National Center for Oncological Hadron Therapy (CNAO, (Rossi 2015)) and of HIT, respectively. A constant RBE value of 1.1 is assumed for protons in the commercial TPS.
Benchmarks of FLUKA predictions for proton beams have been carried out at HIT and at CNAO by comparisons with measured depth–dose distributions in water, lateral dose profiles in water and in air and patient plan verifications (Parodi et al 2012, 2013, Molinelli et al 2013, Bauer et al 2014, Tessonnier et al 2014). To perform biological calculations, we used FLUKA-based frameworks as available at HIT and at CNAO (Bauer et al 2014, Tessonnier et al 2014, Giovannini et al 2016, Mairani et al 2016b).
We simulated dose-weighted averages of the linear and quadratic terms of the mixed radiation field,  and
and  , calculated taking into account the biological effect of Z = 1 particles, as described by equations (1) and (2), and of Z = 2 particles (Mairani et al 2016b). Using the dose-weighted averages, the dose and the formalism described in Mairani et al (2010), we calculated RBE and
  values. Simulations performed in this way will be referred to as full calculations in the text. LETD distributions have been additionally obtained by weighting the contribution of only Z = 1 particles in order to use the LETD values for an off-line determination of RBE and
  maps (Polster et al 2015).
2.3.1. Calculations for the experimental investigation.
In the first experimental set-up, RENCA cells were placed in the entrance channel (EC), at around 12 mm water equivalent (WE) depth, and in the middle of a 1 cm WE long SOBP at around 36 mm WE depth (Dokic et al 2016). The beam energy ranges from 63.02 MeV u−1 to 71.94 MeV u−1. The lateral spacing between two pencil beams (PBs) was 3 mm while the spacing in depth between two successive energy slices was 1 mm. The clonogenic dose dependence has been studied varying the planned dose values in the SOBP from 0.5 Gy to 6 Gy, which corresponds to about 0.25 Gy to 3 Gy in the EC. This represents a standard plan for biological investigations at HIT and has been recalculated with the FLUKA MC code. The MC-based dose distributions have been previously satisfactorily benchmarked against dosimetric data in Dokic et al (2016). The found mean and standard deviation of the absolute percentage difference between dosimetric data and MC predictions was 0.7% ± 0.6%.
In the second set-up, A549 cells were placed after PMMA slabs of different thicknesses in order to assess clonogenic survival at 12 different PMMA depths of an SOBP (33 mm long) centered at around 70 mm PMMA depth. The beam energy ranges from 89.91 MeV u−1 to 116.85 MeV u−1. The lateral spacing between two PBs was 3 mm while the spacing in depth between two successive energy slices was 2 mm. The FLUKA scoring was performed in voxels of  mm3. The plan was optimized for achieving 3 Gy (RBE) in the high dose region of the SOBP assuming a constant RBE of 1.1.
2.3.2. Biological characterization of SOBP in clinically relevant scenarios.
For SOBP at CNAO, TPS calculations have been performed in a homogeneous water phantom. Single-field irradiation plans have been optimized to achieve a homogeneous three-dimensional dose distribution of 2 Gy (RBE) in the target region, mimicking cubic-shaped tumors with a 6 cm sidelength centered at 9 cm (SOBP9) and at 21 cm (SOBP21) depth. For SOBP9 (SOBP21), the beam energy ranges from 89.17 (162.56) MeV u−1 to 130.57 (192.12) MeV u−1. The lateral spacing between two PBs was 2 mm. The spacing in depth between two successive energy slices was 2 mm. The FLUKA scoring was performed in voxels of  mm3 as clinically applied at CNAO. For biological calculations, we chose representative tissue parameters of low
  (2.0 Gy) and of high
  (10 Gy), as reported in table 3, in order to evaluate the tissue dependence on the RBE results. 6 MV photon beams have been used for calculating rescaled L* values for the reference photon radiation.
2.3.3. Biological characterization of proton patient plans.
TPS calculations at HIT for two patients were performed using one and two proton beam ports, for a head and a prostate case, respectively. For the head (prostate) case, the beam energy ranges from 48.12 (137.55) MeV u−1 to 104.73 (190.48) MeV u−1. The lateral spacing between two PBs was 3 mm while the spacing in depth between two consecutive energy slices was 3 mm. The FLUKA scoring was performed in voxels of  mm3 and
  mm3, for the head and the prostate case, respectively. The planned dose values were 54 Gy (RBE) and 66 Gy (RBE) in 27 and 20 fractions for the head and the prostate case, respectively, assuming a constant RBE of 1.1.
The photon parameters applied in this work (summarized in table 3) for patient simulations have been chosen similarly to McNamara et al (2015). For the prostate case, we assumed  Gy for the prostate with
  Gy−1 and
  Gy−2 (Brenner and Hall 1999). For the surrounding tissues, we have assumed
  = 3.1 Gy with
  Gy−1 and
  Gy−2 (Terry and Denekamp 1984). For the head patient case for the planning target volume (PTV) we have used, differently from McNamara et al (2015),
  Gy−1 and
  Gy−2,
Gy−2,  Gy (Jones and Sanghera 2007), while for the rest of the brain we have assumed
  Gy−1 and
  Gy−2,
Gy−2,  = 2.1 Gy (Meeks et al 2000). We assumed, as a reference photon radiation, 6 MV photon beams for calculating rescaled L* values.
3. Results and discussion
3.1. Refinements of the proton RBE model
For the description of  as a function of the normalized LET (L*), we have found that the minimum value of
  is given, among the parameterizations listed in table 2, by the linear one
  . We have noticed an important variation (about 13%) of the slope parameter of
  as a function of the maximum LET (
 ) values considered during fitting. To achieve a more robust determination of the slope, we varied
  from 30 keV μm−1 to the maximum available in the experimental data, 37.8 keV μm−1, and averaged the fitting results, obtaining k1 = 0.377 Gy (keV μm−1)−1 The best fit parameterization,
  , calculated with k1 = 0.377 Gy (keV μm−1)−1 (solid line) and the minimum and maximum k1 values (dashed lines), is plotted in the left-hand panel of figure 1, where plots of
 ![$\left[\text{RB}{{\text{E}}_{\alpha}}-1\right]\left(\beta /\alpha \right)_{\text{ph}}^{-1}$](https://content.cld.iop.org/journals/0031-9155/62/4/1378/revision1/pmbaa51f7ieqn088.gif) (to remove the explicit dependence on the cell line) are shown as a function of L* for
(to remove the explicit dependence on the cell line) are shown as a function of L* for  . In terms of
  , both models introduced by Wedenberg et al (2013) and McNamara et al (2015) employed a linear
  –LET dependence, with recommended values of k1 = 0.434 Gy (keV μm−1)−1 and k1 = 0.356 Gy (keV μm−1)−1, respectively. The difference found is mainly due to the different experimental database employed and the fact that in our approach and that of McNamara et al (2015) the rescaled LET has been used while Wedenberg et al (2013) applied the pure LET concept.

Figure 1. Left: comparison between experimental data (points with error bars) and fits (lines) for the  of
of  (equation (1), with
  ). The solid line has been calculated using the average of the best fit values, as explained in the text, k1 = 0.377 Gy (keV μm−1)−1, while the dashed lines have been plotted using the maximum, k1 = 0.394 Gy (keV μm−1)−1, and the minimum, k1 = 0.344 Gy (keV μm−1)−1, values. The
  condition is plotted with a dashed–dotted line. A single point at L* = 7.7 keV μm−1, corresponding to −53.5 Gy on the y axis, has been hidden for display purposes. Right: comparison between experimental data (points with error bars), weighted running average values (squares connected by a dot-dashed line) and equation (2) (solid line) of
  as a function of LET. The
  condition is plotted with a dashed–dotted line.
Download figure:
Standard image High-resolution image values are shown as a function of LET in the right-hand panel of figure 1. The Gaussian fit (equation (2)), performed on the weighted running average values of
  , gave the following best fit parameters: b1 = 3.28 keV μm−1 and b2 = 27.90 keV μm−1, while b0 = 1.00 has been fixed to force the fit to converge to
  for low LET values where the experimental data are not available.
Comparing  descriptions, Wedenberg et al (2013) assumed
  , while McNamara et al (2015) applied a linear dependence of
  on the rescaled LETD and on
  . In our analysis, no statistically significant difference was found between a LET-dependent and a constant
  description (equation (2)) in reproducing
  . The Pearson correlation coefficients applying
  with k1 = 0.377 Gy (keV μm−1)−1 in combination with
  or
or  for
for  vary by only 0.8%.
For the MC-based calculations presented in the next sections, for Z = 1 particles, we applied the best fit parameterization  for the linear term with k1 = 0.377 Gy (keV μm−1)−1 and either
  or
or  for the quadratic term.
3.2. Comparison with experimental data
The first experimental configuration studied in this work is shown in the upper panel of figure 2, where FLUKA-calculated depth–dose and depth–LETD distributions are displayed. The positions in the EC and in the middle of the SOBP, where the RENCA cell survival as a function of the proton dose has been measured, are marked with a and b, respectively. The measured reference photon clonogenic data as a function of the photon dose are shown in the lower-left panel of figure 2 together with the performed LQ fit. The resulting best-fit LQ parameters are reported in table 3. In the other two lower panels marked with (a) and (b), clonogenic data as a function of proton dose in EC and in the middle of the SOBP are compared against model predictions and the results obtained assuming an RBE of 1.1. Qualitatively comparing model outcomes and the experimental data, all the calculations presented seemed to reproduce, within the error bars, the clonogenic data. Keeping in mind the experimental uncertainties, both the full calculations and those considering biologically only Z = 1 particles give similar levels of agreement. Assuming for both H and He particles  instead of a LET-dependent β term seemed to slightly improve the agreement for the high dose region (>3 Gy) for the middle of the SOBP configuration. The calculations performed assuming a constant RBE of 1.1 appeared to overestimate the survival for the middle SOBP set-up, where an experimental RBE value at 2 Gy photon dose of about 1.3 has been found.
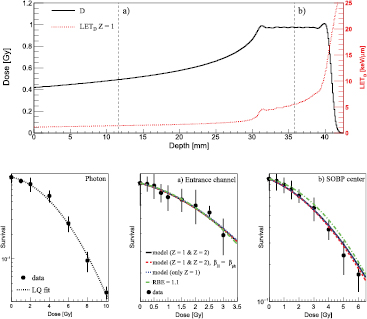
Figure 2. Upper panel: dose values (solid line) as a function of depth in water are plotted together with the LETD values for Z = 1 particles (dotted line). The positions in the EC and in the middle of the SOBP where the RENCA cell survival as a function of the proton dose has been measured are marked with (a) and (b), respectively. Lower-left panel: measured reference photon RENCA clonogenic data (points with error bars) as a function of the photon dose are shown together with the performed LQ fit. Lower-center panel: measured RENCA clonogenic data (points with error bars) as a function of the proton dose are shown together with the model predictions (lines), as reported in the legend, for the EC configuration. Lower-right panel: measured RENCA clonogenic data (points with error bars) as a function of the proton dose are shown together with the model predictions (lines) for the middle of the SOBP configuration.
Download figure:
Standard image High-resolution imageThe second experimental set-up studied in this work is shown in the upper panel of figure 3, where FLUKA-calculated depth–dose, depth–RBE and depth–LETD distributions are displayed together with the acquired dosimetric data. The mean and maximum absolute dose variations between MC-simulated and experimental dose values were, respectively, 1.2% and 2.6%. The absolute dose variation is calculated for each measurement point as the unsigned difference between the measured and MC doses normalized by the measured one and expressed as a percentage. In proton therapy, an accurate prediction of the dose values is important for a sound estimation of the RBE variations, which are expected to be smaller than those with higher LET beams such as helium or carbon ions (Elsässer et al 2010, Mairani et al 2016b). Looking at the survival data, a minimum in the survival has been found, as expected, in the distal part of the SOBP, mainly due to an increase of the LET of the primary beam. For the studied scenario, using a constant RBE of 1.1 seems a good approximation except in the last few millimeters, where a rise in the RBE is expected (Chaudhary et al 2014, Guan et al 2015a, Marshall et al 2016). The mean absolute survival variation between model predictions and experimental data ( ) is reported in table 4 for the four different approaches used. The calculation framework developed in this work, i.e. weighting the mixed radiation field with data-driven biological models, resulted in
  , while the clinically assumed RBE of 1.1 gives
  . Weighting only the Z = 1 particles slightly worsened the agreement compared to the full calculations:
  . The best agreement has been found assuming
  :
:  . The improvement is, however, not statistically significant. Taking into account the experimental (dosimetric and biological) uncertainties, the introduced calculation scheme seems a sound candidate for predicting RBE in proton therapy. However, more experimental data in clinically relevant scenarios are needed to drive conclusions on the performance of the presented RBE phenomenological model.
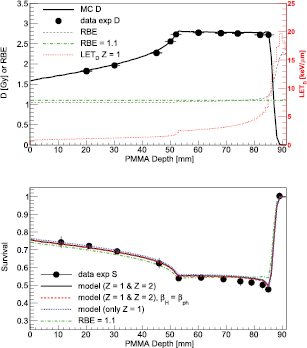
Figure 3. Upper panel: dose (solid line) or RBE (dashed line) values as a function of depth in PMMA are plotted together with the measured dose values (points with error bars). LETD values for Z = 1 particles are depicted with a dotted line. The clinically assumed RBE value of 1.1 is additionally shown (dashed–dotted line). Lower panel: cell survival as a function of the PMMA depth for the A549 cell line. MC survival predictions (lines), as reported in the legend, are compared against experimental cell survival data (points with error bars). Results assuming a constant RBE of 1.1 are depicted with dashed–dotted lines.
Download figure:
Standard image High-resolution imageTable 4. Summary of the mean survival absolute deviation ( ) between model predictions and the experimental data shown in figure 3.
| RBE model |  (%) (%) |
|---|---|
| RBE = 1.1 | 4.0 ± 1.2 |
Z = 1 & Z = 2 +  |
2.7 ± 0.5 |
Z = 1 & Z = 2 +  |
2.3 ± 0.4 |
only Z = 1 +  |
3.0 ± 0.6 |
3.3. SOBP calculations
In figure 4, MC re-calculated dose and  distributions, assuming an RBE of 1.1, as a function of the depth in water have been plotted together with the LETD results taking into account only Z = 1 particles. The contribution of Z = 1 particles to the total dose was about 98.5 (98.1)% in the EC up to about 99.9 (99.9)% in the distal part of the target (DPT) for SOBP9 (SOBP21). The contribution of Z = 2 particles was from about 1.0 (1.2)% in EC to less than 0.1% in the DPT. The contribution of heavier secondaries (Z > 2) in the EC was about 0.5 (0.7)%. The effect of He and heavier fragments increases as the proton beam energy increases due to an enhancement in the production of secondary particles in nuclear interactions. LETD values for Z = 1 particles range from about 0.85 keV μm−1 and 0.70 keV μm−1 in the EC to around 18 keV μm−1 and 14 keV μm−1 in the distal fall-off, for SOBP9 and SOBP21, respectively. The difference in the peak is mainly due to the increased mean and spread of the energy spectra, which is more pronounced for the deepest target, leading overall to lower LETD values for SOBP21 with respect to SOBP9, as shown by Guan et al (2015b). LETD values have been determined for dose values larger than 1.0% of the planned dose. These observations are in line with the findings of Grassberger and Paganetti (2011), using a different MC code.

Figure 4. Calculated values for absorbed dose (D),  assuming an RBE value of 1.1, and LETD for Z = 1 particles, are plotted as a function of the depth in water for SOBP9 and for SOBP21, in the left and in the right panel, respectively.
Download figure:
Standard image High-resolution imageIn figure 5, we studied the effect of including He fragments in the evaluation of biological quantities such as the dose-weighted mixed-radiation field  (upper row) and RBE (lower row) for both SOBP9 (left panels) and SOBP21 (right panels) fields and for two representative tissues
  Gy and
  Gy, as reported in the legends. The results are presented as the percentage variation (Y) between the biological quantities under investigation calculated including or neglecting the effect of He fragments. We found that
  values are higher for lower
  values. This is due to the increasing trend of
  as
as  decreases for a fixed LET (Mairani et al 2016a). For both SOBP9 and SOBP21 fields, the effect of He drops on approaching to the DPT, due to a reduction in the production of higher LET He fragments and the increasing importance of Z = 1 particles. The calculated LETD for Z = 2 particles ranged from about 105 keV μm−1 in the EC to around 155 keV μm−1 in the DPT. Comparing SOBP9 and SOBP21 results for
  , the effect of He fragments is higher for SOBP21 due the higher relative contribution of He secondaries compared to Z = 1 particles.

Figure 5. Upper row: ratio of  as a percentage (
 ), as a function of depth in water, considering or neglecting the Z = 2 fragments in the mixed radiation field for
  Gy and
  Gy for SOBP9 and SOBP21 is depicted in the left and in the right panel, respectively. Bottom row: ratio of RBE as a percentage (YRBE), as a function of depth in water, considering or neglecting the Z = 2 fragments in the mixed radiation field for
  Gy and
  Gy for SOBP9 and SOBP21 is depicted in the left and in the right panel, respectively.
Download figure:
Standard image High-resolution imageThe effect of He fragments on  (data not shown) assuming a variable
  or a constant
  is negligible (less than 0.2%).
In terms of RBE variations, for the studied dose per fraction of 2 Gy (RBE), including the biological effect of He fragments increases the RBE values in the EC to about 4.3 (5.6)% and 2.8 (3.4)%, respectively, with  Gy and
  Gy for SOBP9 (SOBP21). The effect of the
  ratio diminishes as depth increases. For the target region, the variation is within 2% independent of the tissue and the SOBP. For the studied dose per fraction, the influence on RBE of the assumption
  or
or  is negligible (solid and dashed lines in the lower row of figure 5 are indistinguishable).
In figure 6, we plotted, for the two tissues and for the two SOBPs, the RBE values as a function of depth calculated taking into account (Z = 1 & Z = 2) or neglecting (only Z = 1) the contribution of helium fragments. In the case of  Gy the RBE values are always higher than the clinically applied value of 1.1, while for
  Gy the RBE values exceed 1.1 only in the DPT. The effect as a percentage of including Z = 2 fragments for RBE calculations has already been shown in the lower panels of figure 5.
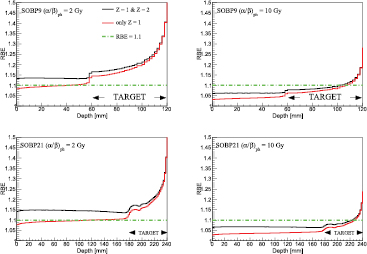
Figure 6. RBE profiles as a function of depth in water for SOBP9 (upper panels) and for SOBP21 (lower panels) applying  Gy (left column) and
  Gy (right column) are calculated taking into account (Z = 1 & Z = 2) or neglecting (only Z = 1) the contribution due to the He secondaries. The clinically assumed fixed RBE of 1.1 is also depicted.
Download figure:
Standard image High-resolution imageFigure 7 (upper panel) depicts MC-calculated  distributions applying the biological model introduced in this work and in Mairani et al (2016b) for both Z = 1 and Z = 2 particles for the prostate treatment plan.
  differences between full calculations, as in panel (a), and the current clinical approach, i.e. applying a constant RBE of 1.1, are shown in panel (b). Similarly to McNamara et al (2015), the largest differences, up to about 7 Gy (RBE), have been found in the distal part of the two opposing fields due to the higher LET component (Grassberger and Paganetti 2011). In these regions RBE values of about 1.3 have been found, while the mean RBE in the PTV is about 1.18, i.e. about 7% higher than the clinical applied value of 1.1. In terms of physical dose, for dose values larger than 1% of the planned dose, the contribution of Z = 2 and Z > 2 particles was about 1.2% and 0.6% in the EC and about 0.6% and 0.3% in the PTV.
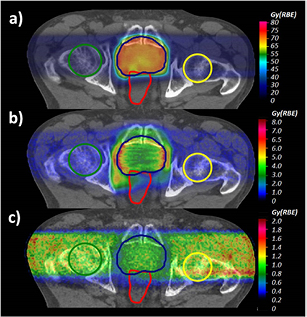
Figure 7. a) MC-calculated  distribution applying the introduced RBE models for both Z = 1 and Z = 2 particles for the prostate case. (b) Differences between MC-calculated
  displayed in (a) and that obtained using the clinical constant RBE of 1.1. (c) Differences between MC-calculated
  displayed in (a) and applying the introduced RBE model weighting only the Z = 1 particles. The PTV, the femurs and the rectum are displayed with lines.
Download figure:
Standard image High-resolution imagePanel (c) of figure 7 shows the differences between  values obtained with the full calculations and taking into account the biological effect of only the Z = 1 particles using equation (1) and the LET-dependent part of equation (2). Weighting the biological effect of He secondaries increases the mean
  by about 0.9 Gy (RBE) in the PTV and by about 1.13 Gy (RBE) for the femurs in the EC. The latter means about 5% higher
  .
.
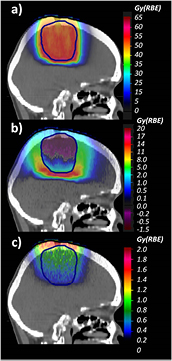
In figure 8, we illustrate the results for the head treatment plan in terms of  with the full calculations in panel (a) and the difference in terms of
  between full calculations and the approximation of a constant RBE of 1.1 in panel (b). In panel (c), the
  differences between the results shown in (a) and those obtained by weighting only the biological effect of Z = 1 particles are plotted.
Figure 8. a) MC-calculated  distribution applying the introduced RBE models for both Z = 1 and Z = 2 particles for the head case. (b) Differences between MC-calculated
  displayed in (a) and that obtained using the clinical constant RBE of 1.1. (c) Differences between MC-calculated
  displayed in (a) and applying the introduced RBE model weighting only the Z = 1 particles. The PTV is displayed with lines.
Download figure:
Standard image High-resolution image
 differences up to about 20 Gy (RBE) in the distal part of the field have been found, which, however, do not correspond to any critical structure. This large difference is mainly due to the low
  value assigned to the brain and the higher LET components in this region. Negative values, corresponding to RBE values lower than 1.1, have been seen in the entrance part of the PTV due the high
  value assigned. Weighting the biological effect of He secondaries increases the mean
  in the PTV by about 0.6 Gy (RBE). Variations in the EC up to 1.4 Gy (RBE) have been found.
The impact of including Z = 2 secondaries in biological calculations for proton therapy appears to be important for low  tissues and in the EC of the fields, especially for deep-seated tumors. The found variations of RBE and resulting
  compared to the clinically applied approach (RBE = 1.1) and the influence of Z = 2 secondaries on determining RBE for normal tissue complications probabilities (NTPC) are controversial, as already explained in Paganetti (2014) and in McNamara et al (2015). In fact, the published survival data used for developing the models are based on clonogenic cell survival experiments. More experimental data are needed for a better understanding of the normal tissue response to radiation and of the impact of the mixed radiation field on RBE determination for NTCP.
Additional work is needed to quantify the effect of heavier secondaries (Z > 2) on the biological calculations in proton therapy. However, their maximum contribution to the physical dose in the EC for the cases studied in this work was about 0.5%.
The calculation approach for proton beams introduced in this study will be further experimentally verified and it will be integrated into the FLUKA MC code, allowing all the FLUKA users to perform RBE calculations with proton and He ion beams. This project goes along the line of providing the hadron therapy community with simple-to-implement data-driven approaches for light ion radiotherapy applications. Moreover, the impact of Z = 2 and heavier secondaries on biological calculations with proton beams should be additionally investigated by means of biophysical models in order to compare their predictions and those obtained in this work.
4. Conclusions
In this work, we have introduced a novel phenomenological approach for calculating RBE in proton radiation therapy which depends on the dose and the ratio of the linear–quadratic model parameters for the reference radiation  and takes into account the mixed radiation effect in terms of both Z = 1 and Z = 2 particles. This calculation scheme for RBE in proton therapy will be implemented in FLUKA and will be integrated in MC-based and analytical TPSs for a proper estimation of the biological effect both in the entrance channel and in the target region.
Acknowledgments
We acknowledge support from the German Research Council (DFG-KFO214) and Deutsche Krebshilfe (Max-Eder 108876). The authors acknowledge the collaboration of FLUKA for the usage of the code and related assistance.