

Abstract
In modern radiotherapy, verification of the treatment to ensure the target receives the prescribed dose and normal tissues are optimally spared has become essential. Several forms of image guidance are available for this purpose. The most commonly used forms of image guidance are based on kilovolt or megavolt x-ray imaging. Image guidance can also be performed with non-harmful ultrasound (US) waves. This increasingly used technique has the potential to offer both anatomical and functional information.
This review presents an overview of the historical and current use of two-dimensional and three-dimensional US imaging for treatment verification in radiotherapy. The US technology and the implementation in the radiotherapy workflow are described. The use of US guidance in the treatment planning process is discussed. The role of US technology in inter-fraction motion monitoring and management is explained, and clinical studies of applications in areas such as the pelvis, abdomen and breast are reviewed. A companion review paper (O'Shea et al 2015 Phys. Med. Biol. submitted) will extensively discuss the use of US imaging for intra-fraction motion quantification and novel applications of US technology to RT.
Export citation and abstract BibTeX RIS
List of abbreviations
| ABC | active breathing control |
| AP | anterior posterior |
| APBI | accelerated partial breast irradiation |
| ART | adaptive radiotherapy |
| BAT | B-mode acquisition and targeting |
| CBCT | cone beam computed tomography |
| CEUS | contrast enhanced ultrasound |
| CT | computed tomography |
| CTV | clinical tumour volume |
| DGRT | dose guided radiotherapy |
| EM | electromagnetic |
| EPI | electronic portal imaging |
| FM | fiducial marker |
| GTV | gross tumour volume |
| FPS | frames per second |
| IGRT | image guided radiation therapy |
| IMRT | intensity modulated radiotherapy |
| kV | kilovolt |
| LED | light emitting diode |
| linac | linear accelerator |
| LR | left right |
| MPR | multi-planar reformatting |
| MR | magnetic resonance |
| MRI | magnetic resonance imaging |
| MRS | magnetic resonance spectroscopy |
| MV | megavolt |
| OAR | organ at risk |
| PET | positron emission tomography |
| PTV | planning target volume |
| PZT | lead zirconate titanate |
| RC | respiratory correlated |
| RF | radio frequency/radiofrequent |
| RMS | root mean square |
| RMSE | root mean square error |
| ROI | region of interest |
| RT | radiotherapy |
| SBRT | stereotactic body radiation therapy |
| SD | standard deviation |
| SI | superior inferior |
| SIM | simulation |
| SNR | signal to noise ratio |
| SOS | speed of sound |
| SPL | spatial pulse length |
| TOF | time of flight |
| TPS | treatment planning system |
| TRUS | transrectal ultrasound |
| TX | treatment stage |
| US | ultrasound |
| USB | ultrasound backscatter |
| VMAT | volumetric modulated arc therapy |
| VR | volumetric rendering |
| 1D | one dimensional |
| 2D | two dimensional |
| 3D | three dimensional |
| 4D | four dimensional |
1. Introduction
Radiotherapy (RT) aims to destroy tumour tissue while sparing normal tissue as much as possible. To this end, a therapy plan must be prepared, based on patient anatomy and physical density provided by a simulation (SIM) image. Typically this is a kilovoltage (kV) computed tomography (CT) image, which provides tissue density information for dose calculation (Evans 2008). At the planning stage regions of interest (ROI) of the patient are contoured, identifying the target(s) and the organs at risk (OAR). Other imaging modalities, such as positron emission tomography (PET), magnetic resonance imaging (MRI), magnetic resonance spectroscopy (MRS) and ultrasound (US), have been used for planning (Bradley et al 2004, Lind et al 2004, Schwartz et al 2005, Payne and Leach 2006, Flores-Tapia et al 2008, Berrang et al 2009) integrating complementary anatomical, biological and functional information. After identifying target contours they are usually expanded by a margin which accounts for patient-related uncertainties in the RT process (Yorke et al 2008), e.g., setup errors, organ motion, and organ volume/shape changes. Margins are selected to minimize the radiation toxicity to the OARs, without introducing a risk of missing the target (van Herk 2004). The dose distribution is then calculated using a treatment planning system (TPS). The dose is delivered to the patient at the treatment stage (TX) in a certain number of fractions.
At TX, it is paramount to accurately reproduce the position of the patient which existed at SIM, when the plan was prepared. Theoretically, the more accurate the patient positioning system, the more the margins can be reduced, which may lead to less radiation toxicity. By using daily imaging at TX the relatively slow organ movements between daily RT fractions, due to factors such as tumour shrinkage or growth, patient weight loss, and hollow organ filling (referred to as inter-fraction variations), can be corrected.
Different imaging systems have been used to determine the position of the ROI, some can also be used to estimate the volume and shape of the ROI, in an approach referred to as image guided radiation therapy (IGRT). Among these systems, x-ray imaging, currently with electronic portal imaging (EPI) devices and in the past with radiographic film (Bel et al 1996, Schewe et al 1996), are well established techniques. At TX, bony structures are localized and, if their position is different from their SIM position, a correction is applied to the patient's position. However, soft tissue targets such as the prostate may move with respect to the bones, and standard x-ray imaging may not offer sufficient contrast to image such targets directly. Other techniques have therefore been introduced to deal with this problem, e.g. fiducial markers (FMs) implanted in tissue (van der Heide et al 2007), cone beam computed tomography (CBCT) (Oldham et al 2005), electromagnetic beacons (Foster et al 2010), MRI (Raaymakers et al 2009) and US imaging (Fung et al 2006).
Among the IGRT techniques there is a growing interest in US imaging, which offers rapidly developing two-dimensional (2D), three-dimensional (3D) and four-dimensional (4D) anatomical and functional imaging capabilities for inter-fraction and intra-fraction imaging. Some earlier review papers have dealt with US-based anatomical localization (Kuban et al 2005) or 3DUS technology (Fenster et al 2001). The current review and its companion review paper (O'Shea et al 2015) are the first to cover extensively the recent progress and growing applications of modern US imaging in RT. This review will focus on past and new developments of quantitative US imaging at SIM and TX stages, in particular for inter-fraction motion monitoring. After a brief comparison to other IGRT imaging methods, the role of US imaging in the RT workflow will be outlined. This is followed by a brief description of US technology, as employed in RT. The role of US imaging in TX planning is described next, followed by a section on its use for monitoring inter-fraction motion. The current applications of US to IGRT for various cancer sites are discussed, and the review concludes with a brief outlook towards the future of US applications in RT. A companion review paper (O'Shea et al 2015) will focus on the use of US to quantify intra-fraction motion and novel applications of US technology to RT, such as improving target identification with e.g. tissue typing, elastography and contrast imaging, Doppler US imaging, photoacoustography, treatment monitoring, toxicity assessment and dose verification.
2. Brief comparison of US imaging to other imaging modalities
US imaging is commonly used in radiology mostly as a qualitative diagnostic tool. It has been widely used for cancer diagnosis (Rose and Allwin 2013), it is relatively inexpensive and easy to use, and it can have a diagnostic value comparable to MRI or CT imaging (see e.g. Fuchsjager et al (2003)). Table 1 provides a comparison between various imaging systems for IGRT. Since this topic was also extensively covered in a recent review on anatomical imaging methods (Evans 2008) we will focus on US-related aspects here.
Table 1. Comparison between US and the most frequently used IGRT techniques in RT. CT refers to devices specific for RT (such as CBCT or CT on rails). Two cases are distinguished: when the beam is in the kV range (standard CT and kV cone beam CT (kV-CBCT)) and when it is in the MV range (MV-CBCT and Tomotherapy). ART refers to adaptive RT (Yan et al 1998). MRI refers to the MR-LINAC combination, which was not available for clinical use at the time this review was written.
| Imaging modality | ||||
|---|---|---|---|---|
| CT | US | MRI | Portal Imagers | |
| Acquisition time (including setup/preparation) | ~2 min | ~2 min | 5 min | <1 min |
| Spatial resolution | 1–3 mm | Sub-mm | 0.5–5 mm | ~1 mm |
| Visualization capabilities | kVCT: soft tissue in the whole body. Whole body imagingMVCT: bone contrast only | Soft tissues: high contrastDifficult to image through air or bones (no lungs/brain) | Soft tissues: high contrast | 2D, Poor contrast (only bones and FM) |
| Invasiveness | YES with FM or contrast | YES for some applications (intracavitary) or using contrast | YES for special application with contrast | YES with FM or contrast |
| Dose delivered | 1–3 cGy (kV);1–15 cGy (MV) | None | None | <1 cGy (kV); 6cGy (MV) |
| Operator dependence | NO | YES | NO | NO |
| Intra-fraction monitoring | NO | YES | YES (Semi real-time) | YES (fluoroscopy) |
| Image distortion | CT: No; CBCT: scatter distortion | YES: (probe pressure) | YES for metal parts | NO |
| Imaging artefacts | Streaking, beam hardening | Aberrations | Geometrical uncertainties depending on acquisition type | Streaking (metal); low SNR (MV) |
| Functional/biological information | YES | YES | YES | NO |
| Motion tracking | YES (4D-(CB)CT); with poor soft tissue contrast; needs FM | YES | YES (2D) | YES (fluoroscopy) |
| Scan setup/preparation | NO, unless contrast CT | YES | NO, unless contrast MRI | NO |
| ART | YES | YES | YES | YES |
| Dose calculation | YES | NO | NO | YES |
| Attenuation information for dose calculation | YES | NO | NO | YES |
US imaging allows contouring of soft tissue structures (Molloy et al 2004, Huang et al 2007) and it can provide complementary information to other imaging systems (Smith et al 2007). US imaging has relatively short acquisition times, comparable to e.g. CT imaging, but it requires currently manual operation of an US transducer in most applications. It is a modality mostly suited for soft tissue imaging; US waves do not propagate easily through air or bones, so applications in lung and brain are uncommon. It is a well-tolerated non-invasive technique, but more invasive applications also exist in RT e.g. in transrectal US imaging for prostate brachytherapy implants (Batchelar et al 2014). It adds no radiation dose to the patient. It is therefore a good candidate for inter-fraction organ motion monitoring, which is a prerequisite for adaptive applications (Juan-Senabre et al 2011, Harris et al 2012). US imaging suffers to some extent from imaging artefacts (section 4.3). It may provide functional information (e.g. Mace et al (2011)). US is inherently a real-time imaging technology as images are reconstructed and visualized during the scan. Recently, real-time US imaging in 3D became possible (Dietz 2004, Majida et al 2009). With continuous scanning over time, 4D monitoring of tissues during TX is possible (Lachaine and Falco 2013). This enables real-time automated structure segmentation (section 5.1) and motion compensation during treatment (O'Shea et al 2015) facilitating adaptive treatment correction. Due to the limited field of view, US images cannot be used directly for treatment planning, but may provide structure contours which may be fused with images from another modality for treatment planning. They lack electron density information, which is required for heterogeneous dose calculation.
US imaging was (and still partially is) considered a user dependent imaging modality with demonstrated inter-user variability (Enke et al 2002, Langen et al 2003). The act of US scanning has been reported to cause clinically significant tissue displacement (Artignan et al 2004). Moreover, it must be noted that US scanning requires specific skills and training, which are typically not part of the education of the radiation oncology staff. To help resolve these issues, specific scan protocols aimed at minimizing user dependence and excessive transducer pressure on the skin can be introduced. To improve quantitative reliability of US systems, advanced transducers, viscous coupling gels, scan directions calculated by computers, speed of sound (SOS) error correction (Fontanarosa et al 2011), robotic probe holders, immobile phased arrays, etc have been introduced. These improvements have made the accuracy and precision of US-based positioning systems more comparable to those of other RT positioning systems.
Using external and intra-cavitary US probes, a wide range of body regions can be imaged: pelvis, abdomen, breast, neck, etc (Block 2012). In clinical practice, only a limited amount of the information provided by US is used, typically the amplitude of the signals and their times of flight (TOF), for brightness and distance calculation. More data could be extracted from e.g. spectral analysis of the US signal (Liu et al 2009). There is therefore much room for future improvements (O'Shea et al 2015).
3. US imaging in the RT workflow
From the late 1970s US imaging made a slow entry in the RT environment for planning purposes (Brascho 1977). About 15 years ago, 2DUS technology was introduced for imaging at the TX stage, primarily with the B-mode acquisition and targeting system (BAT; Nomos, Cranberry Township, PA, USA). At TX, patient setup could be performed based not only on bony structures (as e.g. with megavoltage (MV) CBCT or implanted FM), but on the shape and absolute position in space of the soft tissue targets. This soft tissue based approach had also been reported using kilovoltage CT (kVCT) in the treatment room (CT-on-rail (Uematsu et al 1996)). Initially the BAT system was only applied to prostate cancer treatment (Lattanzi et al 1999). Two 2DUS images of the prostate in perpendicular planes were compared to the corresponding SIM CT images. Limitations of this approach have been reported (Langen et al 2003, Van den Heuvel et al 2003, Lattanzi et al 1999).
Subsequently, 3DUS systems were introduced allowing acquisition of a 3D volume of the target in absolute coordinates. Other sites were investigated such as breast, liver, neck and cervix/uterus (section 7). The current state of the art comprises 4D real-time tracking of targets. At the time of writing, 4DUS is only available for prostate cancer treatment (Clarity system with Autoscan, Elekta). A mechanically swept transducer continuously scans the target transperineally during irradiation and the position of the prostate is compared to the position of the prostate in the transperineal US image at SIM (Abramowitz et al 2012, Wallace et al 2012, Salter et al 2013, Sandhu et al 2013).
In the RT workflow, US imaging in its current implementations is used at two stages. A summary of the steps in the RT workflow, which can benefit from US imaging is displayed in figure 1. In the initial steps, US can help with contouring targets (section 3.1) and designing treatment plans, especially if functional information is available (O'Shea et al 2015). At TX, US can provide information about target positions before treatment (section 4) or during treatment delivery (O'Shea et al 2015). This information can be used for setup corrections in IGRT or to update the dose distribution and, based on the comparison between the present and the expected dose distributions, dose guided radiotherapy (DGRT) can be performed (Lee et al 2008). Finally, functional information can be used for treatment response assessment and follow-up (O'Shea et al, 2015).

Figure 1. US imaging in the RT workflow. The middle row shows the steps involved in RT. The large arrow indicates the temporal direction. The top row identifies the type of input which can be provided by US imaging. Boxes with dashed outlines are the applications not yet clinically commonly available. The bottom row shows the feedback loops which can be assisted by US: patient positioning or treatment plans can be adapted based on the new position of targets provided by US (IGRT) or based on the comparison between present recalculated dose distribution and the expected dose distribution, calculated at SIM (DGRT).
Download figure:
Standard image High-resolution image4. Technologies
Many references are available in the literature about US physics theory and technology. Among these, Carson (1978), Wild (1950), Beranek and America (1990), Bushberg (2012), Duck et al (1998), Webb (2012), Bamber et al (2012), Hill and Dunn (1987) and Hill et al (2004) offer an overview at different levels of complexity.
4.1. Transducers
A US transducer converts electrical signals into acoustic waves and vice versa. Figure 2(a) shows some commonly employed types in RT. The piezoelectric elements of the transducer can be activated in different ways. Subsets of the array can be fired simultaneously to create an acoustic aperture (line of view); then multiple sequential apertures create the field of view. Alternatively, the elements may be activated at different times to steer the beam (phased mode). We refer to the aforementioned literature for more details.

Figure 2. (a) A single element US probe with its components. (b) A linear array transducer with indication of a line of view and the three directions corresponding to axial (X), elevational (Y) and lateral (Z) US beam dimensions from a single acoustic aperture. (c) The field of view of a linear probe; a single line of view (A-mode) is highlighted and the scanning direction is indicated by an arrow. (d) A curvilinear probe with the field of view divided in its lines of view. (Images adapted with permission from figures 16.8 and 16.35 in Bushberg (2012).)
Download figure:
Standard image High-resolution image4.2. Image formation
In US imaging for RT the frequencies used are typically in the 2–8 MHz range. Modern US transducers for medical applications work in pulse-echo mode: the transducer both emits and receives the US waves. If in the scanned volume there is a variation in the physical properties of the tissues (for example density or elasticity), then the acoustic impedance changes. Acoustic impedance is defined as:

where ρ is the physical density and c is the SOS. Whenever a pulse of US waves encounters an interface between materials or tissues with different Z, a proportion of the energy of the pulse is reflected. The reflections are recorded as echoes and used to create the US image. Echo times (or TOF) and amplitudes are recorded. Then the TOFs are converted to depths assuming a fixed value for the SOS (typically 1540 m s−1 (Wells 1977)). Finally the echo amplitudes are plotted on a screen as function of depth. Brightness mode (B-mode) scanning is the most commonly used in RT. The reader is again referred to the literature for more details.
4.3. 3DUS imaging
Conventional 2DUS images are scanned at arbitrary angles through the body. Multiple images are then combined by the operator to form a mental image of the 3D anatomy. This process depends heavily on the operator's skills and is inherently qualitative. For quantitative applications, such as measurement of organ shapes or volumes, this is not optimal (Fenster et al 2001 2011). For these applications the limitations of 2DUS imaging can be overcome with 3DUS imaging (Fenster and Downey 2003, Yorke et al 2008). From the first attempts in diagnostic imaging (Brinkley et al 1982, Greenleaf et al 1993, Rankin et al 1993) technological advances led to the development of the modern commercial 3DUS systems. Currently, three major approaches exist: mechanical scanning, free-hand scanning with position sensing, and electronic scanning which requires 2D matrix arrays.
In the first category are those devices where a motorized mechanism inside the probe case translates, tilts or rotates a conventional 2D imaging transducer, while an acquisition system records the images. Then these images are used to reconstruct 3D volumes using the information on their relative positions provided by a mechanical encoder. The sampling angle can usually be adjusted to balance image quality with temporal resolution (Smith and Fenster 2000). In the second approach, tracking sensors are mounted on conventional 2DUS scanners which allow the measurement of the transducer's position and orientation while it is scanning the volume. This information is then coupled with the images to reconstruct a 3D volume (Pagoulatos et al 2001). The most commonly used tracking systems are robotic arms (Geiser et al 1982), acoustic sensors (Brinkley et al 1984), optical sensors (Detmer et al 1994), magnetic sensors and speckle decorrelation (Housden et al 2007). In the third approach a static 2D matrix of transducer elements is used (Stetten and Tamburo 2001) to perform direct volume scanning (Deng 2003), which is a 3D scan of a volume of interest in its totality, within a time in which movement is negligible and with sufficient spatial resolution. 2D matrix arrays are not yet in common use in RT.
Visualizing the acquired volumes is a key point in 3DUS. The most frequently used visualization techniques are multi-planar reformatting (MPR) and surface rendering. In MPR, it is possible to browse through the volumes selecting e.g. a couple of intersecting cross planes (Nelson et al 1996) (figure 3(a)). Surface rendering is based on ray-casting techniques. It is used when a high contrast is present between different tissues, allowing surface reconstruction of e.g. foetal images (Lee 2003) (figure 3(b)) or cardiac images (Deng and Rodeck 2006). Also volumetric rendering (VR) was introduced using techniques such as maximum intensity projection (Bamber et al 1992).
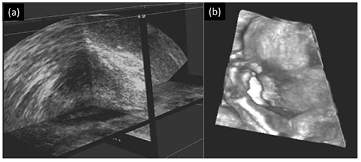
Figure 3. (a) Example of MPR view of a prostate, showing intersecting extracted planes. (b) Example of 3DUS surface render of the face of a foetus. (Images reproduced with kind permission of Fenster et al (2002)).
Download figure:
Standard image High-resolution imageIn RT, typically a 3DUS scan is performed before the treatment and compared to either the SIM CT scan or a SIM 3DUS scan. This allows a direct comparison of the anatomy, as described in the introduction.
4.4. Quantitative measurements in RT using US: errors due to image aberrations
In RT we require quantitative measurements of position, volume and shape of anatomical structures. Minimizing or eliminating image aberrations is therefore of importance. Different causes can generate aberrations. As detailed in the following paragraphs, they can be due to the US device used, the operator scan technique or to US physics. Frequently aberrations appear as obvious distortions or unexpected periodic symmetries. In these cases, correction strategies can be applied. But sometimes aberrations, such as global or local image scale error, can be very difficult to detect, because the effect produced has no obvious characteristics.
Distortion of the propagation direction due to acoustic refraction can cause image aberrations. Multiple reflections can cause reverberation. Mirror images may be induced by strong reflectors in the beam path. Objects with very high or very low echogenicity can cause enhancement or shadowing behind the structure. If excessive pressure is applied by the probe, this can cause displacement and deformation of the scanned structures. US wave propagation along directions other than the assumed beam axis (axial) is caused by side lobes or grating lobes. Finally, an aberration which is particularly difficult to detect is due to the assignment of incorrect SOS values, either globally or locally. Most US devices assume that the SOS value is constant in human soft tissues at a value of 1540 m s−1. This value ranges from 1450 m s−1 (fat) to 1700 m s−1 (tendons) (Mast 2000, Bamber 2004). Since the positions of structures are calculated using SOS, the discrepancy between the assumed and the real local SOS values can produce errors in localization of structures. These distance conversion errors accumulate with depth away from the skin.
4.5. Resolution and contrast
Linear scans produce rectangular images where the lines of view (a-lines) have good correspondence with the vertical columns of pixels in each 2D image. For sector scans produced with curvilinear probes or phased arrays the image has a fan shape. Typically the image resolution improves with depth up to the depth of the focal zone. The spatial resolution can be further divided into three types:
The axial (or longitudinal) resolution is the ability to distinguish objects spatially close along the direction of propagation of the beam (X direction in figure 2(b)). Axial resolution depends on the spatial pulse length (SPL). If the separation in the longitudinal direction between two reflectors is smaller than ½SPL then the reflected pulses overlap and the reflectors are unresolved. For example, at 5 MHz frequency a typical pulse composed of three cycles has a SPL of 0.93 mm. This means that the best resolution achievable is ½ (0.93 mm) = 0.47 mm.
The lateral resolution is in the direction perpendicular to the axial direction but within the scan plane (Z direction in figure 2(b)). The lateral resolution depends on the beam diameter; it varies with depth, potentially resulting in a depth-dependent image quality. It is the best in the focal spot, where the beam reaches maximum convergence. The typical lateral resolution for an unfocused transducer is approximately 2 to 5 mm.
The elevational resolution is in the third orthogonal direction (Y direction in figure 2(b)). Elevational resolution is dependent on the transducer element height in much the same way that the lateral resolution is dependent on the transducer element width.
The side/grating lobes are also different for different transducer types and must be carefully investigated before making quantitative evaluations.
4.6. Spatial calibration
For RT applications it is necessary that the relationship between the US image coordinates and the treatment room coordinates is known. This requires accurate knowledge of the US probe position and orientation. To this end, clinical US devices have used mechanical arms or optical tracking. For the former, before each use the gantry is put at a known position and the transducer is placed in a holder attached to the gantry. The mechanical arm tracks the movement of the US transducer and software is used to determine its position (e.g. BAT system). For optical tracking, infrared (IR) light emitting diodes (LEDs) or reflectors are attached to the probe to localize the probe position via room-mounted optical cameras and to retrieve the corresponding room position of the US images (e.g. BAT and Clarity systems). Both systems require spatial calibration to relate the probe position to treatment room coordinates. Bouchet et al (2001) developed a method of spatial calibration for both 2D and 3D systems. A specially designed phantom containing nylon wires used to generate references for spatial localization was used to calibrate a 3DUS system with a reported mean accuracy of 0.2, 0.9 and 0.6 mm AP, lateral and axial. Poon and Rohling (2005) compared three calibration methods for 3DUS transducers. A phantom, with nylon wire shaped as the three letters 'IXI', was found to produce the best results with accuracy of 2.15 mm and reproducibility of 1.50 mm.
Schlosser et al (2013) have developed a fully automated calibration method that does not rely on customized calibration phantoms. It can be used to spatially localize (inter-fraction) and track (intra-fraction) the probe during RT treatments with a reported accuracy of 1.5 mm (RMSE).
5. Treatment planning
5.1. Target volume delineation
Presently, US imaging is used for target delineation in RT mainly for prostate gynecological and breast cancers, although other sites are sometimes imaged such as liver, kidney, pancreas (Fuss et al 2004) and lymph nodes in head and neck patients (Wein et al 2007). Prostate delineation can benefit particularly from US imaging because the organ is located beneath the bladder which, when full, creates an easily recognizable bladder–prostate interface due its low echogenicity. Also, seminal vesicles can be properly identified, especially when transrectal (TRUS) or transperineal US systems are used. Extensive literature is available about (semi-) automated segmentation methodologies for prostate (see (Ghose et al 2012) for a review). These techniques can be classified into different categories: contour- and shape-based methods; region-based methods; supervised and unsupervised classification methods; and hybrid methods. Even if 3D volumes are available, most of the algorithms are based on 2D projections (Shen et al 2003, Jendoubi et al 2004, Betrouni et al 2005), possibly using information from nearby slices (Ding et al 2007). But since the introduction of 3D systems, more sophisticated algorithms are being developed. Also US-based functional imaging is gaining popularity as a source of information for target identification. For example, contrast enhanced US (CEUS) can be used to detect pathological angiogenesis inside the prostate (Kuenen et al 2013). Also, other biomarkers of cancer can be imaged with US techniques (Sadeghi-Naini et al 2013). The information can then be used to create a biological target volume (BTV).
For gynecological applications (endometrial or cervical cancer) target definition is generally complex due to the presence of multiple structures, which move and deform significantly during treatment. US images typically cannot show the entire target but, if the bladder is full, uterus, cervix and vagina can be correctly visualized (Kim et al 2011).
5.2. Approaches to multi-modality image registration
Registration of US images to complementary images from other modalities can be of use for treatment plan contouring. The methods available for image registration in the literature can be classified into two categories: rigid and non-rigid. Until now, prostate cancer has been the most important application of US guidance in RT and image registration techniques were mainly focused on this organ. Some work was also published on the liver (Porter et al 2001), where a rigid registration between US and MR liver images was based on major vessels as template matching points. Deformable registration of the liver using a model of respiratory motion has been reported (Blackall et al 2005). In this study, US was fused to both MR or CT scans.
Under some circumstances non-rigid registration methods need to be applied to compensate for prostate deformation (Mizowaki et al 2002, Reynier et al 2004). This can occur because of multiple factors: e.g. the displacement of tissue by the endorectal coil during MR scanning, and rectum or bowel filling. Typically, before a deformable registration is applied, an initial manual or automatic affine alignment is required. The most used transformations are spline-based (Reynier et al 2004), in particular octree splines (Szeliski and Lavallée 1996) or B-splines. These techniques are not yet reliably established in RT, so most of the deformable registration examples are found outside of the external beam RT field (Ourselin et al 2000, Daanen et al 2006, Karnik et al 2010). The transformation can also be based on deformable models, such as the adaptive focus deformable model (Shen et al 2001) and elastic warping (Davatzikos 1997), which were used for localization of prostate biopsy targets (Narayanan et al 2009). A registration based on biomechanical finite element modelling was proposed in Hu et al (2009 2012). In Ding et al (2007), magnetic resonance spectroscopic imaging (MRS) image volumes were registered to US/CT images with the assumption that any position inside the prostate did not change with respect to the prostate contour and the center of mass. In general, one of the major issues connected with deformable registrations based on US is the limited FOV which does not allow a complete match with the other modalities (such as CT or MRI), and this results in the need for assumptions on how the deformation propagates outside the US volume.
5.3. Assessment of organ motion
At this moment, 4DCT (Moorrees and Bezak 2012) is commonly used to determine the internal target volume, accounting for e.g. the breathing motion in the PTV. US could also be a useful image modality to quantify this motion. US inter-fraction motion monitoring will be discussed in section 6. Monitoring and tracking of the intra-fraction motion (Molloy and Oldham 2008) will be discussed in the second part of this review (O'Shea et al (2015)).
6. Inter-fraction motion monitoring
6.1. Intermodality systems and intramodality systems
US IGRT systems can be divided in two categories: intermodality and intramodality systems (figure 4). Intermodality systems compare the contours of the reference CT image, acquired during SIM stage, to US images acquired at the TX. The intramodality approach compares like with like, which means it compares the treatment US image contour with a US contour derived from a reference US image acquired at the time of CT SIM.

Figure 4. Overview of the acquisition procedures during the different stages in the patient workflow for inter (top)- and intramodality (bottom) US IGRT systems. The top row shows from left to right: the intermodality US system, a SIM CT image of a pelvic region, the use of the CT image to perform treatment planning, and the comparison between the TX US image and the SIM CT prostate contour. The bottom row shows the intramodality US systems (one in SIM and one in TX room), the acquired SIM US and SIM CT images, the fused SIM US and SIM CT images to perform treatment planning, and the comparison of the TX US image and the reference SIM US image. Left side images reproduced with permission from Best Nomos (top) and Elekta (bottom).
Download figure:
Standard image High-resolution imageThe first generation US IGRT systems were 2D intermodality systems. An example is the B-mode Acquisition and Targeting (BAT) system (Best Nomos, Pittsburgh, PA, USA) of the late 90s. Later 3DUS imaging systems, like the SonArray system (Varian Medical Systems, Palo Alto, CA) from the early 2000s frequently used the intermodality approach. The Clarity system (Elekta, Stockholm, Sweden), which is a quantitative intramodality 3DUS IGRT system, appeared around 2004. It is interesting to note the concurrent research outside of the IGRT field on intermodality 3DUS image registration, and commercial development of systems for image guided surgery and biopsy, where similar technologies to those described above are used to monitor the position and orientation of the US probe (Ukimura and Gill 2009, Stang et al 2010, Nakano et al 2012, Xu et al 2012).
Intermodality systems are implemented at the TX stage of the clinical workflow. The US images are acquired prior to each treatment fraction, and at the matching stage their contours need to be aligned with the delineated target contours of the planning CT. Because the US image guidance workflow is restricted to the TX stage, only one US system has to be calibrated, and any uncertainties arising from image fusion are limited to one stage. Tissue boundaries may be displayed differently in CT and US, resulting in different CT and US contours (Narayana et al 1997, Hoffelt et al 2003, Molloy et al 2004, Kuban et al 2005). Therefore, even with proper training, aligning US images to CT contours can be challenging and error prone. SOS image aberrations due to use of incorrect SOS (Salter et al 2008, Fontanarosa et al 2011, Fontanarosa et al 2012a, 2012b, Fontanarosa et al 2013) can lead to geometrical differences between the CT and US. To reduce the inter-imaging modality discrepancies Task Group 154 of the American Association of Physics in Medicine (Molloy et al 2011) recommends integration of US reference images during SIM, i.e. they advocate the use of an intramodality system.
With an intramodality system the US image guidance workflow begins at the SIM stage. Either immediately before or after the CT acquisition a reference US is acquired. During subsequent TX fractions, at the matching stage the contours from this reference US are aligned with the daily US images. Although the TX step of the intramodality system is less sensitive to alignment errors, the complete workflow contains extra registration procedures, which may increase the susceptibility of the patient positioning process to error. Proper training, accurate calibrations, strict quality control, and good understanding of the complete process can contribute to a decrease of this error susceptibility.
In addition to the commercially available systems, some researchers are developing their own solutions (Harris et al 2007, Wang et al 2008, Harris et al 2009, Schlosser et al 2010) 2012, 2013, Kaar et al 2013). Table 2 gives an overview of the capabilities of these systems (intra-fraction motion tracking is discussed in part II of this review (O'Shea et al 2015).
Table 2. Commercial (first 4 rows) and non-commercial (last row) US systems for inter-fraction motion management in RT.
| System or authors name | Image type | Modality type | Remarks |
|---|---|---|---|
| SonArray system (Varian Medical Systems, Palo Alto, CA, USA) | 3D | Intermodality, inter-fraction motion | Tome et al (2002) No longer available |
| BAT/BATCAM system (Best Nomos, Pittsburgh, PA, USA) | 2D/3D | Intermodality, inter-fraction motion | www.nomos.com/products_Bat.html |
| Clarity system (Elekta, Stockholm, Sweden) | 3D | Intramodality, inter-fraction motion | www.elekta.com/clarity |
| Clarity Autoscan with Monitoring (Elekta, Stockholm, Sweden) | 4D | Intramodality, inter-fraction motion, transperineal | Lachaine and Falco (2013), www.elekta.com/clarity |
| Kaar et al (2013) | 3D | Intramodality, inter-fraction motion | Gantry head mounted clamp for the US-probe, automatic registration |
6.2. Practical implementation
To implement US IGRT, different aspects have to be investigated. Primarily, the US system itself has to be accurate (Tome et al 2002, Molloy et al 2004, Drever and Hilts 2007, Tome and Orton 2008, Wang et al 2008). One of the major concerns for US IGRT is the user variability. Not only is the acquisition of the image for most US systems still performed manually, the images may also be more difficult to interpret than e.g. a CT or MR image. The complete body contour is not visible on a US image, therefore structures may be more difficult to identify on a US image. User experience and training have been shown to improve the consistency and reproducibility of US image interpretation among users (Fuss et al 2003, Fiandra et al 2014).
In most US systems there are several time points at which the user variability can have an influence; during image acquisition, structure contouring and at both the inter- and intramodality matching stages. For prostate (Serago et al 2002, Fuss et al 2003, McNair et al 2006, Orton et al 2006, van der Meer et al 2013), breast (Landry et al 2014) and liver (Bloemen-van Gurp et al 2013) some of the variabilities have been investigated (table 3) and can therefore be taken into account in the uncertainty of the whole procedure.
Table 3. User variability studies in US imaging. ABC=automatic breathing control; SD = standard deviation; Δ = delta, difference
| Authors | System | # patients | # scans | Location | Focus |
|---|---|---|---|---|---|
| Serago et al (2002) | BAT | 22 | Daily, 3 scans by 2 users | Prostate | Intra-user variability, Δ between shifts of 2 subsequent scans: 80‒90% <1 mm, 95% <3 mm; the smallest Δ were in the lateral direction |
| 38 | Daily, 2 or 3 scans by 2 users | Prostate | Inter-user variability (2 users), Δ between shifts of 2 subsequent scan: 50% <1 mm (vert. & long.), 80% <1 mm (lat.), 80‒90% <3 mm | ||
| Fuss et al (2003) | BAT | 20 | 184 | Prostate | Inter-user variability (4–7 users), mean ± SD: standard freeze frames, X: 2.7 ± 1.4; Y: 3.6 ± 1.1; Z: 4.4 ± 1.4 mm. Individual freeze frames, X: 3.9 ± 2.6; Y: 6.0 ± 4.7; Z: 5.4 ± 2.7 mmWhen only experienced users were included, mean ranges reduced by up to 2.4 mm |
| McNair et al (2006) | BAT | 26 | 26 per user | Prostate | Inter-user variability (3 users), Δ in shifts between the observers: 25% to 44% > 3 mm |
| Orton et al (2006) | SonArray | 5 | 25 | Prostate | User variability (4 users): the SD of the Δ in shifts was 1.56 mm and approximately the same as the systems localization uncertainty (<3 mm). For shifts larger than the system localization uncertainty, the SD of the Δ in shifts was nearly always much smaller than the mean shift |
| van der Meer et al (2013) | Clarity | 13 | 376 scans, 817 matches | Prostate | User variability (2–3 users): The overall US user variability (mean SD) is 2.6 mm (Scan variability (SD of the Δ in shifts): inter-user 1.8 (LR), 2.2 (AP), 2.7 mm (SI), Inter-user: 2.6 (LR), 2.2 (AP), 2.9 mm (SI); Match variability (SD of the match): intra-user, 0.8 (LR), 0.7 (AP), 1.0 mm (SI), inter-user, 1.3 (LR), 1.4 (AP), 1.8 mm (SI)) |
| Bloemen-van Gurp et al (2013) | Clarity | 11 | 88 fraction, in 46 fraction 4 US scans were made by 2 users.Matching was done by 3 users | Liver | User variability (2–3 users): In free breathing, the combined uncertainty (mean SD) of US scanning and matching (inter- and intra-user) was 4 mm (1 SD) (Intra-user: 1.4 (LR), 1.6 (SI) and 1.3 mm (AP); inter-user: 1.6 (LR), 2.8 (SI) and 1.2 mm (AP))The combined uncertainty with the use of ABC reduced by 1.7 mm in the SI direction. For the LR and AP directions, no significant difference was observed |
| Landry et al (2014) | Clarity | 15 | Two time points, at the second time point US scans were made by 3 usersTotal 225 matches | Breast | Scanning variability (3 users): Standard error in mean: 0.6 mm; 95% confidence interval: 1.1 mm; P-value: 0.42Contouring user variability (5 users): Standard error in mean: 3.2 mm; 95% confidence interval: 6.2 mm; P-value: 0.19 |
One source of large user variability during image acquisition may be probe pressure. Several studies have shown a potential influence of probe pressure on the prostate position. In two studies (Trichter and Ennis 2003, Dobler et al 2006) radiographs of brachytherapy seed implants were used to measure the influence of probe pressure. Radiographs were acquired before/after and during US image acquisition/SIM. Another study (Serago et al 2002) used sequential CT scans and a dummy US probe. There were also studies which only used the US modality to measure the prostate displacement (Artignan et al 2004, van der Meer et al 2013). The maximum reported prostate displacements due to probe pressure ranged from no displacement to 5 mm under normal conditions and up to 10 mm if (inappropriately) high pressure was applied. The average prostate displacement for the clinically applied pressure is around 3 mm (Serago et al 2002, Artignan et al 2004, van der Meer et al 2013). For intramodality systems, in theory the probe pressure distortion is minimized when similar scanning procedures are used to acquire the images during SIM and TX stages; the corrective shifts are derived as differences between two images, both affected by (ideally) the same probe pressure. One group (Fargier-Voiron et al 2014) reported that it might be difficult to reproduce the applied pressure from one session to another due to the manual sweeping acquisition technique. In general, scanning with similar probe placement, minimal pressure and high viscosity coupling gel may help to minimize the problem. In 2002 a solution was suggested to correct the images mathematically for the probe pressure (Treece et al 2002, Treece et al 2005, Harris et al 2009). Probe pressure can be avoided completely by scanning the prostate transperineally, e.g. by the Clarity Autoscan system (Lachaine and Falco 2013). Another solution to achieve highly reproducible probe pressure could be by using robot-arms (Schlosser et al 2010, 2012, 2013, Lediju Bell et al 2014).
In addition, the position measured by the US system has to be compared to the 'true' position of the target. This was investigated in many studies (table 6). Unfortunately, the 'true' position of an organ is difficult to determine, and none of the available localization techniques are true gold standards. Most studies compare the localization from US to another IGRT technique, where usually the reference technique is already clinically implemented. Some studies reported clinically significant differences. This should not immediately lead to the conclusion that the US IGRT system is incorrect. Nonetheless, with clinically significant differences between systems, changing from one system to another can result in a better or worse patient treatment.
For breast and prostate treatments, the effects of acquiring US images on the daily treatment workflow are minimal. All US images can be acquired by the technologists and no physician involvement is necessary. Extra time for US scans may be offset by time saved by omitting the FM implantation. The time necessary to accomplish the complete US workflow in the treatment room (acquire the TX US, matching to SIM US or CT and shifting the patient) can, after proper training, be less than 5 min (Mohan et al 2000, Chandra et al 2003, Serago et al 2006).
6.3. Comparisons with other IGRT modalities
Various other imaging methods have been investigated to localize the target during RT treatment, as discussed in section 2. In general, one could differentiate systems by their use of ionizing radiation or not, or by their soft-tissue contrast. The non-ionizing radiation techniques, US and MRI, have in most cases high soft tissue contrast. In CT and CBCT the soft tissue contrast is moderate, and in portal imaging only objects with high densities such as bones are easily visible. To compensate for lack of contrast, implanted FMs with a high density can be used as a surrogate to localize the position of the soft tissue organs.
From a practical point of view, CBCT and portal imagers have the benefit of being fully integrated in most linacs. The integration of MRI and a linac is under development (Lagendijk et al 2008), but in-room solutions for both MRI (Jaffray et al 2013, Hu et al 2013) and CT (Knight et al 2009) are already clinically available. This, however, requires large treatment rooms. US imaging systems are less space consuming and less costly, but require patient contact and a user or robot-arm in the treatment room. In the following sections the requirements for imaging of several target sites will be discussed in more detail.
For prostate, the one-to-one comparison of US with other IGRT techniques are shown in table 6 (section 7.1).
7. Clinical studies
7.1. Prostate
Current prostate RT uses fractionated, dose escalating, Intensity-Modulated RT techniques (IMRT), i.e. steep dose fall-offs and tight target margins. The prostate, however, is known to be a structure which can move from day to day by up to several mm or even cm in an unpredictable way, mainly due to variations in rectal and bladder filling (Padhani et al 1999, Mah et al 2002). This necessitates the accurate determination on a daily basis of the position of the prostate and the OARs that caused it to move prior to RT treatment. A US study of the inter-fraction prostate displacement from the planning position found an average 3D displacement of about 7.8 mm (Fung et al 2005, 2006). When analyzed in each dimension, 31–38% of displacements were greater than 5 mm (Gayou and Miften 2008). In another study (Poli et al 2007), systematic uncertainties showed that non-uniform PTV margins of 2.7 mm anterior, 14.9 mm posterior, 7.7 mm right, 6.7 mm left, 11 mm superior, and 7 mm inferior are necessary to encompass the prostate for 95% (2 SD) of all displacements if the US localization system were not used. Fung et al (2005, 2006) observed a slight trend toward superior-posterior directions in the scatter plots of the shifts. In the absence of systematic uncertainties, a uniform PTV margin of 9 mm would suffice (Poli et al 2007). According to another US study (Foster et al 2010), a 4 mm PTV margin would be sufficient.
7.1.1. Prostate imaging modalities in RT.
For prostate RT, a commonly used IGRT method is MV EPI in combination with implanted FMs as a surrogate for the prostate location (van der Heide et al 2007). FM implantation is not always feasible or without risks; infections and bleeding (Henry et al 2004, Langenhuijsen et al 2007) are well known complications in this procedure (Igdem et al 2009, Fonteyne et al 2012). Superior to imaging surrogate FMs are techniques in which the prostate itself is visualized. Both CT and CBCT have moderate soft tissue contrast, reducing the capability to distinguish the prostate from surrounding normal tissue. MRI and US have a higher soft tissue contrast, facilitating prostate recognition. Table 4 compares different IGRT imaging modalities.
Table 4. Comparison of prostate imaging modalities.
| System | Advantages | Disadvantages |
|---|---|---|
| Implanted electromagnetic transponders | Real-time tracking | Invasive, risk of infection/bleeding, transponder migration. Causes artefacts on post-treatment MRI |
| kV or MV EPI ± FM | Quick and easy to acquire. Bones and FM easily visualized | Extra radiation dose, 2D images, bones are used as a surrogate for the prostate position. With FM: invasive, risk of infection/bleeding, migration, presence of FM can perturb dose (Chow and Grigorov 2006, Cheung et al 2010, Huang et al 2011, Landry et al 2012) |
| CT ± FM | 3D images, easy to acquire, FM easily visualized, operator independent | Extra radiation dose, not commonly available in treatment room, moderate contrast without FM. With FM: invasive, risk of infection/bleeding, migration, FMs cannot define prostate fully in 3D, presence of FM can perturb dose (Chow and Grigorov 2006, Cheung et al 2010, Huang et al 2011, Landry et al 2012) |
| CBCT ± FM | 3D images, easy to acquire, FM easily visualized, operator independent | Extra radiation dose, moderate contrast without FM. With FM: see previous line (CT ± FM) |
| US | No extra radiation dose, high imaging contrast, real-time tracking | Image acquisition uses patient contact and is user dependent, requires good training, not all systems are 3D, small FOV |
| MRI | No extra radiation dose, high tissue contrast | Complex, not available in treatment room yet |
The prostate is relatively easy to image with US in the presence of a full bladder, which acts as an acoustic window. Several groups have reported on their findings on the implementation of US IGRT systems (table 5).
Table 5. Studies on the clinical implementation and utility of US IGRT systems.
| Focus | Study facts | Findings |
|---|---|---|
| First clinical experience | # patients: 4–54; 185–4698 daily scans | Daily prostate movement can be >1 cm. Transabdominal US-based stereotactic guidance is a safe method for correcting patient positioning (BAT system: (Lattanzi et al 2000a, Morr et al 2002), SonArray system: (Peignaux et al 2006)). Dosimetric evaluation studies show a better dose coverage when US IGRT shift implemented (BAT system: (Falco et al 2002, O'Daniel et al 2006), Clarity system: (Fraser et al 2010a)). In one study (Peng et al 2008), the degradation of the treatment plan using US IGRT was higher compared to MVCT Practical issues: modest increase in treatment setup time (Morr et al 2002). Adequate bladder filling and modest probe pressure were crucial to achieve adequate image quality without systematic prostate displacements (Pinkawa et al 2008) |
| Analysis of acute toxicity | # patients: 22–50; BAT system | Rate of acute gastrointestinal toxicity reduced with the use of US IGRT. No change in acute genitourinary toxicity rate was found (Jani et al 2005). Without US IGRT significant more acute and a trend towards more late rectal toxicity was found (Bohrer et al 2008). Daily adaptive US IGRT reduces rectal toxicity in the case of empty rectum and to minimizes geometric miss of prostate (Reddy et al 2009) |
| Reports of experience, based on large patient groups | # patients: 130–387;# scans: 3509–10 327 | Image quality of 95% of daily US images with BAT was acceptable for patient positioning. In 3% of the cases, major alignment errors remained (Chandra et al 2003). Particularly large patients or those who cannot maintain bladder filling, transabdominal US images may not show enough anatomical detail to allow accurate localizationUser training in US scanning and interpretation is needed (Orton et al 2006) |
7.1.2. Issues for US imaging for prostate RT.
Several publications comparing 2DUS and FM-based x-ray imaging prostate localization methods have raised concerns regarding the accuracy of US-based techniques (Langen et al 2003, Van den Heuvel et al 2003, Scarbrough et al 2006). The main concerns are US user variability and abdominal probe pressure causing organ motion. However, in some cases the prostate displacement attributed to probe pressure, might actually be the SOS artefact described earlier. Excessive pressure on the patient's skin is, in particular in radiology, believed to be necessary to acquire high quality images. Some studies, however, have reported that only a small amount of pressure is sufficient for good image quality for RT applications (Pinkawa et al 2008, van der Meer et al 2013). By matching the TX and SIM US images, which are affected similarly by the probe pressure, the target displacement will be reduced (the same holds for the SOS error). It remains a problem if treatment planning based on US SIM images is attempted. For intermodality systems where a TX US image is compared to a SIM CT image a target shift may be incorrectly affected by probe pressure. Measures to reduce the probe pressure artefact were discussed in section 6.2.
One-to-one comparisons of US with other IGRT techniques are shown in table 6. The first few studies in the table (Serago et al 2002, Little et al 2003, Trichter and Ennis 2003, Mayyas et al 2013) compare US IGRT to skin marks or bone alignment on portal images, which do not represent the prostate. The differences found were reported as prostate motion, and US IGRT was considered to be an improvement for patient positioning. However, Serago et al (2002) expressed reservations about the technique. They stress the prerequisite of good US image quality and address that US IGRT is not suitable for a subset of patients with physical characteristics that make good quality images difficult to obtain, e.g. patients with high body mass index or those who cannot maintain a full bladder.
Table 6. Comparison studies between transabdominal US and other IGRT techniques for prostate. Most studies report the (absolute) difference as mean ± SD, some use the error notation: μ: mean error; Σ: systematic error; σ: random error (van Herk 2004).
| Authors | System | # patients | # scans | Compared with | Difference (Mean ± SD) (mm) |
Range [absolute] (mm) |
|---|---|---|---|---|---|---|
| Serago et al (2002) | BAT | 38 | Daily | Skin marks | AP: −1.3 ± 4.7; LR: 0.3 ± 2.5; SI: 1.0 ± 5.1 | >10 mm: 1.5% of the LR shifts, 7% AP & SI;≤ 3 mm: 55% AP, 84% LR, 54% SI |
| Little et al (2003) | BAT | 35 | 237 | EPI (bone) | AP: −1.3 ± 5.7; LR: 0.89 ± 3.3; SI: −1.6 ± 6.4 | AP: −19.2–15.7; LR: −10.6–18.4; SI: −21.1–16.1;7.1% > 10 mm; 2.5% > 15 mm |
| Trichter and Ennis (2003) | BAT | 10 | 1728 | EPI (bone) | AP: 4.3 ± 5.1; LR: 3.0 ± 5.9; SI: 3.2 ± 7.3 | — |
| Mayyas et al (2013) | Clarity | 27 | 1100 | EPI (bone) | μ: −0.7 (AP), −0.5 (LR), −1.0 (SI);Σ: 2.4 (AP), 1.6 (LR), 2.4 (SI);σ: 3.4 (AP), 3.2 (LR), 3.6 (SI) | — |
| Peignaux et al (2006) | SonArray | 20 | 780 | EPI | AP: 0.5 ± 5.0; LR: 0.4 ± 4.0; SI: −2.1 ± 4.5 | — |
| Langen et al (2003) | BAT | 10 | 92 | EPI (FM) | AP: 0.2 ± 3.7; LR: 1.6 ± 3.1; SI: 2.7 ± 3.9[AP: 2.7 ± 2.5; LR: 2.7 ± 2.1; SI: 3.7 ± 2.9] | ≥5 mm: 14 % AP, 14 % LR, 33 % SI |
| Van den Heuvel et al (2003) | BAT | 15 | 156 | EPI (FM) | AP: −1.7 ± 4.7; LR: −0.4 ± 4.1; SI: −1.8 ± 6.0 |
— |
| Fuller et al (2006b), Scarbrough et al (2006) | SonArray | 40 | 1019 | EPI (FM) | AP: −1.9 ± 5.7; LR: 1.2 ± 4.7; SI: 3.5 ± 6.7;Vector: 1.7 ± 6.8 [8.8 ± 6.3] | — |
| Serago et al (2006) | BAT | 20 | 322 | EPI (FM) | AP: −1.4 ± 4.8; LR: −0.4 ± 3.3; SI: 1.5 ± 5.7 | — |
| Johnston et al (2008) | ClarityA: auto;B: manual | 7 | A: 255;B: 181 | EPI (FM) | A: AP: 1.3 ± 6.6; LR: 0.9 ± 4.0; SI: 1.3 ± 5.1;B: AP: 2.1 ± 4.6; LR: 0.8 ± 3.5; SI: 0.2 ± 4.5 | A: ≤3 mm: 35.3% AP, 51.0% LR, 48.2% SI;B: ≤3 mm: 45.3% AP, 64.1% LR, 55.2% SI; |
| van der Meer et al (2013) | Clarity | 8 | 244 | EPI (FM) | AP: −2.3 ± 3.6; LR: 2.5 ± 4.0; SI: 0.6 ± 4.9 | AP: −14.3–7.9; LR: −6.6–16.9; SI: −17.9–9.7;77% (AP), 74% (LR), 73% (SI) > 5 mm;56% at least 1 direction > 5 mm, 11% >10 mm; |
| Boda-Heggemann et al (2008) | BAT | 8 | 54 | CBCT (FM) | AP: −1.7 ± 3.5; LR: 0.6 ± 1.7; SI: 0.9 ± 3.3 | — |
| McNair et al (2006) | BATA: US versus CT (FM);B: US versus CT | A: 6;B: 25 | A: 6;B: 25 | A: CT (FM);B: CT | A: AP: 3.2 ± 3.2; LR: 2.2 ± 3.7; SI: −3.3 ± 3.5;B: Box: AP: 4.0 ± 4.0; LR: 2.0 ± 3.0; SI: −2.0 ± 5.0;B: Centroid: AP: 3.0 ± 4.0; LR: 2.0 ± 3.0; SI: −3.0 ± 8.0 | A: ≤3 mm: 35.3% AP, 44.4% LR, 38.9% SI;B: Less than 50% < 2 mm; 27–75% < 3 mm |
| Lattanzi et al (1999) | BAT | 10 | 24 | CT | [AP: 3.0 ± 1.8; LR: 2.4 ± 1.8; SI: 4.6 ± 2.8] | [AP: 0–5.9; LR: 0–7.9; SI: 0–9] |
| Lattanzi et al (2000b) | BAT | 35 | 69 | CT | AP: −0.09 ± 2.8; LR: −0.16 ± 2.4;SI: −0.03 ± 2.3 | [AP: 0–7.0; LR: 0–6.4;SI: 0–6.7] |
| Molloy et al (2004) | BAT | 7 | 7 | CT | AP: 0.1 ± 1.9; LR: 0.1 ± 2.7; SI: 2.0 ± 3.3 | AP: −3.0–3.7; LR: −4.4–5.0; SI: 0–7.0;57% no difference, 43% at least 1 direction ≠ 0 |
| O'Daniel et al (2006 2008) | BAT | 10 | 243 | CT | μ: 0.5 (AP), 0.7 (LR), −0.7 (SI);Σ: 2.2 (AP), 1.3 (LR), 2.3 (SI);σ: 3.4 (AP), 3.0 (LR), 3.2 (SI) | — |
| Orton et al (2006) | SonArray | 6 | 60 | MVCT | Vector: 3.1 ± 1.3 mm | — |
| Feigenberg et al (2007) | BAT | 15 | 218 | CT | AP: −0.62 ± 2.16; LR: −0.20 ± 2.14;SI: −0.32 ± 2.36 | — |
| Jereczek-Fossa et al (2007) | BAT | 10 | 50 | CT | [AP: 3.9 ± 2.8; LR: 2.7 ± 1.9; SI: 3.4 ± 3.0] | [AP: 0.1–9.7; LR: 0.1–7.4; SI: 0–11.6] |
| Robinson et al (2012) | Clarity (only in CT room) | 17 | 136 | CT | Vector: 10.3 ± 7.9; after removing insufficient datasets (23%): 8.7 ± 4.9; after removing insufficient datasets reviewed by manufacturer (56%): 7.4 ± 3.1 | 1.3–61.4; after removing insufficient datasets (23%): 1.0–40.0; after removing insufficient datasets reviewed by manufacturer (56%): 1.8–17.1 |
| Cury et al (2006) | BAT/ClarityA: 2DUS versus 3DUS (inter-intra);B: 3DUS versus CT | A: 40;B: 10 | A: 217;B: 30 | A: 2DUS versus 3DUS (inter-intra);B: 3DUS versus CT | A: AP: 0.1 ± 4.2; LR: 0.9 ± 3.4; SI: 6.0 ± 5.1;B: AP: −0.2 ± 1.6; LR: 0.2 ± 1.7; SI: 0.1 ± 1.4 | — |
aStudies that report absolute (unsigned) differences are indicated in square brackets. bThe abstract of the paper contains different values for the average differences. In the body of the paper: AP: −1.7 ± 4.7; LR: −0.4 ± 4.1; SI: −1.8 ± 6.0; Abstract: AP: 2.5 ± 5.7; LR: −0.4 ± 4.3; SI: −2.6 ± 5.4.
Comparisons of US with CT+FM gave conflicting conclusions, even though the reported differences were small. In the absence of a 'real' gold standard and without taking into account the estimation of the uncertainties of both systems, the decision of which system performs better is subjective. One can only say whether IGRT systems are interchangeable or not, and clinical judgment must dictate whether the difference is of importance (Fuller et al 2006b, van der Meer et al 2013).
Discrepancies between a reference modality and US led to unfavourable conclusions towards US in some studies (Van den Heuvel et al 2003, Serago et al 2006, Johnston et al 2008, Robinson et al 2012) even though these discrepancies may be due to uncertainties in the reference modality. For instance in some studies (Van den Heuvel et al 2003, Fuller et al 2006b, Scarbrough et al 2006, van der Meer et al 2013) the CT images were acquired less than a week after FM implantation, which makes it probable that the FM were not yet fully anchored. Also larger US displacements sometimes resulted in negative conclusions since this resulted in undesirable larger PTV margins. In these studies, overestimation of the prostate motion with US was assumed to be more probable than underestimation with FM. Studies comparing US to EPI and/or CBCT with a linear regression analysis (Lattanzi et al 1999 2000a, 2000b, Little et al 2003, Mayyas et al 2013, van der Meer et al 2013) found these techniques to be comparable (table 6, R = 0.44‒0.88 (AP), 0.24‒0.91 (LR), 0.12‒0.87 (SI)). Clinical workflow and the patient's preference towards non-invasive procedures may also guide the choice between the different methods.
7.2. Breast
Several clinical studies have shown that adjuvant RT post lumpectomy of localized breast cancer leads to improved survival rates (Clarke et al 2005). The use of a boost field given to tissue surrounding the surgical cavity following whole breast photon irradiation has been shown to improve treatment outcome significantly (Antonini et al 2007, Bartelink et al 2007). This tissue, close to the edge of the surgical cavity may contain viable cancer cells, which may remain after surgical excision, and is therefore deemed to be the radiation target. Boost radiation is often delivered by external electron beams, or in more recent clinical practice, by photon beams. Over time, the target may change in size, shape and position due to patient setup, breast oedema, tissue remodelling in the cavity, changes in post-operative breast anatomy, and respiratory motion. To ensure accurate delivery of the boost radiation some form of breast IGRT is needed. To reduce the incidence and severity of toxicity, to reduce the probability of secondary radiation-induced tumours and also for cosmetic reasons the amount of normal tissue irradiated to the boost dose should be kept as low as possible.
7.2.1. Breast imaging modalities in RT.
Imaging modalities that have been used to define the surgical cavity for RT are planar x-ray imaging with kV or MV photons, CT or CBCT imaging, MRI and US imaging. Several studies used metallic FM, often surgical clips, or in the case of MV imaging, gold FM, implanted during lumpectomy to aid the indirect visualization of the target area. Using CT and CBCT imaging it is possible to visualize seroma, the surrounding tissue and FM. Using kV planar imaging, only metallic markers are visible. In US imaging only the seroma cavity (i.e. liquid filled) and the surrounding tissue are visible. All the imaging modalities mentioned above make use of surrogates to identify the target region. Imaging modalities which rely on surrogates such as the chest wall or the skin to obtain the position of the cavity are considered inappropriate due to the geometric uncertainties in the position of the target relative to bony anatomy and breast surfaces (Topolnjak et al 2008). Table 7 gives an overview of the advantages and disadvantages of the various imaging modalities used for breast boost RT. In older studies, planar x-ray imaging with implanted FM was mostly used, which evolved into CT or CBCT imaging, with or without FM. The use of FM as an IGRT 'gold standard' has been questioned by many due to imaging artefacts, FM migration and inadequate 3D coverage (only a limited number of points within the cavity can be visualized, typically less than 10) (Warszawski et al 2004, Coles et al 2007, Berrang et al 2009, Wong et al 2011).
Table 7. Comparison of breast imaging modalities (all non-invasive, if FM are implanted during lumpectomy).
| Modality | Advantages | Disadvantages |
|---|---|---|
| kV or MV x-ray + FM | Easy to acquire, good visibility of FM | 2D images, extra radiation dose, FM migration, metal imaging artefacts, FM reliability to determine cavity depends on surgical implant practice and delineation practice |
| CT ± FM | 3D images, with FM sometimes perceived as gold standard | Extra radiation dose, moderate contrast of seroma cavity, not commonly available in treatment room, use of original planning CT for boost planning may be inadequate due to cavity changes (Wong et al 2011). With FM: FM migration, FM cannot define cavity fully in 3D, FM reliability to determine cavity depends on surgical implant practice and delineation practice |
| US | No extra radiation dose, high imaging contrast of seroma cavity, can easily be used in treatment room | Cavity more difficult to see with time post-surgery, cavity visibility lower for smaller breast and young patients (<40 years) (Warszawski et al 2004), scanning may distort breast geometry |
| CBCT ± FM | Can easily be used in treatment room, markers can be seen easily | Possibly poor cavity visualization depending on imaging artefacts (White et al 2007), extra radiation dose, problematic conversion of Hounsfield units to electron densities for dose calculations (Wang et al 2013) Collision risk of CBCT unit with patient due to off-axis setup for breast irradiation (Fatunase et al 2008) |
| MRI | High tissue contrast | Not available in treatment room, doesn't seem to add much to CT (Kirby et al 2009) |
The first studies to investigate 2DUS imaging for breast RT appeared in the late 90s and early 2000s (DeBiose et al 1997, Smitt et al 2001, Ringash et al 2004, Warszawski et al 2004). These studies were concerned with electron boost except one which explored US imaging for breast brachytherapy (DeBiose et al 1997). These early reports established the usefulness of US imaging for breast RT, but also pointed out that US cavity volumes can differ significantly from CT derived volumes, with the latter nearly always exceeding the former.
In 2007 the first study (Coles et al 2007) reporting the use of 3DUS imaging for breast RT established that this technique was a considerable improvement over 2DUS imaging. They attributed this to the dependence of distance measurements in 2DUS on the probe angle on the breast surface. The cavity was visible on 3DUS in 83% of 40 patients. They noted that all imaging modalities (2DUS, 3DUS and CT) correlated poorly with specimen volume due to cavity changes after surgery. These authors were also the first to report US to CT registration using a camera to track the US probe motion with IR emitters. This technique had been reported earlier for prostate US imaging (section 6.1). The 3DUS system employed was a Diasus (Dynamic Imaging, Livingston, Scotland, UK). They used a dedicated US camera-tracked pointer to point towards the CT FM to register US-CT. They developed a highly original phantom (olives with stones replaced by vaseline, embedded in gelatine to mimic a lesion). US phantoms are generally more difficult to manufacture than CT phantoms due to phantom materials such as plastics being less tissue equivalent for US wave propagation than for x-ray attenuation.
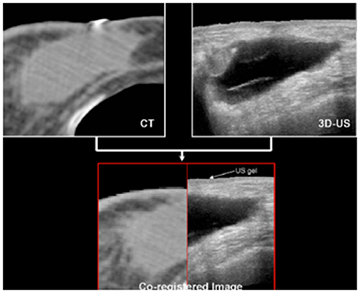
A similar 3DUS study (Berrang et al 2009) for accelerated partial breast irradiation (APBI) with photon beams used the Restitu system (now Clarity: Elekta, Stockholm, Sweden). They also registered 3DUS and CT images and didn't use FM. Figure 5 from this work compares the seroma cavity as seen on CT and US images. They obtained a 3DUS-CT co-registration that was accurate to within 2 mm or less in 19/20 patients. They reported that CT seroma visibility was reduced with dense breast parenchyma, smaller seroma volume, and smaller volume of excised breast tissue, while US seroma clarity was not affected by these factors. They also noted that US imaging had improved interobserver consistency compared with CT in 8/20 cases.
Figure 5. CT image of breast seroma cavity with the cavity indicated in light grey (top left) and US image of the non-echogenic cavity visible in dark grey (top right). Bottom: co-registered image (the mismatch at the skin is attributed to the US gel layer on top of the breast). Adapted from Berrang et al (2009), with kind permission.
Download figure:
Standard image High-resolution image
Surprisingly, until 2010 no breast RT studies had been reported that also investigated the consequences of target localization on the radiation dose to the target. The first study (Fraser et al 2010b) to do so investigated dose variations due to inter-fraction breast motion for electron boost, using the Clarity 3DUS imaging system. They found significant changes in dose between different fractions; the mean dose to the CTV in the combined dose distribution (from 3DUS imaging) deviated from that of the reference scenario where a CT image dose calculation is performed only at the start of the boost treatments from 60% less to 23% greater. Compared to the dose calculation based on the initial CT planning, even larger differences could be obtained.
Another study focused on the workflow for 3DUS cavity volume determination in breast boost RT both with electron and photon beams (Chadha et al 2011). They used the Clarity system with its semi-automatic cavity delineation tools, and the Ultrapath feature which shows on screen the US scan path from the reference US scan to increase reproducibility of subsequent US scans. For electron boost the Clarity system for breast IGRT has a digitizer, which is a camera-tracked pointer tool with IR markers that can be used to digitize the surgical scar. This then provides an external anatomy landmark, in conjunction with the internal seroma cavity landmark, in the beam's eye view. The aforementioned 3DUS breast studies clearly indicate the usefulness of 3DUS imaging as an adjoint to CT imaging, with sometimes clear advantages over CT.
Another imaging modality that has been explored for breast RT is CBCT (White et al 2007, Fatunase et al 2008, Jain et al 2009, Jozsef et al 2011, Donovan et al 2012, Wang et al 2013). In many cases CBCT imaging is used to match chest wall and skin surface, due to the poor visibility of the cavity. These images suffer more from scatter artefacts than CT images, and therefore image quality is reduced and conversion of Hounsfield units to electron density, needed for dose calculation, is compromised. Many reports also express concern about the extra radiation dose incurred by CBCT imaging for multiple treatment fractions. From several studies it is clear that CBCT imaging, which has been shown to be very useful for other treatment sites, is sub-optimal for breast (White et al 2007, Fatunase et al 2008, Jain et al 2009, Jozsef et al 2011). CBCT imaging and 3DUS imaging could probably be used as complementary modalities, but this needs more study.
The use of MRI to identify the target area for breast RT has been reported but did not add much improvement to CT-defined targets (Kirby et al 2009). Implantable markers for US imaging exist, but to our knowledge have not been reported yet in the literature for use in breast RT. CEUS imaging to distinguish diagnostically malignant from benign breast tissue has been described recently (Yuan et al 2013) but has not yet been explored to aid breast RT, as far as we know.
7.2.2. Issues for US imaging for breast RT.
All studies cited use linear array US transducers in the range of 5–12 MHz. Breast distortion due to US probe pressure is an issue but many studies report that the effect is minimal if scanning is done with minimal probe pressure and using a high viscosity gel (Berrang et al 2009, Fraser et al 2010b, Chadha et al 2011, Wong et al 2011). One study mentioned an algorithm to correct US images for pressure (Harris et al 2009, Treece et al., 2002). 2DUS appears sufficient for surgical cavity imaging for simple boost fields but 3DUS is preferred for complex conformal photon boost studies or APBI (Coles et al 2007, Berrang et al 2009). In many older studies of US versus CT only cavity visibility, or dimensions (e.g. distal cavity wall depth from skin surface) were compared, whereas the more recent publications use image registration (Berrang et al 2009, Fraser et al 2010b, Chadha et al 2011, Wong et al 2011). SOS correction for breast was explored recently (Fontanarosa et al 2012a), but was not adopted in any of the studies discussed here.
There are several factors that influence the US visibility of the cavity. Breast size has no influence according to some ((Ringash et al 2004), 2DUS study), while others found that smaller breasts decreased visibility ((Warszawski et al 2004), 2DUS study). Some studies reported that the US visibility didn't depend on time elapsed since surgery, but most studies agree that time degrades the image quality, possibly due to resolution of seroma. Menopausal status doesn't seem to have an influence (Warszawski et al 2004). US appears to work best for patients with low body fat (Ringash et al 2004) and older patients (>40 years) (Warszawski et al 2004). The effect of motion caused by breathing on US imaging seems an ill-studied phenomenon.
Several studies confirm that the cavity appears smaller in US than in CT images. The CT image can include not only the fluid-filled cavity and the surrounding walls, but also the post-operative architectural distortion, breast tissue stranding, fibrosis, and normal dense breast parenchyma (Berrang et al 2009). The US cavity volume was also reported to reduce at a higher rate over time than the CT volume (Wong et al 2011). They found that the tumour bed volume shrunk on average by 10% on CT and 26% on US between scans done during initial planning and just before electron boost. The explanation was that as the seroma reduces over time, fibrotic tissue takes its place and CT cannot distinguish the electron densities of fibrotic tissue and seroma liquid, whereas US can distinguish the difference between solid tissue and liquids. Some studies reported the US cavity to appear more shallow (Warszawski et al 2004) which may indicate SOS aberration (Fontanarosa et al 2012a).
7.3. Other sites
Visibility of abdominal lesions (e.g. liver) is usually quite poor with CT based systems without using contrast media. US IGRT has been used for other organs than prostate and breast, but reports have been few. A 3DUS system was designed for extracranial stereotactic guidance (Meeks et al 2003), which later led to the commercial SonArray system (ZMed, Inc, Ashland, MA, USA; later this system was acquired by Varian Medical Systems, Palo Alto, CA, USA), but it is now no longer marketed. They achieved a spatial accuracy of 1.5 mm, which is vital for stereotactic treatments. In 2004 the utility of the BAT system was investigated for 62 patients with upper abdominal tumours (Fuss et al 2004) and it was successfully implemented in the clinical routine. In only 4.2% of the BAT alignments the quality of the US images was not sufficient to visualize the target, mainly due to colonic and gastric air.
The potential of US guidance with the 2DUS BAT device in RT of the gallbladder has been reported (Fuller et al 2006a). By correction for inter-fraction motion of up to 5 cm (mean: 1.4 cm) the treatment margins could be reduced to a level to compensate for breathing intra-fraction motion. The authors proposed dose escalation trials, based on their confidence in US guidance. The 2DUS BAT system was also used in a study on IGRT for pancreas cancer (Fuss et al 2007). Vector shifts exceeding 1 and 2 cm were needed in 50% and 13.5%, respectively, of the targeting attempts. In several patients, observed systematic US shifts led to CT rescanning and replanning. The large measured shifts support the use of generous margins (up to 3 cm) for pancreatic RT in the absence of image guidance. These data indicate that image guidance for every fraction may lead to more conformal treatments with significant normal tissue sparing and potential dose escalation to the tumour.
A US IGRT BAT procedure was combined with active breathing control (ABC) for stereotactic liver treatment in one patient (Boda-Heggemann et al 2006). Later they evaluated the upper abdominal US IGRT BAT procedure (without breathing control) in a comparison study against CBCT (Boda-Heggemann et al 2009). Three out of the 15 patients were excluded due to unsatisfactory image quality for the US images. In 7 patients the quality of the US images was good; in the other 5 patients the quality was satisfactory. For the good quality US images the average differences (± standard deviation (SD)) between US and CBCT IGRT were (−0.1 ± 3.11) mm in the left–right direction (LR), (0.93 ± 4.31) mm in the superior–inferior direction (SI), and (0.71 ± 3.15) mm in the anterior–posterior direction (AP). For patients with satisfactory image quality, the differences were (−0.6 ± 5.26) mm LR, (1.76 ± 4.92) mm SI, and (1.19 ± 4.75) mm AP.
The user variability in US IGRT for liver patients was investigated (Bloemen-van Gurp et al 2013). The uncertainties of US scanning and US image segmentation in liver lesions were determined with and without the use of ABC. In free breathing, the combined mean uncertainties of repeated scan uncertainty and inter- and intra-observer variation were 1.3 mm LR, 3.7 mm SI, and 1.8 mm AP. Using ABC the mean uncertainty reduced by 1.7 mm in the SI direction. For the LR and AP directions, no difference was observed.
A 2DUS study of 20 bladder cancer patients (McBain et al 2009) measured post-void bladder volumes before and after RT as a surrogate for bladder motion. Bladder dimensions were acquired in 2 orthogonal planes from which the volume was derived. A significant change in voided bladder volume throughout the treatment course occurred in several patients. The mean inter-fraction volume of five patients was 50% larger than the reference US volume assessed at time of CT scanning and planning. Systematic intra-fraction volume increase of bladder can be expected at a commonly assumed rate of ~1 cm3 min−1. This study confirmed a measurable intra-fraction increase in bladder volume in 89% of cases, with results varying highly among patients. Potential infringements on bladder treatment margins and/or over-irradiation of normal tissue were frequently seen in this work. It would appear that for bladder RT daily image guidance is essential, but this would benefit from a 3DUS technique. In two somewhat related publications, 3DUS full bladder measurements were employed to assess motion of the cervix (Ahmad et al 2008) or the rectum (Chang et al 2013) during RT. Ahmad et al used the US-volumes for finding a correlation between bladder filling changes and cervix–uterus displacements. By measuring the bladder filling with US and the correlation with cervix position a best plan of the day could be selected from the patient-specific plan library (Ahmad et al 2008 2011, Bondar et al 2012, Ahmad et al 2013). It would appear that despite claims made in these papers, the US devices used did not result in displayed 3DUS images, but only reported certain bladder measurements. All studies discussed in this section used convex array US transducers, as far as we can discern.
The use of US IGRT for the direct imaging and positioning of gynecological sites is in development, but not many studies have been published yet. The use of 2DUS was successfully introduced for cervix brachytherapy (Van Dyk et al 2009), and recently a phantom and a patient study from the same group were reported with a 3DUS-system for external RT (Baker et al 2013 2014).
US imaging has been reported in head and neck RT, typically employing linear array transducers operating around 10 MHz (superficial imaging). It has been used for e.g. assessing radiation-induced xerostomia (dry mouth) by quantifying tissue texture (Yang et al 2012), and for imaging the radiation effects on paediatric thyroid glands (Kelly et al 2013). See also O'Shea et al (2015). The only 3DUS head & neck study that we are aware of was published as conference proceedings (Fraser et al 2007) and attempted to quantify the temporal volumetric evolution of cervical lymph nodes throughout a course of RT, with the aim of aiding adaptive RT.
Endobronchial US imaging in lung cancer has received much attention in diagnostic imaging, e.g. for staging lung cancer (Zielinski et al 2013), but as far as we know, no direct applications in RT have been reported. There are no accounts known to us on the use of US imaging in brain RT. The latter two applications are difficult for US imaging due to the limited penetration power of US waves in these anatomical regions.
8. Future developments
From this review it is clear that US imaging is a mature imaging technology, which is available for image guidance applications in RT. The reality is, however, that far fewer RT centers use US imaging than x-ray based imaging (EPID, CT, CBCT) for verification of treatment setup. The only clinical RT application that has known modest success is daily US imaging of prostate, for setup corrections. This was the most popular application in the late 90s and it remains so until today. X-ray based imaging has been more popular, and is used by most advanced RT centers for regular (but usually not quite daily) verification of the patient anatomy for various target organs. The advantages and disadvantages of both imaging techniques have been discussed in this review. There are currently high expectations for another form of image guidance: MR imaging, especially when integrated with a linac (Lagendijk et al 2008). This technique could offer high imaging contrast during therapy, but is not without its disadvantages of which the high cost will certainly be one. The imaging modalities discussed here are to some extent complementary. Therefore, one could envisage future RT departments having access to multiple forms of imaging for treatment guidance, which could be used in combination depending on the application.
Currently, it is not easy to predict the future of US imaging in RT. US image quality has improved significantly recently. Several novel applications of US to RT will be discussed extensively in the companion review paper (O'Shea et al 2015). These techniques show that US imaging also has the potential to provide advanced functional imaging over x-ray based imaging. Most verification imaging currently done in RT is for inter-fraction motion. For intra-fraction motion, US imaging can play an important role. It can be used to quantify motion of organs or endogenous structures in 3D and in real time, without the need for implanted markers. X-ray based imaging will usually be too slow and/or need invasive FMs to achieve the same goal. However, until now widespread US use in RT has been hampered due to the extensive training requirements. Therefore there is an urgent need to make US imaging user-independent and automatic. Some recent advances have been reported in this direction by using robotic operator-less systems (Lachaine and Falco 2013). These first efforts may lead to novel concepts, such as adhesive US probes with phased crystal arrays, obviating the need for probe positioning systems and mechanically swept beams as in current applications (such as Autoscan). These could even be left on the patient during beam delivery, enabling true intra-fraction motion management, and eventually providing direct feedback to the irradiation system.
Much work is also being done to segment structures automatically in real time, and one can envisage applications such as real-time dose display based on anatomical 3D deformation fields derived from daily US imaging. Real-time display of the 3D differences between the planned and the delivered dose will then also be within reach. These new developments, in combination with automated operator-less imaging may lead to a much higher clinical acceptance of the US IGRT technique in RT.
The current applications of IGRT in particle beam therapy are limited, but with the growing popularity of this form of therapy the need for image guidance in this field will also increase. US imaging may have a new opportunity to be integrated with the particle beamline to enable real-time organ monitoring. Challenges such as interfacing real-time US equipment with scanning particle beams will have to be addressed. Lastly, US imaging offers some exciting opportunities such as real-time in vivo particle beam range monitoring, based on thermo-acoustic processes in tissue (Terunuma et al 2007, Xiang et al 2013).
Acknowledgments
We thank Dr Martin Lachaine for carefully reviewing the manuscript. Dr Philip Evans, Dr Tony Falco and Rui Lopes are thanked for many useful discussions. SvdM is funded by GROW (School for Oncology and Developmental Biology, Maastricht University). JCB, EJH and ToS acknowledge Cancer Research UK for funding.