

Abstract
Several solid phantom materials have been tested regarding their suitability as water substitutes for dosimetric measurements in brachytherapy with 192Ir as a typical high energy photon emitter. The radial variations of the spectral photon fluence, of the total, primary and scattered photon fluence and of the absorbed dose to water in the transversal plane of the tested cylindrical phantoms surrounding a centric and coaxially arranged Varian GammaMed afterloading 192Ir brachytherapy source were Monte-Carlo simulated in EGSnrc. The degree of water equivalence of a phantom material was evaluated by comparing the radial dose-to-water profile in the phantom material with that in water. The phantom size was varied over a large range since it influences the dose contribution by scattered photons with energies diminished by single and multiple Compton scattering. Phantom axis distances up to 10 cm were considered as clinically relevant. Scattered photons with energies reaching down into the 25 keV region dominate the photon fluence at source distances exceeding 3.5 cm.
The tested phantom materials showed significant differences in the degree of water equivalence. In phantoms with radii up to 10 cm, RW1, RW3, Solid Water, HE Solid Water, Virtual Water, Plastic Water DT, and Plastic Water LR phantoms show excellent water equivalence with dose deviations from a water phantom not exceeding 0.8%, while Original Plastic Water (as of 2015), Plastic Water (1995), Blue Water, polyethylene, and polystyrene show deviations up to 2.6%. For larger phantom radii up to 30 cm, the deviations for RW1, RW3, Solid Water, HE Solid Water, Virtual Water, Plastic Water DT, and Plastic Water LR remain below 1.4%, while Original Plastic Water (as of 2015), Plastic Water (1995), Blue Water, polyethylene, and polystyrene produce deviations up to 8.1%. PMMA plays a separate role, with deviations up to 4.3% for radii not exceeding 10 cm, but below 1% for radii up to 30 cm.
As suggested by the results of the dose simulations and the values of the linear attenuation coefficient, μ, over a large energy range, the balanced content of inorganic additives in a phantom material is regarded as the key feature, providing water equivalence with regard to the attenuation of the primary photons, the release of low-energy photons by Compton scattering, and their attenuation by a combination of the photoelectric and Compton effects.
Export citation and abstract BibTeX RIS
1. Introduction
In radiotherapy, dosimetric measurements in phantoms are important for quality assurance and the safety of the patient. In photon brachytherapy, photon radiations from radioactive sources with energies ranging from ten up to several hundred keV and even 1.25 MeV (60Co) are in use. Aside from the steep dose gradients attributable to the primary photons and mainly due to the distance-square law, the relatively high dose contribution by scattered photons with energies diminished by single and multiple Compton scattering is a characteristic of 'high-energy' (HE) sources such as 192Ir whose photon spectrum extends up to about 1.35 MeV with the majority of the spectrum below 620 keV. Measurements of dose distributions are typically performed in water, whose dosimetric properties are similar to those of the soft tissues. While water provides excellent reproducibility and comparability of measurements worldwide, the precise and reproducible placement of radiation detectors in water is a challenge and may be the cause of measurement errors. Another drawback of water is that it cannot easily be shaped to simulate the contours of organs or body surfaces which might be desirable in dosimetric studies or special clinical situations.
A number of solid phantom materials complying with these requirements have already been created as substitutes for water, mainly for the purposes of high-energy photon-beam teletherapy and of x-ray diagnostics (ICRU 44 and 48, DIN 6800–1). In the field of HE-type brachytherapy photon sources, the question of solid water substitute phantoms has been studied in a series of papers by Meigooni et al (1988), Meli et al (1988), Williamson (1991), Ballester et al (2001a, 2001b, 2004), Reniers et al (2004), and Song et al (2009). In a study focused on the phantom properties of Solid Water, polystyrene, and PMMA, Tedgren and Carlsson (2009) pointed out that a solid substitute material can only be considered as water equivalent if a range of phantom sizes is taken into consideration. Following this conclusion, the present Monte Carlo simulation of the photon field generated in a phantom surrounding a commercial 192Ir therapy source has been performed for phantom sizes ranging up to 30 cm radius and 60 cm height. Furthermore, polyethylene, Plastic Water (as of 1995), Plastic Water DT, Plastic Water LR, Original Plastic Water (as of 2015), Virtual Water, Blue Water, HE Solid Water, RW1, and RW3 have been included as candidate materials alongside the previously studied materials Solid Water, polystyrene, and PMMA (Tedgren and Carlsson 2009). A list of the simulated materials with their physical and chemical properties and their producers is shown in table 1. The influence of the phantom size will be interpreted considering the spectral contribution by low-energy Compton-scattered photons, and a simple rule of classifying the degree of the water equivalence of a solid phantom material by means of its linear attenuation coefficient will be outlined.
Table 1. Investigated phantom materials and their elementary composition.
| Material | Producer | ρ g cm−3 | ρe 1023 cm−3 |  |
Mass fraction | Chemical composition |
|---|---|---|---|---|---|---|
| Polyethylene |
— | 0.930 | 3.194 | 0.955 | H: 0.1437; C: 0.8563 | CH2 |
| RW1 |
PTW, Freiburg, Germany | 0.970 | 3.297 | 0.986 | H: 0.1319; C: 0.7941; O: 0.0381; Mg: 0.0091; Ca: 0.0268 | 0.918 CH2 |
| 0.067 CaCO3 | ||||||
| 0.015 MgO | ||||||
| Water |
— | 1.000 | 3.343 | 1.000 | H: 0.1119; O: 0.8881 | H2O |
| Plastic Water |
CIRS, Norfolk, USA | 1.014 | 3.326 | 0.995 | H: 0.0925; C: 0.6282; N: 0.0100; O: 0.1794; Cl: 0.0096; Ca: 0.0795; Br: 0.0003 | n.a. |
| Plastic Water LR |
CIRS, Norfolk, USA | 1.029 | 3.333 | 0.997 | H: 0.0791; C: 0.5362; N: 0.0174; O: 0.2721; Mg: 0.0929; Cl: 0.0023 | n.a. |
| Original Plastic Water (2015) |
CIRS, Norfolk, USA | 1.030 | 3.337 | 0.998 | H: 0.0779; C: 0.5982 N: 0.0178; O: 0.2357; Cl: 0.0023; Ca: 0.0676 | n.a. |
| HE Solid Water |
Gammex, Middleton, WI, USA | 1.032 | 3.360 | 1.005 | H: 0.0813; B: 0.0005; C: 0.658; N: 0.0221; O: 0.1937; Na: 0.002; Mg: 0.0111; Al: 0.0003; Si: 0.0114; S: 0.0003; Cl: 0.0014; Ca: 0.0178 | n.a. |
| Plastic Water DT |
CIRS, Norfolk, USA | 1.039 | 3.345 | 1.001 | H: 0.074; B: 0.0226; C: 0.467; N: 0.0156; O: 0.3352; Mg: 0.0688; Al: 0.014; Cl: 0.0024 | n.a. |
| Virtual Water |
Med-Cal, Middleton, WI, USA | 1.040 | 3.376 | 1.010 | H: 0.077; C: 0.687; N: 0.023; O: 0.189; Cl: 0.001; Ca: 0.023 | n.a. |
| Solid Water |
Gammex, Middleton, WI, USA | 1.043 | 3.389 | 1.014 | H: 0.081; C: 0.672; N: 0.024; O: 0.199; Cl: 0.001; Ca: 0.023 | n.a. |
| RW3 |
PTW, Freiburg, Germany | 1.045 | 3.376 | 1.010 | H: 0.0759; C: 0.9041; O: 0.0080; Ti: 0.0120 | 0.98 C8H8 |
| 0.02 TiO2 | ||||||
| Polystyrene |
— | 1.060 | 3.432 | 1.027 | H: 0.0774; C: 0.9226 | C8H8 |
| Blue Water |
Standard Imaging, Middleton, WI, USA | 1.090 | 3.503 | 1.048 | H: 0.0745; C: 0.8642; N: 0.0042; O: 0.0286; Ti: 0.0285 | n.a. |
| Polymethyl-methacrylate |
— | 1.19 | 3.865 | 1.156 | H: 0.0804; C: 0.6000; O: 0.3196 | C5H8O2 |
1Fractions noted in the last column are mass fractions.
2Composition according to DIN 6800–1 (2013).
3Composition according to Hermann et al (1985).
4Composition according to Tello et al (1995).
5LR for Low Range (low energy range). Composition according to producer (2013).
6Original Plastic Water as of 2015. Composition according to producer (2015).
7HE for High Equivalency. Product number: Gammex-557. Composition according to producer (2015).
8DT for Diagnostic-Therapy Energy Range. Composition according to producer (2005).
9Composition according to McEwen and Niven (2006).
10Original Solid Water. Former product number: RMI-457. Actual product number: Gammex/RMI-457. Composition according to DIN 6800–1 (2013).
11Composition according to Harder et al (1988).
12Composition according to producer (2014).
13Assuming a water temperature of 3.98 °C. At 20 °C the electron density of water is 3.336  1023 cm−3 with a mass density of 0.998 g cm−3.
2. Materials and methods
The Monte Carlo simulations were performed using FLURZnrc, the fluence computation module of EGSnrc, in which cylindrical coordinate geometry was implemented (Taylor and Rogers 2008). A Varian GammaMed Plus HDR192Ir therapy source with a length of 3.5 mm and a radius of 0.35 mm was simulated according to Chofor et al (2013, 2015). The therapy source was placed in the center of a cylindrical phantom with the source axis oriented parallel to the cylinder axis. The phantom was made from water as the reference material or from the substitute material to be checked. The phantom radii, R, and heights, H, used in the simulations were (a) R = 5 cm and H = 10 cm, (b) R = 10 cm and H = 20 cm, (c) R = 20 cm and H = 40 cm, and (d) R = 30 cm and H = 60 cm. Although the influence of the precise phantom shape on the dose distribution will be of interest in the single application case (Granero et al 2008), cylindrical phantoms can be used as the basis of comparison in judging the suitability of various materials as water substitutes.
The spectral fluence of the photons was recorded at points of interest radially distributed across the transversal plane through the center of the therapy source. The radial distances, r, used in this paper refer to this center. The photon transport cut-off energy was 5 keV and Rayleigh scattering was neglected. The resolution of the recorded spectral fluence was 5 keV per energy bin. The spatial resolution of the simulation was characterized by the width and height of the ring-shaped scoring volumes arranged along the transversal plane. These volumes have a width of Δr = 1 mm (except 1.5 mm in the segment adjacent to the radiation source) and a height of Δz = 0.5 mm.
PRESTA-II was used as the electron-step algorithm. Spin effects, electron impact ionization, bound electron Compton scattering, photoelectron angular sampling, and atomic relaxation were included in all simulations. The boundary crossing algorithm was selected to be EXACT, the bremsstrahlung angular sampling library was set to KM, the bremsstrahlung cross section library was BH, the photon cross section library was XCOM, and pair angular sampling was set to simple. The lower limit of the total energy was set to 10 keV for photons and 521 keV for electrons. The number of simulated histories was 109 resulting in a fluence error of less than 0.2%. The simulated phantom materials were selected as suggested by ICRU 44, ICRU 48 and DIN 6800–1 (2013) as well as by their current commercial availability. The simulated phantom materials are shown in table 1 in the order of their mass densities. All simulated phantom materials are commercially available.
The absorbed dose to water in a phantom made from any given material, Dw,material, was calculated for each ring-shaped scoring volume along the transversal plane by the kerma approximation:

where Φi,material is the photon fluence in energy bin i and Ei the mean photon energy in that bin. The mass energy absorption coefficient, (μen/ρ)i,water, was taken from the XCOM or NIST libraries respectively (Hubbel 1982, Boone et al 1996). The application of the kerma approximation in equation (1) was justified by the small ranges of the photo and Compton electrons in the chosen range of photon energies. Thus the relative deviation of the resulting radial profile of the absorbed dose to water in a given phantom material from that in water was characterized by the quotient:

The radial dose function:

was calculated from the absorbed dose to water in water or in a substitute material in accordance with the recommendations for a line source from the updated report, TG-43U1 by Rivard et al 2004, as well as from a joint report by the AAPM and the ESTRO (European Society of Therapeutic Radiation Oncology) by Perez-Calatayud et al (2012). The contribution to the spectral fluence by the primary and the scattered photons was determined for each phantom size as functions of the source center distance.
3. Results
3.1. Dose profiles in water and in various phantom substances
The radial dose functions, gL(r), of the absorbed dose to water in water phantoms with various values of radius, R, and height, H, are shown in figure 1, hereby illustrating the influence of the phantom size. The small, downward curved 'hooks' of the full and the dashed curves appearing near the outer boundaries of the phantoms illustrate the absence of backscattering from the outside. Furthermore, in figure 1, the dashed curve family with logarithmic ordinate scale shows the radial variation of the absorbed dose to water, D(r), normalized to its value at r = 1 cm. The open circles illustrate that the dose profiles closely follow a 1/r 2 law from r = 1 cm up to large source distances. Near r = 10 cm, D(r) has decayed to 1% of its value achieved at r = 1 cm; therefore, source distances up to 10 cm can be roughly regarded as the zone of clinical interest. According to Perez-Calatayud et al (2012), the dose profile in a substitute material should closely approximate the dose profile in water within this zone. These results compare well with the literature (Ballester et al 2001a, Pérez-Calatayud et al 2004). Ballester et al (cited in Taylor and Rogers 2008) performed their calculations using the Monte Carlo code Geant 3. These results were presented using a third degree polynomial fit.
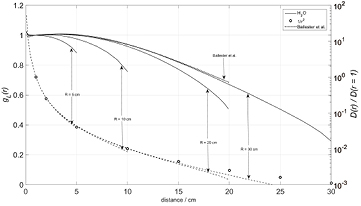
Figure 1. Radial profiles of the absorbed dose to water in various cylindrical water phantoms of radius R and height H = 2 R, concentric with a commercial 192Ir source Varian GammaMed plus HDR. a) Left ordinate and full curve family: radial dose functions, gL(r). For comparison included: Data by Ballester et al 2001a, valid for a phantom with radius 20 cm and height 40 cm and fitted by a polynome. b) Right ordinate and dashed curve family: absorbed dose profiles, D(r), normalized to the absorbed dose at source center distance 1 cm; the open circles illustrate the 1/r2 law.
Download figure:
Standard image High-resolution imageThe left side panels of figures 2–5 show a comparison between the computed radial dose functions, gL(r), in water and in the tested substitute materials. The right side panels of these figures represent the ratios of the computed absorbed doses to water, D(r), in phantoms of the tested substitute materials and in water phantoms according to equation (2). Figures 2–5 refer to phantom sizes ranging from R = 5 cm, H = 10 cm up to R = 30 cm, H = 60 cm.

Figure 2. Radial profiles of the absorbed dose to water in various phantom materials, (a) polymers and (b) commercially available mixtures, for a phantom with R = 5 cm and H = 10 cm. Left: radial dose functions, gL(r). Right: quotient of the absorbed dose to water in the phantom material and the absorbed dose to water in a water phantom of the same size.
Download figure:
Standard image High-resolution image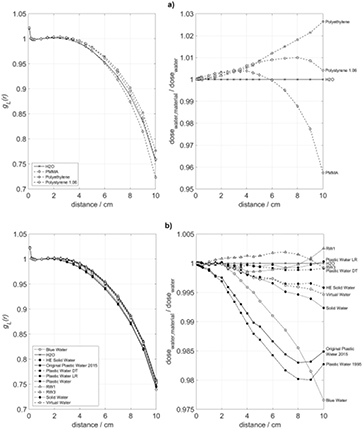
Figure 3. Radial profiles of the absorbed dose to water in various phantom materials, (a) polymers and (b) commercially available mixtures, for a phantom with R = 10 cm and H = 20 cm. Left: radial dose functions, gL(r). Right: quotient of the absorbed dose to water in the phantom material and the absorbed dose to water in a water phantom of the same size.
Download figure:
Standard image High-resolution image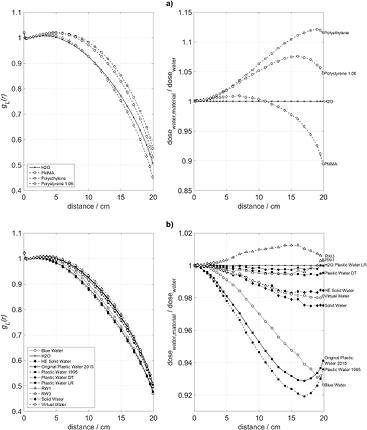
Figure 4. Radial profiles of the absorbed dose to water in various phantom materials, (a) polymers and (b) commercially available mixtures, for a phantom with R = 20 cm and H = 40 cm. Left: radial dose functions, gL(r). Right: quotient of the absorbed dose to water in the phantom material and the absorbed dose to water in a water phantom of the same size.
Download figure:
Standard image High-resolution image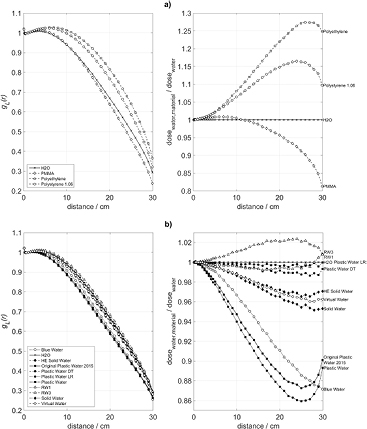
Figure 5. Radial profiles of the absorbed dose to water in various phantom materials, a) polymers and b) commercially available mixtures, for a phantom with R = 30 cm and H = 60 cm. Left: radial dose functions, gL(r). Right: quotient of the absorbed dose to water in the phantom material and the absorbed dose to water in a water phantom of the same size
Download figure:
Standard image High-resolution imageThe maximum dose deviations between the substitute and water phantoms, appearing in figures 2–5 for radial source distances up to 10 cm are summarized in table 2. In small phantoms with radii up to 10 cm and heights up to 20 cm, the absorbed doses to water in RW1, RW3, Solid Water, HE Solid Water, Plastic Water LR, Plastic Water DT, and Virtual Water deviate from those in water not more than 0.8%. For Plastic Water (as of 1995), Original Plastic Water (as of 2015), Blue Water, polyethylene, and polystyrene the deviations remain within 2.6%. In larger phantoms with radii exceeding 10 cm and heights above 20 cm, the deviations of RW1, RW3, Solid Water, HE Solid Water, Virtual Water, Plastic Water DT, and Plastic Water LR remain below 1.4%, while the deviations of Plastic Water (as of 1995), Original Plastic Water (as of 2015), Blue Water, polyethylene, and polystyrene reach 8.11%. PMMA phantoms up to R = 10 cm show deviations up to 4.25%, whereas the deviations in the larger PMMA phantoms remain below 1.0%.
Table 2. Maximum percentage deviation of the absorbed dose to water, D(r), achieved in a water substitute material from that occurring in water, for radial source distances up to 10 cm. Deviations not exceeding 1.00% are marked by bold letters.
| Phantom radius/cm | |||||
|---|---|---|---|---|---|
| 5 | 10 | 20 | 30 | ||
| Deviation/% | Polyethylene | +0.89 | +2.60 | +6.00 | +8.11 |
| RW1 | +0.10 | +0.30 | −0.46 | −0.47 | |
| Plastic water (1995) | −0.49 | −1.99 | −5.35 | −6.01 | |
| Plastic Water LR | −0.04 | −0.08 | −0.17 | −0.17 | |
| Original plastic water (2015) | −0.42 | −1.51 | −4.72 | −5.27 | |
| HE Solid water | −0.14 | −0.42 | −1.05 | −1.16 | |
| Plastic water DT | −0.06 | −0.11 | −0.34 | −0.32 | |
| Virtual water | −0.18 | −0. 53 | −1.05 | −1.21 | |
| Solid water | −0.29 | −0.76 | −1.22 | −1.36 | |
| RW3 | −0.11 | +0.20 | +1.00 | +1.10 | |
| Polystyrene | −0.18 | +1.00 | +5.23 | +6.00 | |
| Blue Water | −0.84 | −2.34 | −2.99 | −3.33 | |
| PMMA | −1.95 | −4.25 | +0.90 | +0.99 | |
3.2. Spectral variations
In order to supply a framework for the discussion, the spectral fluence of the photons was calculated for points of interest at varying distances from the source center (figure 6), showing a strong relative increase of the continuous, low-energy contribution by scattered photons with increasing distance. The total fluence as well as the relative fluence contributions by primary and scattered photons were calculated for varying distances from the source center and for water phantoms of variable size, as shown in figures 7(a)–(d). Notably, the relative fluence contribution by scattered photons at r = 1 cm from the source is about 25%, and at r = 2 cm it is near 40%, whatever the phantom radius. The point of equality between the relative fluence contributions due to primary and scattered photons is regularly found near a source distance of about r = 3.5 cm, slightly moving towards the radiation source with increasing phantom radius. These results match those by Russel and Ahnesjö (1996), who predict the point of equality to be near 6 cm, however, by including an air-filled applicator in the simulation effectively reducing the portion of scattered radiation near the radiation source. Thus the low-energy fluence contribution by the scattered photons dominates in regions with source distances exceeding 3.5 cm, i.e. well within the range of the clinically relevant distances up to r = 10 cm.

Figure 6. Spectral fluence versus photon energy at different radial distances in a water phantom with R = 20 cm and H = 40 cm. The photon energy axis was limited to 700 keV for better visualization of the spectrum of the scattered photons.
Download figure:
Standard image High-resolution image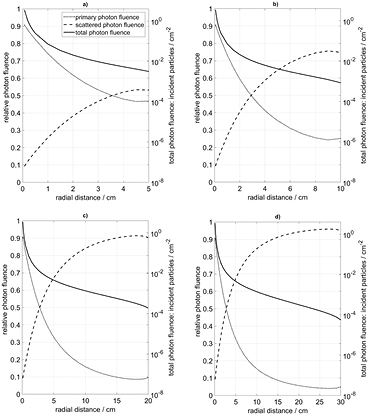
Figure 7. (a)–(d) Relative contributions by primary and scattered photons to the total photon fluence (left ordinate) and total photon fluence per incident particle (right ordinate) in cylindrical water phantoms of various sizes. Note that the crossover point between the primary and scattered contributions occurs near radial distance 3.5 cm.
Download figure:
Standard image High-resolution imageThis important role of the scattered photons is the reason why the photon attenuation coefficient over a large energy range (figure 8) is of central importance for the ability of a water substitute to mimic a water absorber. Some of the substitute mixtures have been designed in such way that their linear attenuation coefficient deviates from that of water by less than 1% over a large energy region.
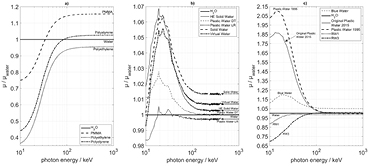
Figure 8. Energy-dependent ratio of the linear attenuation coefficients, μ, of a given phantom material and of water. (a) Polymers without additives. (b) and c) Polymers with inorganic additives. Note that the scales of the y-axes differ.
Download figure:
Standard image High-resolution image3.3. Density variation of polystyrene and variation of the inorganic additives
In order to further elucidate this subject by Monte-Carlo simulations, the assumed mass density, ρ, of a polystyrene phantom was varied between 1.02 g cm−3 and 1.10 g cm−3. Table 3 shows the corresponding electron densities, ρe, and relative electron densities, ρe/ρe, water. The photon fields and dose-to-water profiles in the material surrounding the 192Ir source were computed for each phantom size (figures 9(a)–(d)). The shapes of the resulting radial dose profiles vary with the mass density and electron density, but neither the polystyrene with electron density close to water (ρ = 1.03 g cm−3) nor with any higher electron density is able to closely simulate the radial dose-to-water profile for all phantom sizes.
Table 3. Electron densities and relative electron densities for polystyrene of variable mass density.
| ρ/g cm−3 | ρe/1023 cm−3 | ρe/ρe, water |
|---|---|---|
| 1.02 | 3.303 | 0.988 |
| 1.03 | 3.335 | 0.998 |
| 1.05 | 3.400 | 1.017 |
| 1.06 | 3.432 | 1.027 |
| 1.10 | 3.562 | 1.066 |
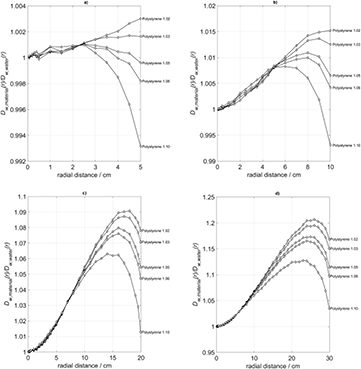
Figure 9. Radial profiles of the absorbed dose to water in polystyrene phantoms with varying densities and with radii varying from 5 cm to 30 cm, compared to water phantoms of the same size.
Download figure:
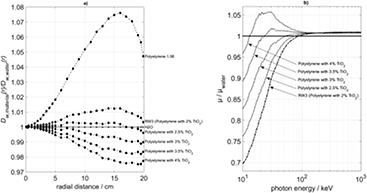
Standard image High-resolution imageThe effect of admixed inorganic additives on the radial dose-to-water profile according to the Monte-Carlo results is shown in figure 10. The variation of the titanium-dioxide admixture to polystyrene (table 4), including RW3 (which is polystyrene with 2% of TiO2 by weight, see table 1), has a considerable influence upon the shape of the lateral dose profile. In table 4 we have assumed that the producer can vary the TiO2 content, but keep the mass density of the mixture constant at 1.045 g cm−3. This assumption has been made to illustrate the influence of the amount of the inorganic admixture, but is based on the actually existing possibility of a producer to vary the density of polystyrene. To visualize this effect, figure 10(a) displays the dose profiles relative to that in water. The reason behind the effect is shown in figure 10(b), where the attenuation coefficients of the mixtures are shown in comparison to those of water for energies between 10 keV and 1 MeV.
Table 4. Elementary composition of polystyrene with different admixtures of titanium dioxide.
| Material | ρ/g cm−3 | ρe/1023 cm−3 |  |
Mass fraction | Chemical composition |
|---|---|---|---|---|---|
| RW3 (polystyrene with 2% TiO2) | 1.045 | 3.376 | 1.010 | H: 0.0759; C: 0.9041; O: 0.0080 Ti: 0.0120 | 0.98 C8H8 |
| 0.02 TiO2 | |||||
| Polystyrene with 2.5% TiO2 | 1.045 | 3.374 | 1.009 | H: 0.0754; C: 0.8995; O: 0.0100 Ti: 0.01499 | 0.975 C8H8 |
| 0.025 TiO2 | |||||
| Polystyrene with 3% TiO2 | 1.045 | 3.372 | 1.009 | H: 0.0751; C: 0.8949; O: 0.0120 Ti: 0.0180 | 0.97 C8H8 |
| 0.03 TiO2 | |||||
| Polystyrene with 3.5% TiO2 | 1.045 | 3.370 | 1.008 | H: 0.0747; C: 0.8903; O: 0.0140 Ti: 0.0210 | 0.965 C8H8 |
| 0.035 TiO2 | |||||
| Polystyrene with 4% TiO2 | 1.045 | 3.368 | 1.007 | H: 0.0743; C: 0.8857; O: 0.0160 Ti: 0.0240 | 0.96 C8H8 |
| 0.04 TiO2 |
Figure 10. (a) Radial profiles of the absorbed dose to water in polystyrene phantoms with varying admixtures of TiO2 and total density 1.045 g cm−3 for a cylindical phantom with R = 20 cm and H = 40 cm, compared with a water phantom of the same size. (b) Attenuation coefficients of various polystyrene/TiO2 mixtures compared with that of water.
Download figure:
Standard image High-resolution image
4. Discussion
4.1. The size of the clinically relevant source distance region and the required phantom sizes
The purpose of this paper was to check the suitability of some water substituting phantom materials, known from ICRU 44, ICRU 48, DIN 6800–1 and the publications mentioned in the introduction, in the energy region of the HE photon sources for brachytherapy. 192Ir was taken as the example.
The first parameter to be considered was the size of the clinically relevant source distance region. As seen in figure 1 by comparing the radial profiles of the absorbed dose to water (dashed curves) with the open circles, these dose profiles closely follow the 1/r 2 law up to large source distances. For the primary photons, the 1/r 2 behavior of the lateral dose profile is known from the geometry functions, GL(r,θ), for arbitrary values of θ (Rivard et al 2004), which all converge towards 1/r 2 for values of r  L /2. For the scattered photons, the 1/r 2 behavior of the lateral dose distribution is the expression of their diffusion-like, spherically symmetric outward transport from the near-source region where they are released by the primary photons. Therefore, as doses exceeding 1% of the dose at 1 cm distance can occur at distances up to 10 cm, the region r ⩽ 10 cm is considered as the clinically relevant distance region (Perez-Calatayud et al 2012).
The second important parameter is the size of the phantom. The downward curved 'hooks' of the radial dose functions shown in figure 1, which occur near the outer phantom surfaces, are characteristic of the dose contribution by scattered photons. They can be explained by the absence of photons backscattered from the outside of the phantoms. Moreover, the Monte Carlo simulation of the radial profiles of the relative fluence contributions by primary and scattered photons (figures 7(a)–(d)) illustrates that the fluence contribution by scattered photons is already considerable at a few centimeters from the source center and is becoming the prevailing contribution at distances exceeding 3.5 cm. In accordance with that, Anagnostopoulos et al (2003) have shown that the dose contribution by the scattered photons becomes predominant at source distances exceeding 6 cm. Therefore, it is appropriate to judge the water equivalence of the various phantom substances by their dose-to-water profiles for the clinically relevant source distances up to 10 cm and for various phantom sizes (figures 2–5).
4.2. Suitability of water substitute materials for 192Ir brachytherapy photon fields
Figures 2–5 and table 2 provide a survey of the deviations of the radial dose profiles in the investigated substitutes from those in water for cylindrical phantoms of varying size. The commercially available phantom materials RW1, RW3, Solid Water, HE Solid Water, Virtual Water, Plastic Water DT, and Plastic Water LR have satisfying water-equivalent properties for all sizes of the investigated cylindrical phantoms with radii varying from 5 to 30 cm. Other substances such as Original Plastic Water (as of 2015), Plastic Water (as of 1995), and Blue Water, although closely agreeing with water in the electron density (see table 1), as well as the pure plastics such as polyethylene and polystyrene produce larger deviations of their radial dose-to-water profiles from water. Moreover, there is the surprising effect that PMMA, in spite of its largely deviating electron density (table 1), can approximately be called water equivalent in the case of large phantom radii, but is not water equivalent at smaller phantom sizes (table 2). These results confirm those obtained by Tedgren and Carlsson (2009) for Solid Water, polystyrene and PMMA.
4.3. Identification of the relevant properties of the substitute materials
In an attempt to understand the physical background for the shapes of these dose profiles, it is useful to consider the spectral distribution of the photons contributing to the dose deposition in phantoms. Figure 6 shows plots of the spectral fluence at radial distances of 0 cm, 1 cm, 2 cm, 5 cm, 10 cm, and 15 cm. While near the source surface, the peaks of the primary photon spectrum at energies of 295–320 keV, 465–485 keV, and 585–615 keV are clearly expressed, the continuous spectrum of the scattered radiation, extending down into the energy region of 25 keV, becomes dominant with increasing source distance (compare Chofor et al 2015). These results are consistent with the spectra shown by Tedgren and Carlsson (2009) for the radial distance of 7 cm. It is evident that in the case of 192Ir and, more generally, of the HE photon sources for brachytherapy, the contributions to the total dose at energies below 100 keV is becoming non-negligible and may even become preponderant at the larger source distances. Therefore, the key features to be considered in the choice of water simulating phantom substances are their photon interaction coefficients over a large range of energies (figure 8), covering the energy regions where either the photoelectric effect or the Compton effect prevails.
Figure 8 permits the comparison of the linear attenuation coefficient, μ, of various phantom materials with that of water over a large range of photon energies. It is evident from this comparison that the same substances which distinguish themselves by a good reproduction of the dose profiles in water can as well be identified as those whose linear attenuation coefficients closely resemble that of water. Thus, the close simulation of the linear attenuation coefficient at all relevant photon energies is the property enabling a phantom material to mimic the dose profiles in water. This confirms the conclusion drawn by Tedgren and Carlsson (2009). This general conclusion is not limited to a special geometrical setup or radiation source, but can be regarded as valid for other HE brachytherapy sources and geometries as well.
The approximate equality of the electron density of the phantom material with that of water has frequently been used as the criterion for the suitability of the material to replace water in practical dosimetry. However, this criterion is typical for accelerator-produced high-energy photons with energies in the MeV region. In that range of the primary photon spectrum, the Compton effect is the preponderant interaction with water not only of the primary photons, but also of the scattered photons released in the phantom by Compton interactions. But the spectral situation is different from the case of brachytherapy photon sources, where the spectra of the Compton-scattered photons are significantly shifted to energies reaching into the region of dominant photoelectric effect.
4.4. The role of inorganic additives in organic polymer substances
These conclusions have been further underpinned by a series of dose calculations for model polystyrene phantoms with various mass densities (table 3). Supporting calculations have been performed for model polystyrene phantoms with variable admixtures of TiO2 (table 4).
Figure 9 shows the dose distribution in polystyrene with various mass densities. Close simulation of water over at least 10 cm from the source is never achieved. As shown in figure 8(a), polystyrene shows a reduced attenuation coefficient compared to water in the relevant range below 100 keV.
However, by adding additives with enhanced atomic numbers, e.g. titanium dioxide, the attenuation in the energy range of the photoelectric effect can be increased. The addition of 2% titanium dioxide as in RW3 produces overall acceptable results (see figures 2–5 and table 2). By further increasing the portion of titanium dioxide up to 2.5% and 3%, the photoelectric attenuation approaches that of water, but in the region beyond 100 keV, i.e. of prevailing Compton effect, the absorption is now becoming too strong (figure 10).
Finally, the surprising fit of PMMA for the larger phantom sizes (table 2) appears as the result of a fortuitous compensation of attenuation and scattering effects (compare figure 8). However, PMMA is not suitable as a water substitute for the smaller phantom sizes and can therefore not be relied upon in studies of the dosimetric effect of detailed organ or body surface contours.
5. Conclusions
In photon brachytherapy with HE sources like 192Ir, which was the special subject of the present study, the main cause for the deviation of the radial dose-to-water profile in an arbitrary solid phantom material from that in water is the dose contribution by low-energy scattered photons. As shown by Monte-Carlo simulation, at a source distance of about 3.5 cm in water, the contribution of scattered radiation to the total photon fluence equals that of the primary photons and becomes dominant at the larger distances. On the other hand, in the case of 192Ir, the doses at source distances up to 10 cm appear as clinically relevant, and various phantom sizes have to be considered. Therefore the appropriate choice of a water-equivalent phantom material implies that the linear photon attenuation coefficient of water is mimicked not only in the photon energy region of predominating Compton effect, but also at lower energies where the photoelectric effect prevails. This is achieved by the admixture of inorganic components to organic polymer substances whose electron densities are simultaneously suitable to fit the attenuation by water in the energy region of the Compton effect. RW1, RW3, Solid Water, HE Solid Water, Virtual Water, Plastic Water DT, and Plastic Water LR were identified as closely suitable for phantom sizes extending from small dimensions such as radius 5 cm and height 10 cm up to radius 30 cm and height 60 cm. Polyethylene, Original Plastic Water (as of 2015), Plastic Water (as of 1995), Blue Water, and polystyrene are not suitable for the larger phantom sizes exceeding radius 10 cm, and PMMA shows a fortuitous water equivalence at phantom radii exceeding 10 cm. In summary, RW1, RW3, Solid Water, HE Solid Water, Virtual Water, Plastic Water DT, and Plastic Water LR can be recommended as water-equivalent solid phantom materials to be used for dosimetric measurements around 192Ir photon sources. Application examples will be treated in a further publication.