

Abstract
In the context of investigating the potential of low-dose PET imaging for screening applications, we developed methods to assess small lesion detectability as a function of the number of counts in the scan. We present here our methods and preliminary validation using tuberculosis cases. FDG-PET data from seventeen patients presenting diffuse hyper-metabolic lung lesions were selected for the study, to include a wide range of lesion sizes and contrasts. Reduced doses were simulated by randomly discarding events in the PET list mode, and ten realizations at each simulated dose were generated and reconstructed. The data were grouped into 9 categories determined by the number of included true events, from >40 M to <250 k counts. The images reconstructed from the original full statistical set were used to identify lung lesions, and each was, at every simulated dose, quantified by 6 parameters: lesion metabolic volume, lesion-to-background contrast, mean lesion tracer uptake, standard deviation of activity measurements (across realizations), lesion signal-to-noise ratio (SNR), and Hotelling observer SNR. Additionally, a lesion-detection task including 550 images was presented to several experienced image readers for qualitative assessment. Human observer performances were ranked using receiver operating characteristic analysis. The observer results were correlated with the lesion image measurements and used to train mathematical observer models. Absolute sensitivities and specificities of the human observers, as well as the area under the ROC curve, showed clustering and performance similarities among images produced from 5 million or greater counts. The results presented here are from a clinically realistic but highly constrained experiment, and more work is needed to validate these findings with a larger patient population.
Export citation and abstract BibTeX RIS
1. Introduction
Advances in medical technology are allowing significant reduction in the radiation dose associated with many imaging modalities, and this trend will continue as the technology improves further. This will naturally open new clinical avenues for medical imaging. For example, several groups have focused on reducing the dose associated with computed tomography (CT) for screening of patients at high risk for lung cancer (Team 2011, Bach et al 2012) with significant potential improvements reported for patient prognosis (Aberle et al 2011). Additional metabolic information from positron emission tomography (PET) has been shown to improve accuracy for detecting lung cancer compared with CT alone (Schrevens et al 2004). Thus, recent interest has shifted to focus on potential screening applications of the combined modality PET/CT in high risk groups (Veronesi et al 2007). Currently, PET/CT is used clinically for staging (Bunyaviroch and Coleman 2006, Dooms et al 2008), monitoring treatment response (Weber 2005, Pöttgen et al 2006, Hicks 2009), and long term surveillance (Higashi et al 2003, Patz 2008), and like its CT counterpart, the clinical acceptance of routine PET screenings would require low-dose alternatives to current scanning protocols (Delbeke et al 2006, Stauss et al 2008, Alessio et al 2009, Boellaard et al 2010). However, in order to establish appropriate protocols for reducing the PET tracer dose, while at the same time producing satisfactory diagnostic images, the effects on image quality in a medical setting must first be understood.
PET is an intrinsically noisy modality, and because the reconstruction process is attempting to solve an ill-posed problem, the quality of the output images is very sensitive to the amount of acquired coincident data. In fact, the success of the iterative algorithms over their analytic predecessors is attributed to their lower sensitivity to incomplete input data (Shepp and Vardi 1982, Vardi et al 1985). Many groups have investigated the behavior of PET reconstructions at low statistics (Byrne 1998, Erlandsson et al 2000, Alessio et al 2009, Nuyts et al 2011, Walker et al 2011, Hong et al 2014, Jian et al 2015) and typically characterized image quality in terms of noise and bias. Far less work has focused on the potential clinical significance of these findings. The work presented here outlines a possible framework for objectively evaluating low-dose PET images at various true count (and noise) levels, for applications involving small lesion detection.
The methods were developed and validated with data from tuberculosis (TB) patients, to provide surrogate data for early-stage lung cancer, since the uptake levels are generally lower and the distribution patterns are more diffuse for TB, compared to advanced lung cancer. Although the mechanisms for FDG uptake are different between infectious disease and cancer, this work is not concerned with the biology behind the tracer uptake, but only the technical properties of the lesion uptake in the reconstructed images. The authors believe that this initial study is an important first step, leading to a future study including select lung cancer patients with small, faint, solitary lesions.
2. Methods
Seventeen tuberculosis patients presenting hypermetabolic lung lesions of various sizes and contrasts gave written consent for enrollment in the study, which was approved by Singapore National Healthcare Group Domain Specific Review Board. All imaging was performed on a Siemens combined PET/MR (mMR) with 2-deoxy-2-(18F) fluoro-D-glucose (FDG). The intrinsic transaxial PET spatial resolution is 4.3 mm near the center of the field of view (FOV), and the coincidence timing window is 5.9 ns (Delso et al 2011). The detector system comprises 8 rings of 56 detector blocks, each an 8 × 8 matrix of lutetium oxyorthosilicate (LSO) crystals (4 × 4 × 20 mm), coupled to an array of 3 × 3 avalanche photodiodes. The transaxial and axial PET FOVs were 59.4 and 25.8 cm, respectively, and all emission data were acquired in 3D mode. The data were organized into separate prompts and delayed sinograms. The delayed events were used to estimate the overall random coincidences, which were subtracted from the prompts to obtain the net true counts associated with the PET scan.
Every patient was scanned for 15 min with one bed position over the lungs, after a 178 ± 59 MBq FDG injection and 60 min uptake period. Resulting scans comprised an average of 142 ± 38 million true coincident events. Reduced doses were simulated by randomly discarding events in each PET list mode according to 10 predefined fractions: 5 × 10⁻¹, 2.5 × 10⁻¹, 1.25 × 10⁻¹, 6.25 × 10⁻², 3.33 × 10⁻², 1.67 × 10⁻², 5 × 10⁻³, 3.33 × 10⁻³, 1.67 × 10⁻³, and 5 × 10⁻⁴; the resulting MIP images for a single patient, labeled with the number of true counts, are shown in figure 1.
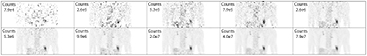
Figure 1. Example images reconstructed at 10 simulated PET doses. All images were reconstructed with OP-OSEM using 3 iterations and 21 subsets.
Download figure:
Standard image High-resolution imageTen realizations at each simulated dose were generated and reconstructed. The reconstruction algorithm was ordinary Poisson ordered subset expectation maximization (OP)-OSEM (Michel et al 1999, Comtat et al 2004), correcting for attenuation and scatter. Three iterations and 21 subsets were used to reconstruct to final image matrices of 172 × 172 × 127, with voxel sizes 4.17 × 4.17 × 2.03 mm. The image volumes were then smoothed with a 5 mm FWHM Gaussian filter.
This work investigated image performance in terms of the total number of true counts (prompts minus randoms) used for each reconstruction, and all image data were grouped into 9 categories: >40 × 106, 20–40 × 106, 10–20 × 106, 5–10 × 106, 2–5 × 10⁶, 1–2 × 10⁶, 0.5–1 × 10⁶, 0.25–0.5 × 10⁶, and <0.25 × 10⁶ true counts. Image quality was evaluated in the context of lung lesion detection. The images reconstructed from the original full statistical set, i.e. all acquired events, were used to identify 33 small, solitary lung lesions with mean volume 2.60 ± 1.92 cm3 (range 0.28–9.21) and SUV 1.45 ± 0.95 (range 0.45–4.24). Large cubic volumes of interest (41.7 × 41.7 × 40.6 mm), centered on every selected lesion, were delineated and stored, yielding 330 total lesion samples (33 lesions × 10 dose fractions). Additionally, for each patient, one cubic volume of interest including only healthy (lesion-absent) lung tissue was also stored, mitigating the need for otherwise healthy subjects. Hence, each patient contained one background and one or multiple signal sub-volumes.
The investigations in this work are separated into two distinct methods. The first included objective signal quantification; image measurements were made and quality was assessed in terms of quantification, noise, and reproducibility. The second method surveyed human observer performance; image quality was determined by the performances of a radiologist, board certified in nuclear medicine, and 3 experienced PET researchers in a lesion detection task. This scheme involving parallel and independent approaches was employed to account for quantitative and qualitative aspects of clinical utility.
2.1. Objective signal quantification
At each simulated dose, every lesion was classified by 6 parameters: lesion metabolic volume, mean lesion activity, standard deviation of activity measurement (across realizations), lesion-to-background contrast, lesion-to-background SNR, and channelized hotelling observer (CHO) SNR (Barrett et al 1993).
Masks delineating lesion VOIs were generated in the full-count images by selecting all voxels within the cubic volume with values equal to or greater than 30% of the maximum value; the voxels included in these masks defined the metabolic volume of each lesion. The lesion and background region segmentation is illustrated in figure 2. This figure shows a coronal slice containing a lesion and a separate coronal slice centered on the background region.
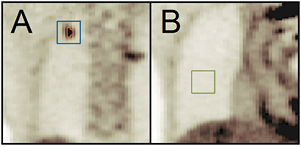
Figure 2. Zoomed-in views of coronal slices containing signal (A) and background (B) regions. Each signal region consisted of 2 segmentations: the lesion (orange), used to calculate volume and other metrics and the target cubic sub-volume (blue) used in the CHO. The background segmentation only required the cubic sub-volume (green) to calculate image metrics and for input into the CHO.
Download figure:
Standard image High-resolution imageGiven the voxel volume  and the total number of voxels
  in the lesion VOI, indexed by m, the lesion volume is defined as
For all simulated doses, the mean lesion volume of interest (VOI) activity was recorded, providing a way to assess the quantitative reproducibility of the lesion statistics. The mean of these activity measurements across 10 statistical realizations was taken as the mean lesion activity at each noise level, i.e.
where n is the realization number, N is the total number of realizations, in this case 10, and  is the lesion VOI mean in the nth realization, defined by
where  is the value of the mth lesion VOI voxel in the nth realization. The standard deviation of the mean lesion activity measurements, calculated by
was also recorded. The lesion-to-background contrast was calculated using the full-count set; this value and the lesion volume were constant across all simulated doses. It was defined using the lesion VOI mean with the cubic background VOI mean, according to the following relationship
The lesion SNR was calculated by dividing the mean lesion activity by the mean of the noise, i.e. standard deviation, in the background sub-volume realizations, defined by
where  is the number of voxels included in the background region of interest and
  is the value of the mth voxel of in the background VOI, in the nth realization.
The last parameter used to characterize the lesions reflects observer detectability. A CHO was implemented to provide a surrogate estimate of performance in a lesion detection task. For every lesion, at each dose, the target and background sub-volumes extracted from the 10 noise realizations were used to train the model and test the observer SNR. The observer model included a difference-of-Gaussian channelized filter (Myers and Barrett 1987, Abbey and Barrett 2001), and the CHO linear discriminant function  was calculated by

where  and
and  are the means of the background and target image volumes (represented as column vectors), U is a matrix with columns comprising the spatial filter channels, and S is the intraclass scatter matrix, defined as
This is the probability-weighted sum of the two channelized class covariances; n denotes the index the discrete samples in the ith class,  is the number of samples belonging to class i, and N is the total number of samples in both classes. The discriminant therefore seeks to maximize the difference in class means, while minimizing the class variances of the projected data. Here, the CHO model is similar to linear discriminant analysis (LDA), except that the magnitudes of the diagonal elements were doubled in the scatter matrix. This step simulated internal noise in the model, as indicated by the subscript
  and was performed for better agreement with human performance (Abbey and Barrett 2001). Observer SNR was calculated within the training samples themselves, providing a comparative measure of the intra-patient separability of the signals from the background region at each simulated dose, yielding the final lesion metric
Here,  and
and  are the mean and variance of the ith class data
  projected onto the CHO discriminant function, i.e.
and  is the number of samples belonging to the ith class.
Defining each lesion by the 6D point comprising its parameter values provided a simplified and convenient way to represent all lesion samples in a space spanning their morphological, physiological and distinguishable characteristics. Eigen-analysis of the total sample covariance matrix was used to whiten the data, and the lesion data were organized into categories corresponding to the count numbers of the images from which they came. For each count category, sensitivity and specificity were calculated as


where each sample point was classified as detected or not detected, according to the results of a lesion detection task outlined in the following section.
2.2. Human observer analysis
A lesion detection task was conducted to survey performance of a human observer in discriminating target from background regions. Target images included all 33 lesions at all 11 noise levels (10 fractions + 1 full statistic), and background images included the one background region in all 17 patients at 11 noise levels. This resulted in 363 target (lesion) and 187 background images, yielding a total of 550 total image samples.
Images containing either a signal or background region were randomly presented to a nuclear medicine physician and 3 senior researchers experienced with PET; the viewing module is shown in figure 3. For each image, a box was drawn around the region-of-interest (ROI), and the observers were instructed to decide if the region contained a lesion or not. The observers' decisions were ranked according to a scale representing the confidence in their choices. Prior to the task, each participant was trained with 5–10 randomly selected test images.

Figure 3. Lesion detection task designed to survey performance of an experienced image reader.
Download figure:
Standard image High-resolution imageWithin the population of sample images at each simulated dose level, the observer's responses were assumed to be normally distributed among the confidence categories. The rated decision data for the lesion present and absent classes were separated and used to weight normally distributed density functions, representing the corresponding confidence probabilities. The integral of the probability density functions (cumulative density) therefore represented the expected true and false response rates over the range of decision criteria thresholds, and ROC curves were constructed. The detection success or failure of every lesion by the observer defined a subclass to which each belonged, detectable or non-detectable.
Additionally, the results of the human observer task were also used to train an ideal linear observer (LDA) for potential automatic classification of a lesion. Two classes were defined within the lesion population; if the observer classified a lesion with 75% or greater confidence, it was considered detectable, if not, it was considered non-detectable. Similar to the approach of the CHO, the discriminant function of the ideal observer model is defined to maximize observer SNR

The reliability of this approach was evaluated using random subsets of observer decisions to train the model and to predict the remaining, unused decisions. Various fractions of training data were investigated, and 100 independent tests (realizations) were performed at each level. In this task, the binary linear model required a classification threshold, above which, the test sample was classified as detectable and below which, not detectable. For each realization, the random selection of training data produced a slightly different discriminant function, hence requiring a unique threshold for each case. The most appropriate threshold to model the physician performance was selected by projecting the entire data set onto the discriminant function and identifying the value that yielded accuracy most closely matching that of the physician. This process was repeated for every run of the prediction task. Relative detection performance and observer SNR were studied as a function of the size of the training set.
3. Results
Following the convention established in the previous section, the results are separated into two parts corresponding to the methods used. For all comparative analyses reported here, the images generated from the full count data were taken to be the 'gold standard' for determining the presence or absence of each lesion and for representing accurate image values in each region.
3.1. Objective signal quantification
Prewhitened lesion data were grouped by the number of true acquisition counts and separated into detected and non-detected subclasses. The 330 data points plotted in figure 4 represent the 6-parameter measurements of all 33 lesions at the 10 simulated doses. Lesion volume and contrast parameters were defined by the full-count images, but the other 4 parameters were calculated from the lesion realization statistics at each simulated dose. For illustration purposes, figure 4 shows 3D whitened data; the total population covariance matrix was analyzed, and the data were whitened by the 3 strongest eigenvectors, i.e. those with the largest corresponding eigenvalues.
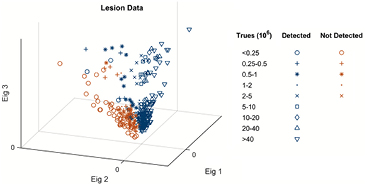
Figure 4. Prewhitened lesion data grouped by the number of true counts used to reconstruct and separated into detectable and non-detectable subclasses, as reported by the nuclear medicine physician. Scatter plot showing all 330 lesion data points whitened by the 3 strongest covariance eigenvectors.
Download figure:
Standard image High-resolution imageEach statistics class is represented by a symbol, and subclasses are represented by different colors, detected (blue) or not detected (red), as reported by the nuclear medicine physician. Two regions of the 3D subspace, corresponding to 'detectable' and 'non-detectable' lesions, are identified.
3.2. Human observer analysis
The information from the objective lesion measurements was combined with that of the observer detection experiment. For a target image, if the observer reported a lesion with at least 75% confidence, it was determined to be a true positive; otherwise it was a false negative. Similarly, for a non-target (background) image, if the observer reported no-lesion with at least 75% confidence, it was a true negative, and otherwise, a false positive. The numbers of positive and negative decisions, for every true count category, are plotted in figure 5, together with the associated sensitivities and specificities. As expected, the sensitivity and specificity increased with the number of counts in the scan. The observer results of the radiologist are reported first, followed by those of the 3 PET researchers; this order is maintained throughout the paper.
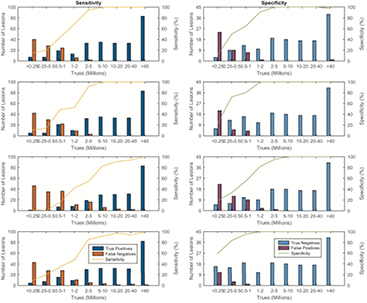
Figure 5. Sensitivities and specificities of the human observers over all categories of true counts.
Download figure:
Standard image High-resolution imageThe normally distributed probability density functions were used to produce the mean ROC curves and the respective areas under the curves (AUCs) shown in figure 6. Image quality, in terms of lesion detectability, for each count category was quantified by the area under its associated ROC curve. An AUC greater than 0.97 was reached with images of 5 million counts or larger.
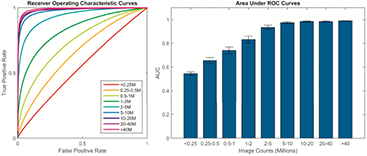
Figure 6. Mean receiver operating characteristic curves and corresponding AUCs derived from the observer detection task. For all observers, images reconstructed from 5 million or greater counts generally showed better performance and tighter grouping than the other image sets, with an AUC over 0.97.
Download figure:
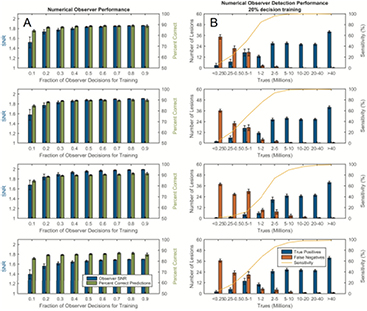
Standard image High-resolution imageThe prospect of using human observer data to train a numerical model for future automatic lesion detection tasks requires that the efficacy of the model is studied for various training levels. We investigated this for all 4 observers independently. In column A of figure 7, the observer SNR and the percentage of correctly predicted decisions is shown as a function of the size of the training set, repeated over 100 realizations. All lesions and count statistics are included, either as training or test samples. With regard to the correct number of predictions, these results suggest that the observer model was robust, with good performance achieved by using only 20% of the total human decisions for training. Column B of figure 7 shows the corresponding testing performances of the numerical models trained with randomized 20% of the decisions of the human observers. Here, the testing was performed on the remaining 80% and repeated 100 times.
Figure 7. Column (A) shows numerical observer SNR and the percentage of correct predictions relative to the observer after which it was trained for different fractions of training data. Column (B) shows the corresponding performances of the numerical observers trained with 20% of the human decisions; detections and sensitivities were calculated within the remaining population of lesions not used for the training. Means and errors are reported over 100 realizations. The numerical models demonstrated excellent potential to serve as a surrogate for human observers in a simple detection task.
Download figure:
Standard image High-resolution image
4. Discussion
Reducing the dose, or the number of counts, increases image noise and uncertainty in the SUV value and decreases detectability of small lesions. In the present work, we presented methods for evaluating lesion detectability and observer performance in images reconstructed at various count levels. We assessed image quality and lesion detectability using two general methods, one involving objective image measurements and the other involving a human observer detection task. These techniques were developed as part of a comprehensive framework, designed to investigate the lowest acceptable dose limits for PET in potential clinical applications for screening of patients at high risk for lung cancer. All reduced-dose acquisition data were simulated for each patient assuming the same scan time as that as the original data set. Thus, differences in tissue kinetics and biological washout of PET acquisitions of different lengths were not considered.
Establishment of a 'clinically acceptable PET dose' requires many considerations; reconstructed images must be quantitative, accurate and reproducible, but a reflection of clinical utility is perhaps the most essential. This can be very subjective and depends on the clinical task for which the imaging was performed, e.g. lesion detection, disease staging, longitudinal comparison, etc. Lesion detection experiments have often been employed to explore and quantify performance in a carefully controlled environment, as surrogates for routine medical tasks, and the experiment here was performed in the context of distinguishing FDG-avid lesions from healthy lung tissue. The analyses were based on the combination of various image measurements and observer performance. The population of lesions displayed a range of different physical characteristics in order to investigate the relationship between measurable parameters and their impact on detectability. Human psychophysical perspective was incorporated into the study using the results of a detection task presented to a nuclear medicine physician and 3 PET researchers.
The detection task was designed to yield extremely good performance in the original images and investigate its degradation with decreasing counts. This involved selecting a population of lesions and background regions with high confidence in the full count image set. This approach was intended to eliminate ambiguity in the 'gold standard', although it might have introduced positive detectability bias. The relatively large size and SUV of the selected lung lesions, 2.60 ± 1.92 cm3 (range 0.28–9.21) and SUV 1.45 ± 0.95 (range 0.45–4.24) reflect this. In fact, the main purpose of the study was to assess how the detectability of 'true lesions' degraded with decreasing counts. The relatively low count rates required for appreciable declines in performance, may have been related to this effect, and this is a potential limitation of this study that should be noted. Another approach would have been to select lesions and background regions with equivocal interpretations in the original images, yielding poorer overall performance. However, the former method was chosen to avoid potential errors associated with false ground truth classifications. The results of this study, therefore, characterized PET count levels at which image interpretations no longer matched those from a high-count reference standard, with well-defined lesion and normal regions.
The numerical observer employed to predict human performance based on a small subset of observer decisions was ideal for linear discrimination, i.e. equivalent to Fisher analysis under the assumption of normally distributed data with equal class covariances. In this experiment, to remove the correlations between lesion parameter measurements, the test samples were pre-whitened with eigenvectors derived from the total sample covariance. However the ideal model is insensitive to pre-whitening and yields identical observer SNR in non-whitened data, i.e. comprising the original 6 lesion measurements.
Regarding the performance of the both human and numerical observers in the lesion detection task, the lowest acceptable count statistics could be evaluated two ways, with absolute sensitivity or using the ROC analysis of the confidence-weighted decision data. In this study, we did not find a clear threshold number of counts that produced optimal performance relative to the full-count images, that is, detection performance always increased with more counts. Notwithstanding this, the groups of images with 5 million or greater counts showed performance similarities and a generally higher correlation than any other image groups; the sensitivity and ROC analysis converged to a similar conclusion, with mean sensitivity and AUC greater than 93% and 0.97, respectively. These findings suggest that 5 million counts may perhaps be the lowest number of acceptable counts, under certain conditions. However, these results are based on a limited sample of 17 TB patients in a highly constrained task and cannot be immediately generalized to other diseases, for example lung cancer. Future investigations will focus on a larger population of lung cancer lesions, with particular attention paid to small lesions, of the order of 1–2 mL.
The human observer decisions were also used to train observer models, which may lend themselves to future studies. All numerical models trained with different human observers performed similarly; here, with only 20% of the observer decisions used for training, each correctly predicted over 85% of the remaining (unused) lesions. Ideally, the combination of objective image lesion measurements and a simulated human observer model may provide an efficient and automatic platform for future investigations. We will enlist the help of other nuclear medicine radiologists to further validate the predictive capacity and reliability of our methods.
5. Conclusion
A study on TB patient data was performed in order to develop methods to assess small lesion detectability as a function of the number of counts in a PET scan for potential screening applications. Reduced doses were simulated by randomly discarding events in the PET list mode. For the given sample of 17 patients and the given TB lesion pattern, human and numerical observers, with different metrics, including sensitivity and ROC analysis, showed that count statistics as low as 5 million already offer a fairly high detectability level in the given range of lesion sizes and SUVs considered in this study.
This study did not assess the effect of reducing the PET dose for lesions which are hard to detect at typical clinical count levels, and thus the results do not apply to cancer imaging for diagnosis and staging. However, the results are applicable to screening applications, where the requirement for low radioactive dose may outweigh the demand for detecting small or low contrast lesions which are challenging even at diagnostic dose levels.
This work presents the first step in a comprehensive analysis of low dose PET image quality, and one should be cautious with the interpretation of these findings. They represent performance in a highly constrained task, which reduced the complexity of factors that are present in the clinical setting. For possible applications in lung cancer PET/CT screening of patients in high-risk categories, more work is needed to validate these methods with a large sample of early lung cancer patients.
Acknowledgments
The authors would like to acknowledge support for this study from Drs Nick Paton and James Molton. This research was partially supported by the Singapore Ministry of Health's National Medical Research Council under its CS-IRG Grant NMRC/CIRG/1322/2012 and the National University of Singapore under its Start-up Grant.