
Abstract
The purpose of this study was to test the feasibility of a patient specific phantom for patient specific dosimetric verification.
Using the head and neck region of an anthropomorphic phantom as a substitute for an actual patient, a soft-tissue equivalent model was constructed with the use of a 3D printer. Calculated and measured dose in the anthropomorphic phantom and the 3D printed phantom was compared for a parallel-opposed head and neck field geometry to establish tissue equivalence. A nine-field IMRT plan was constructed and dose verification measurements were performed for the 3D printed phantom as well as traditional standard phantoms.
The maximum difference in calculated dose was 1.8% for the parallel-opposed configuration. Passing rates of various dosimetric parameters were compared for the IMRT plan measurements; the 3D printed phantom results showed greater disagreement at superficial depths than other methods.
A custom phantom was created using a 3D printer. It was determined that the use of patient specific phantoms to perform dosimetric verification and estimate the dose in the patient is feasible. In addition, end-to-end testing on a per-patient basis was possible with the 3D printed phantom. Further refinement of the phantom construction process is needed for routine use.
Export citation and abstract BibTeX RIS
1. Introduction
Patient specific dosimetry measurements are commonly performed for complex radiation therapy modalities such as IMRT, IMAT, and even proton therapy in order to validate the treatment planning system dose calculation. In order to assess the radiation dose accuracy, tolerance metrics are applied. Typically, the treatment beams are delivered to a standard shape phantom where the dose or fluence is measured (Paliwal et al 2000, Van Esch et al 2004, Nelms and Simon 2007, Ezzell et al 2009, Zhu et al 2011). In order to expand the clinical utility of these measurements, it has been proposed to use measurements from the standard phantom and reconstruct the dose on the patient volume using complex computer models in order to estimate the 'in-vivo' dose to the patient (van Zijtveld et al 2007, Nelms et al 2012). This work approaches the solution differently; rather than to use a standard phantom with complex dose reconstruction methods, we propose to use a non-standard, patient specific phantom, with standard dosimetric measurements to estimate the 'in-vivo' dose to the patient volume. The patient specific phantom is constructed by automated additive manufacturing (or 3D printing) based on a 3D model from the treatment simulation CT scan. Thus, the verification of the dose to the patient is verified by secondary dosimeter measurements made in the patient geometry instead of complex dose reconstruction measurements or reliance on dose tolerance metrics measured in standard phantom geometries (i.e. gamma index) (Low et al 1998); it is important to note that although the goal of the quality assurance program is to verify the dose delivered to the patient matches the expected calculated dose, direct measurement in-vivo is not performed for either conventional or the proposed quality assurance methodology. The reliance on the gamma index alone in a standard phantom (i.e. cube, cylinder, etc) has been suggested to not predict clinically relevant delivery errors in the patient anatomy (Nelms et al 2011). One reason for the poor predictive power is that applying a gamma index within the patient geometry is not the same as applying the gamma index on a standard phantom because the dose distributions in the standard phantom may not even be a first order approximation of the dose within the patient. This is confounded by the fact that differences exist in the reported gamma index of various commercial dose verification systems (Hussein et al 2013).
3D printing allows the capability to construct the patient geometry (Sun and Wu 2004, Meakin et al 2004) and treatment devices (Sanghera et al 2002). This study describes the feasibility of using patient specific phantoms for dosimetry verification measurements. One advantage of the 3D printed phantom is that, after it is constructed, it can be subjected to an end-to-end test of the following procedures: CT scan acquisition, localization marking, dose calculation, registration in-room (may use the IGRT systems and indexing methods), and treatment delivery; therefore, this method provides a better end-to-end test than traditional per-patient quality control tests since it matches the clinical patient workflow.
The goals of this work are: to reconstruct a patient geometry using 3D printing that is soft tissue equivalent, to apply the phantom to an IMRT QA workflow that provides an end-to-end evaluation, and to have the phantom construction be of limited cost.
2. Methods and materials
2.1. 3D printed phantom construction
In this work, an anthropomorphic phantom with heterogeneous tissue equivalence (RANDO Phantom, The Phantom Laboratory, Salem NY) was selected as our 'patient', as it will be referred to hereafter. The reason was two-fold: to allow for dosimetric measurements that would not be possible in-vivo and to avoid patient privacy issues during feasibility testing. It is important to note that the end purpose is not to use the same anthropomorphic phantom for each patient specific dose verification measurement, but rather to fabricate the actual patient geometry in the treatment position. The treatment planning CT scan was loaded into 3D Slicer (Fedorov et al 2012) where a volumetric model was created with the 'greyscale model maker' module of the software. The model was then loaded into various open-source 3D graphics engines to separate the head and neck region of the model into 12 separate sub-sections; this allowed for two axial, one sagittal and one coronal film plane for dosimetry measurements. The planes were designed to intersect regions of interest, such as the target volume, spinal canal, and parotid glands in the treatment plan. The selection of the location and number of planes can be customized as needed. The sub-sections were then converted from 3D models into readable instructions for the robotic 3D printer.
The 3D printing was performed via Fused Deposition Modelling (Crump 1992) on the Makerbot Replicator 2x (Makerbot Industries LLC, Brooklyn, NY). Acrylonitrile butadiene styrene (ABS) was used as the build material. Due to the excessive heat needed to extrude the ABS plastic, the phantom could not be printed as a 100% solid object since deformation of the plastic as it cooled proved to be unacceptable. It was decided to print the exterior shape of the phantom and fill it with a uniform mixture of a modified M3 mix (White 1978). The M3 composition was modified from the published composition to result in a density of 1.05 g cc−1 determined from both kilo—and megavoltage CT scans; megavoltage CT scans were acquired on a Accuray Tomotherapy treatment machine operating around 3.5 MV (Accuray Inc., Sunnyvale, CA). The average time required to print one of the twelve subsections was 4 h as a shell and 24 h as a 100% solid object; this was another reason to print the external shape and fill it with a tissue equivalent material at this time.
2.2. Validation of 3D printed phantom soft-tissue equivalence
A treatment plan was created (Philips Pinnacle3, Fitchburg, WI) using a traditional lateral, parallel-opposed head and neck field technique; the dose was calculated on the 'patient' and recalculated on the 3D printed phantom; it is important to note that for the lateral parallel-opposed treatment plan the prescribed dose is 180 cGy per fraction which differs from the IMRT plan prescribed dose of 200 cGy described in section 2.3. Thermoluminescent detectors (TLD) were placed at equivalent positions in both phantoms; The TLD chips measure 3.2 × 3.2 × 0.9 mm and are composed of natural Lithium isotopic composition (TLD-100); three separate TLD measurements were collected and averaged for each of the 17 measurement locations. The locations of the TLD measurements are shown in figure 1. Similarity of the external geometry (defined at −500 HU) of 3D printed phantom and 'patient' was determined with the Jaccard Index (Jaccard 1912) and Dice Similarity Coefficient (DSC) (Dice 1945).
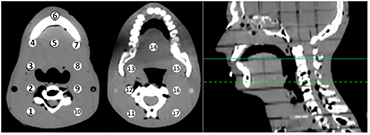
Figure 1. Locations of TLD measurement in the 'patient'. The axial slice where Regions 1–10 appear (left image) are indicated by the dashed line on the sagittal image (far right). The axial slice associated with Regions 11–17 are indicated by the solid line on the sagittal image.
Download figure:
Standard image High-resolution image2.3. Patient specific dose verification
A nine field IMRT plan was constructed on the 'patient' typical of a base-of-tongue head and neck treatment plan. Great effort was made to simulate a realistic target volume and normal structures as well as dosimetric treatment constraints. To that end, physician drawn structures from a T2N2bM0 Base-of-Tongue Cancer case were registered with the 'patient' CT and modified by hand (EE) to match the relative geometry of the 'patient'. It is important to note that the treatment couch was not included in the treatment plan calculation. For the beam energy used in the IMRT plan (6 MV), the couch attenuation is typically 1.5%–3.0% depending on many factors such as field size, gantry angle, etc. Two of the nine fields intersected the treatment couch before the 'patient'; the gantry angles were limited to 20° from normal incidence of the couch in order to limit couch attenuation. Clinical dosimetric constraints were applied during inverse planning to ensure a realistic treatment delivery configuration. The dose volume histogram and isodose distribution for the 'patient' plan is shown in supplementary figure 1 (stacks.iop.org/PMB/59/5763/mmedia). One deviation from typical planning protocol was the minimum segment field area and minimum segment MU was reduced from the clinical limits of 6 cm2 and 6 MU to 2 cm2 and 2 MU in order to induce regions of disagreement between calculated and measured dose to contrast results of a 3D printed phantom and the standard IMRT QA phantoms.
Once a clinically acceptable treatment plan was achieved, the 3D printed phantom was scanned; then the dose was recalculated on the 3D printed phantom with a 2 × 2 × 2 mm3 dose grid resolution. Calculated planar doses along the film planes were exported from the treatment planning system to an IMRT QA film analysis toolkit (Radiological Imaging Technology, Colorado Springs CO).
Radiochromic EBT2 (Ashland Inc., Covington KY) films were placed in the 3D printed phantom and irradiated with the treatment fields. Because the film planes intersected each other, the axial, coronal, and sagittal films were irradiated separately. In order to limit the uncertainty of the film results in the buildup region, the films were cut to allow the film to extend out of the 3D printed phantom approximately 5–10 mm. It was indicated by the film vendor that cutting the film can affect the film response within a few mm of the cut. In addition, when the films were scanned, the unused cut portions of the film were placed on the flatbed scanner to reconstruct a full sized film; this was done to prevent high intensity light leakage into regions of the film associated with superficial depth and for consistency in the application of film and scanner uniformity corrections.
Before each irradiation the 3D printed phantom was localized with on-board cone beam CT. The phantom position was determined to be localized within 1 mm and 1° of the reference treatment planning image before the treatment fields were delivered. A dose calibration was also established for the radiochromic film during the same measurement session. The calibrated films were imported into the IMRT QA analysis toolkit and compared with the associated planar doses from the treatment planning system (reference dose distributions). No dose scaling or spatial adjustments were performed to increase agreement between measured and calculated dose during the analysis.
An ionization chamber measurement was also performed in the 3D printed phantom using an A1SL ionization chamber (Standard Imaging Inc., Middleton WI). The location of the ionization chamber measurement was in a uniform dose region of the right neck of the 3D printed phantom.
Patient specific dose verification measurements were also performed with a planar and cylindrical phantom, MapCHECK2 and ArcCHECK (Sun Nuclear Corp, Melbourne FL) respectively. The diode arrays were calibrated to a known dose prior to measurements to allow for analysis to be performed in 'absolute dose mode'. For the planar phantom, the fields were analyzed on a field-by-field basis with all beams delivered from the 0° gantry angle (toward the floor). For the cylindrical phantom measurements, the dose was analyzed on a composite dose basis. In addition, the cylindrical phantom measurements were imported to a commercial software package (3DVH) sold by the same vendor as the cylindrical phantom. The dose to the patient was reconstructed (Nelms et al 2012) and compared with the radiochromic film results in the 3D printed phantom.
3. Results
3.1. Validation of soft-tissue equivalence
A qualitative comparison of the anthropomorphic phantom ('patient') and the 3D printed phantom is illustrated in figure 2. The Jaccard index for the external geometry was determined to be 0.956 and the Dice Similarity Coefficient was determined to be 0.973. This indicates a good match between geometries.
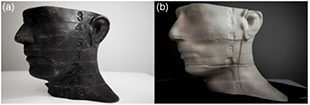
Figure 2. Qualitative comparison of (a) an anthropomorphic phantom, the 'patient' in this example, and (b) the 3D printed model. Note in (b) the coronal and axial film planes can be seen in the 3D printed phantom which can be set by the clinician. Also, the slice section numbers of the anthropomorphic phantom are preserved in the 3D printed model, which is remarkable considering the phantom was scanned with 3 mm CT slice thicknesses.
Download figure:
Standard image High-resolution imageSupplementary figure 2 (stacks.iop.org/PMB/59/5763/mmedia) shows calculated and measured doses for the 'patient' and the 3D printed phantom, respectively for the parallel-opposed treatment. The dose values are shown in cGy and the uncertainty of one standard deviation is reported. The difference between the calculated and measured dose was determined and normalized to the planned prescribed dose (180 cGy) for the lateral parallel-opposed treatment. The mean percent difference (1 SD) was 1.9% ± 2.8% in the 'patient' and −0.1% ± 4.9% in the 3D printed phantom. In addition, the largest difference in the calculated dose for the 'patient' and the 3D printed phantom was 3.2 cGy, or 1.8% of the prescribed dose.
3.2. Patient specific dose IMRT dose verification (QA)
Dose comparison results for the films placed in the 3D printed phantom are given in table 1. Table 1 presents the percent of planar dose pixels within 3% and 5% agreement (relative to the prescribed dose of 200 cGy) within the resolution of the calculated planar dose (1 × 1 mm2); results are also reported for 3% dose difference and 3 mm gamma index. It is important to note that the gamma index was only performed in two dimensions (in the film plane); in the case of the superior axial film plane, dose gradients along the superior-inferior axis exist, which can be a source of the lower passing percentage; conversely, the dose reconstruction software applied the gamma index in three dimensions.
Table 1. Dose verification results for the four film planes.
| 3 mm / 3% | 3% | 5% | |
|---|---|---|---|
| Superior Axial | 87.0% | 63.2% | 80.9% |
| Inferior Axial | 91.6% | 67.0% | 82.8% |
| Coronal | 91.8% | 73.5% | 85.7% |
| Sagittal | 94.6% | 75.0% | 90.9% |
An ionization chamber measurement was also performed in the phantom. The calculated and measured in-phantom dose was 201.0 cGy and 198.7 cGy, respectively, which is a 1.1% percent difference. The greatest difference for any one field was 3.3 cGy; 7 out of 9 fields were within 2 cGy (1%).
Standard IMRT QA measurements were also performed on a cylindrical and planar phantom (see table 2). The same dosimetric parameters are shown as in table 1. It should be noted that for the standard IMRT QA analysis, rather than using a single dose tolerance value as in the film analysis, the tolerances are based on a percent of the local expected dose. Thus for a 3% dose tolerance, two points expected to receive 50 cGy and 100 cGy would have an absolute dose tolerance of 1.5 cGy and 3.0 cGy, respectively.
Table 2. . Standard phantom IMRT dose verification measurements.
| 3 mm / 3% | 3% | 5% | |
|---|---|---|---|
| Cylindrical | 95.9% | 69.2% | 80.4% |
| Planar 1 | 92.4% | 61.3% | 69.7% |
| Planar 2 | 93.5% | 68.7% | 74.6% |
| Planar 3 | 96.2% | 67.2% | 71.8% |
| Planar 4 | 94.4% | 65.1% | 72.4% |
| Planar 5 | 96.5% | 69.4% | 75.4% |
| Planar 6 | 95.5% | 66.6% | 74.4% |
| Planar 7 | 93.7% | 63.4% | 75.0% |
| Planar 8 | 89.1% | 63.3% | 69.4% |
| Planar 9 | 93.4% | 63.5% | 70.4% |
Passing percentages for the dose reconstruction are given in table 3 for the same dosimetric parameters as tables 1 and 2. Like in the film analysis, the percent dose tolerances are normalized to the prescribed dose. Better agreement is seen in the reconstructed dose analysis than in the film data (see table 1).
Table 3. Dose verification results from reconstructed dose.
| 3 mm / 3% | 3% | 5% | |
|---|---|---|---|
| Superior Axial | 95.3% | 74.5% | 90.3% |
| Inferior Axial | 96.7% | 92.8% | 99.5% |
| Coronal | 95.7% | 89.0% | 96.1% |
| Sagittal | 96.1% | 90.8% | 97.9% |
Figure 2 shows where the passing and failing points are located on a coronal plane from the film and dose reconstruction analysis (a color version is shown in supplementary figure 3 (stacks.iop.org/PMB/59/5763/mmedia)). It can be seen in the film analysis that the dose tolerances are exceeded at superficial depths; however, this is not observed in the reconstructed dose analysis. Similar comparison for the other 3 film planes is shown in supplementary figures 2–6 (stacks.iop.org/PMB/59/5763/mmedia).

Figure 3. (a–c) Comparison of film (left) and reconstructed dose (right) for the coronal plane. The results for 3% and 5% dose difference tolerance as well as 3%/3 mm gamma index are given in (a), (b), and (c), respectively. White indicates regions of high dose and black, low dose. Regions exceeding tolerances identified with 50% greyscale (color version in supplementary figure 3 (stacks.iop.org/PMB/59/5763/mmedia)). The spatial scale, in cm, is included on the left.
Download figure:
Standard image High-resolution image
Figure 4. (a) Flow chart differentiating the workflow of standard IMRT QA and (b) a proposed workflow using 3D printed phantoms. It can be seen that many of the quality control tests currently only first performed at the first treatment set-up (right most column of figure 3(a)) can be performed earlier during dosimetric verification with the 3D printed phantom.
Download figure:
Standard image High-resolution image
4. Discussion
The proposal of constructing a patient geometry using a 3D printer is feasible in a commercial 3D printer environment. Previously, ABS has been shown to be an acceptable phantom material for dosimetric measurements (Kumar et al 2009). The main area for improvement is the time needed to construct a custom phantom. The current printer uses a 0.4 mm diameter nozzle to extrude the ABS plastic. Other FDM based 3D printers offer a larger diameter nozzle which could reduce the time needed to print a phantom; conversely, other methods of rapid prototyping are also being considered. Additionally, the printer layer height used in this work was 0.3 mm; we propose an even lower resolution would still provide acceptable quality with potential further reduction in printing time and this is a region of future work. In figure 2, it can be seen that a high level of detail is preserved in the 3D printed phantom.
The TLD measurements (see figure 1 and supplementary figure 2 (stacks.iop.org/PMB/59/5763/mmedia)) indicate that the use of ABS plastic and M3 mix resulted in acceptable soft-tissue equivalence; of the dose comparison points in figure 1, the greatest difference in calculated dose between the 'patient' and the 3D printed phantom was 1.8% (Region 11). For comparison, the deviation from the planned dose in the 3D printed phantom and the cylindrical diode array was 0.1% and − 23.1%, respectively. The dose difference of −23.1% is typical for the dose within the cylindrical diode array. In addition to Region 11, Region 4 and 17 also had differences in calculated dose greater than 1% of the prescribed dose. Regions 11 and 17 were located at the posterior field edge as indicated by the large standard deviation in calculated dose across the TLD measurement region. A point of note is that Regions 12–16 had a maximum percent difference of 0.6% with the presence of greater tissue density heterogeneities than Regions 11 and 17 (see figure 1). However, Region 4 is located at a bone-tissue interface and the greater difference in calculated doses could be due to the fact that the 3D printed phantom is made of a homogenous material. Therefore, modelling of different tissues may be beneficial, at least on a bulk density basis; at the very least, future investigation is needed. Considering a maximum difference of 1.8% between the calculated 'patient' and 3D printed phantom dose, the 3D printed phantom is sufficiently tissue equivalent for IMRT dose verification. If the 3D printed phantom is tissue equivalent to the degree that the resultant dose differences are limited to ±2% of the patient dose, then using a standard ±3% IMRT dose difference tolerance could assure a patient dose tolerance limit of ±5%; the mean absolute difference in calculated dose for Regions 1–17 was 0.7% ± 0.4%. It is important to note that air cavities in the sinuses were not sampled in Regions 1–17 and the authors acknowledge that those areas would likely have tissue equivalence differences greater than 2% if they were included in a treatment volume; the authors are actively working to include air cavities in the next version of 3D printed phantoms since air cavities can cause greater dose perturbations than bone in many cases.
It was noted that the dosimetric verification results for the standard diode IMRT QA device were normalized to the local expected dose for each detector (see table 2). The purpose was that normalizing all detector dose differences to a single value, i.e. the maximum dose, resulted in greater passing rates than both the film and reconstructed dose analyses (see supplementary figure 7 (stacks.iop.org/PMB/59/5763/mmedia)); for example, in the cylindrical phantom 99.7% of points passed the 3 mm and 3% gamma index using a global dose normalization while for the reconstructed dose, based on the same cylindrical phantom measurements, 97.5% of points throughout the whole volume passed; the film pass rates for the same gamma index ranged from 87% to 94.6% (see table 1). Local dose normalization for the diode array measurements resulted in pass rates consistent with the film and dose reconstruction data while the global normalization provided passing rates that, at least in this case, are not indicative of the actual results; it is important to note that the film and dose reconstruction data use global normalization. The reason global normalization was used for the films was the film analysis software only provided global normalization capability; while the vendor was able to provide a work-around, the authors decided it would be prudent to utilize clinically assessable features. Since the films utilized global normalization, the dose reconstruction data was also analyzed with global normalization. For both cases the global normalization dose was the prescribed dose.
The algorithm used to reconstruct the dose utilizes the beam model within the treatment planning system; therefore good agreement between the modelled and actual treatment beam characteristics is important. If the beam model is incorrect due to beam modelling or machine degradation, this discrepancy will persist in the dose reconstruction. In figure 3, it is apparent that discrepancy exists between the measured EBT2 gafchromic film results and the dose reconstruction analysis near the phantom surface, also referred to as superficial depth. This could be due to a difference between the beam model and the actual beam at superficial depths; it is important to note that the cylindrical diode array detector depth is 3.3 cm tissue equivalent depth, and therefore much of the reconstructed dose in superficial regions could be reliant on the beam model rather than measured data. The dose at superficial depths can also be affected when treatment beams intersect the treatment couch, as in this case, and/or treatment frames and accessories; this can affect the accuracy of the calculated dose at superficial depths. In either case, direct measurement in a patient specific phantom can provide better capability to observe these dose discrepancies as they would exist in the patient.
In all cases, no dose scaling or positional corrections were allowed within any of the analysis toolkits. For the 3D printed phantom, the same localization techniques used to align a patient can be used to align the phantom. Thus if patient indexing methods are used, the 3D printed phantom provides a measure of the image guidance accuracy at the couch coordinates to be used for the actual patient treatment. In addition, the same staff that will be performing the IGRT registrations could also perform the 3D printed phantom IMRT QA registration to test user proficiency; this purpose alone could be an important reason to develop a 3D printed phantom with accurate tissue heterogeneities. Therefore, the measurements with the 3D printed phantom also assesses the impact of patient localization accuracy and provides and end-to-end test of the dose accuracy over multiple components of patient treatment. This is illustrated in figure 4. Figure 4 highlights the differences in standard IMRT QA workflow and a proposed workflow using 3D printed phantoms. Not only can the IGRT accuracy under the patient treatment parameters now be included in the IMRT QA, but things usually reserved for the first treatment day can be included, such as couch/gantry collision checks. Also, all treatment accessories can be included in the measurement sessions which could identify potential documentation errors from the simulation, such as wrong indexing coordinates.
The cost to produce the 3D printed phantom was less than $200 USD. The ABS plastic cost was under $50 USD. The M3 material was the remainder of the cost; however the M3 material can be reused because the melting temperature of the M3 is about 50 °C, which is far below the ABS melting temperature. Therefore, the current method of phantom construction can be quite economical compared to custom designed phantoms fabricated by most radiotherapy vendors. This has applicability to clinical and research aspects of radiation physics since the cost of fabrication of a custom soft-tissue equivalent device can be reduced.
Future work will consider creating heterogeneous density phantoms that can provide bulk density matches of bone and lung tissues as well as soft tissue. Also, reduced fabrication time is needed by either refining FDM methods or use of another rapid prototyping modality. Finally, a software environment to streamline the customization of the patient geometry to include detectors (i.e. ionization chambers, films, TLD, etc) is needed. The software environment could also remove objects from the CT scan such as immobilization masks, bolus, etc in order to use the actual patient devices in the IMRT QA measurements. Future work may explore other methods of constructing the 3D model, such as camera based methods. In this work we were able to remove a standard headrest from the 3D model.
5. Conclusion
Using an anthropomorphic phantom as a 'patient', a soft-tissue equivalent phantom was constructed using a 3D printer. Comparison of dosimetric calculations and measurement in the anthropomorphic phantom and the 3D printed phantom showed that the 3D printed phantom had acceptable soft tissue equivalence. It has been shown that creating patient specific phantoms via rapid prototyping is feasible. In this case IMRT was the treatment modality tested; however dose verification of other treatment modalities, such as IMAT, IMPT, etc, such as IMAT, IMPT, etc, is feasible as well. Considering the ability to perform end-to-end assessment of the treatment quality (including image guidance localization accuracy and the effects of the treatment couch and patient immobilization devices on the radiation deposition) and the freedom to place a variety of radiation detectors in any location/orientation in the phantom, the use of patient specific phantoms for dosimetric verification (i.e. IMRT QA) has potential advantages over traditional verification methods. Future work will investigate the implementation of patient specific 3D printed phantoms into clinical workflow as well as creating phantoms that are tissue equivalent for various tissue types, including bone and lung.
Acknowledgements
The authors would like to thank Vee Vang for the photograph used in figure 2 and for the permission to use it.
Conflicts of interest
The authors have no conflicts of interest to report.
Supplementary figure 1. (687 KB, tif) Supplementary figure 1.
Supplementary figure 2. (66 KB, tif) Supplementary figure 2.
Supplementary figure 3. (525 KB, tif) Supplementary figure 3.
Supplementary figure 4. (430 KB, tif) Supplementary figure 4.
Supplementary figure 5. (395 KB, tif) Supplementary figure 5.
Supplementary figure 6. (304 KB, tif) Supplementary figure 6.
Supplementary figure 7. (43 KB, tif) Supplementary figure 7.