
Abstract
High dose gradients are inherent to ion beam therapy. This results in high sensitivity to discrepancies between planned and delivered dose distributions. Therefore an accurate knowledge of the ion stopping power of the traversed tissue is critical. One proposed method to ensure high quality dose deposition is to measure the stopping power by ion radiography. Although the idea of imaging with highly energetic ions is more than forty years old, there is a lack of simple detectors suitable for this purpose. In this study the performance of an amorphous silicon flat-panel detector, originally designed for photon imaging, was investigated for quantitative carbon ion radiography and tomography. The flat-panel detector was exploited to measure the water equivalent thickness (WET) and water equivalent path length (WEPL) of a phantom at the Heidelberg Ion–Beam Therapy Center (HIT). To do so, the ambiguous correlation of detector signal to particle energy was overcome by active or passive variation of carbon ion beam energy and measurement of the signal-to-beam energy correlation. The active method enables one to determine the WET of the imaged object with an uncertainty of 0.5 mm WET. For tomographic WEPL measurements the passive method was exploited resulting in an accuracy of 0.01 WEPL. The developed imaging technique presents a method to measure the two-dimensional maps of WET and WEPL of phantoms with a simple and commercially available detector. High spatial resolution of 0.8 × 0.8 mm2 is given by the detector design. In the future this powerful tool will be used to evaluate the performance of the treatment planning algorithm by studying WET uncertainties.
Export citation and abstract BibTeX RIS
General scientific summary In ion beam therapy due to high dose gradients, accurate knowledge of the ion stopping power of the traversed tissue is critical. One proposed method to measure the ion stopping power is by ion radiography. In this study the performance of an amorphous silicon flat-panel detector was investigated for quantitative carbon ion radiography and tomography. The water equivalent thickness (WET) and water equivalent path length (WEPL) of a phantom at the Heidelberg Ion–Beam Therapy Center (HIT) were measured. To do so, the ambiguous correlation of detector signal to particle energy was overcome by active or passive variation of carbon ion beam energy and measurement of the signal-to-beam energy correlation. The active method enables to determine the WET of the imaged object with an uncertainty of 0.5 mm WET. For tomographic WEPL measurements the passive method was exploited resulting in an accuracy of 0.01 WEPL.
For more information on this article, see medicalphysicsweb.org
1. Introduction
The use of heavy ion beams in radiotherapy offers a potential for improving the sparing of healthy tissue from irradiation in comparison to conventional photon radiotherapy. This is due to the characteristic dose deposition of ions in matter described by the so-called Bragg curve, showing maximum dose deposition at the end of ion path. Highly conformal dose deposition to the target with a characteristic narrow dose penumbra can be achieved in contrast to photon irradiation. Accurate prediction of the position of the Bragg peak is crucial as it has a direct influence on the quality of the delivered dose distribution and thus on the treatment's outcome.
Presently, x-ray computed tomography (CT) images are used to extract quantitative anatomical data for the calculation of the ion dose distribution for heavy ion treatment planning. The CT gray values (Hounsfield values) are converted into water equivalent path length (WEPL) with an empirically derived function (Schneider et al 1996). This clinically used procedure exhibits uncertainties on calculation of an ion's range of 2–3% (Jäkel et al 2001). Further uncertainties can be introduced by the presence of metal implants (Jäkel 2007) and changes in CT protocols (Engelke 2009).
In order to detect and quantify these uncertainties and to assure complete dose coverage of the target volume, there is a need to verify the particle range and detect range variations (Schneider and Pedroni 1995). This can be done by measurement of the water equivalent thickness (WET), which is given by the integrated WEPL values along the beam path:

which is the thickness of a water body dwater that has the same effect on the particle range as the object (with thickness dobject).
In good approximation the WEPL of a certain medium is given by:

with ρe the electron density of a given material, mec2 the electron rest energy and I the ionization potential of a given material. For materials like tissue the mean ionization energies are comparable to water (Imedium ≈ Iwater). Further it was shown, that the relative stopping power to water  is, to a good approximation, a constant which is independent of the nature of the charged particle and dependent primarily on the electron density (Pirruciello and Tobias 1980). This approximation is valid over the particle energy range of 10–1000 MeV u−1 (Köhler et al 1965). This was confirmed by measurements of the WEPL value of muscle slabs, which showed an independence for carbon ions of energies greater then 50 MeV u−1 (Jacob 1997). Thus, equation 2 can be written in the following form:

The performance of the treatment planning algorithm can be tested conducting WET measurements of realistic phantoms. Presently at HIT, the only implemented device to measure WET distribution of phantoms or the WEPL of a homogeneous material is the peakfinder water column (Karger et al 2010). The object of interest is placed in front of the peakfinder and irradiated with a constant energy. The signal of an ionization chamber is measured depending on the water column length placed in front of it. The shift of the measured signal curve relative to a reference signal curve measured in water equals the WET of the object of interest. For homogenous materials with given thickness this method can be used to calculate the WEPL of the material. This enables the measurement of a high precision Bragg peak position, but the system lacks lateral spatial resolution. It's use is dependent on the beam spot size with a FWHM of at minimum 4 mm. However, high quality verification of the treatment planning algorithm requires much higher spatial resolution. Further, WEPL values of single homogenous materials only can be measured. This does not include any spatial information about the inner structure of the materials or material compositions as faced in the patient.
Our proposed method is to directly measure the two-dimensional projection of WET distributions with a flat-panel detector and ion radiography. This can be used to develop sectional WEPL measurements by tomographic imaging.
In ion radiography, an image is formed either measuring the energy loss of the particles or the residual range of the ions in a detection system behind the imaged object. Imaging with ions was at first carried out in the early 70s (Tobias et al 1977), exploiting the steep rise of the Bragg peak for high contrast imaging. These experimental ion radiographs have been shown to provide image contrast superior to that of x-ray imaging at comparable doses (Sommer et al 1978). However, the technology, both for accelerators and software has improved. The accelerators have become efficient. Thus, it is worthwhile to study these topics in a new perspective. Recent approaches to perform ion radiography and ion CT include rather complex and expensive detector designs based on silicon strip detectors (Sadrozinski et al 2003), plastic scintillators in combination with a photomultiplier tube (Ohno et al 2004), scintillating screens viewed by CCD cameras (Muraishi et al 2009), scintillator slabs in combination with a position-sensitive detector (Amaldi et al 2011) and parallel-plate ionization chamber stacks together with multi-wire proportional chambers for beam position information (Rinaldi 2012).
In this study we investigated the suitability of an amorphous silicon flat-panel detector for carbon ion radiography and tomography. Since late in the 90s, flat-panel detectors are commercially available and routinely used in clinical operations for photon imaging. Their compact size and low weight makes them easy to handle. They have been characterized extensively in regard to their behavior in photon beams (Antonuk 2002). However, these detectors have not yet been investigated for radiographic and tomographic imaging with ion beams.
2. Materials and methods
2.1. Irradiation facility
All measurements have been carried out at the Heidelberg Ion–Beam Therapy Center (HIT) in Heidelberg, Germany. The hospital-based ion facility was built in 2005 and started its clinical operation in November 2009. The synchrotron installed at HIT is designed to accelerate charged particles ranging from protons up to oxygen ions. Due to the reduced lateral scattering of carbon ions over protons, this study investigated solely carbon ions for radiographic and tomographic imaging. From the synchrotron the ions are extracted in 'bunches' which are called spills. Each extraction spill with a maximum duration of 5 sec is followed by a break of roughly the same length used for acceleration of new particles. Particle ranges in water from 20–300 mm are provided in 255 energy steps with a step width corresponding to 1 mm range in water for medium energies and 1.5 mm for high energies (Parodi et al 2012). For carbon ions these energy intervals correspond to energies of 89–430 MeV u−1 (Haberer et al 2004). Another distinctive feature of the facility is the beam delivery system. It allows conformal irradiation of the target volume by deflecting the beam laterally and vertically by perpendicular magnets. Depending on the particle type and energy, the pencil beam has a FWHM of 4–20 mm. It's lateral profile is approximately normally distributed in fluence and energy.
The features of the beam delivery system that are most important for particle radiography are the available energies, the energy spread and the angular divergence. The energies available at the HIT facility are sufficiently high to image structures with a WET of up to 30 cm. To reach high resolution in the radiographic images it is beneficial to have a beam with small energy spread after the particles emerge from the beamline. The momentum in a single pulse at HIT is normally distributed with a momentum uncertainty dp/p of 0.1% (FWHM) (Gross and Pavlovic 1998). The beams extracted from accelerators show, in addition to energy spread, angular convergence or divergence. It is desirable to minimize these non-uniformities of the particle beam. At the HIT accelerator, the optics are chosen to have dispersion and its derivative close to zero at the isocenter. In order to have "quasi-parallel" beam scanning, the scanner magnets are located at a distance of about 7 m upstream from the isocenter (Lazarev et al 2011).
2.2. Flat-panel detector
The flat-panel detector investigated in this work is an indirect detection device, RID 256-L from PerkinElmer Optoelectronics GmbH & Co. KG (Wiesbaden, Germany). It is designed for kilo- and megavoltage x-ray portal imaging. The detector has an active area consisting of a pixel matrix with a pixel size of 800×800 µm2. The scintillator consists of a Lanex fast back phosphor screen bonded to an amorphous silicon layer deposited on a glass substrate. The detector was extensively characterized in photon beams by Partridge et al (2002). First measurements with the detector in ion beams have already been performed by Martis˘íková et al (2010). They showed excellent signal linearity of the integrated signal as a function of beam intensity as long as the dynamic range was not exceeded by the signal. Further, no dose rate effects of the signal were observed. So far radiation damage of the RID 256-L due to ion irradiation has not been observed. The response was found to be stable within ±0.1 % (Martis˘íková et al 2010).
The measured signal in a particular pixel of the flat-panel detector is depending on the energy loss of the particles and thus their energy and type, and the particle fluence rate. Single particle energy depositions cannot be calculated unambiguously from the measured signal.
A detector image is formed by integrating the signal over the time of the lateral scanning irradiation procedure. In the end, the detector response has to be corrected for differences in sensitivity between the pixels of the detector as well as offset drifts of single pixels. To do so, a specific correction routine was implemented (Hartmann et al 2012). Image offset correction is carried out with active dark images using the irradiation free time between single spills of the Heidelberg synchrotron. Dark image, amplifier specific offset shifts, pixel specific short-term response changes and image lag are accounted for in this complex correction routine. Further, the sensitivity of the pixels are corrected with a sensitivity map acquired in homogeneous photon irradiation.
2.3. WET measurement technique
The WET distribution of an object is measured by detection of the residual energy or residual range of the particles behind the object of interest. The flat-panel detector measures the energy loss of the particles in the active detector layer only. This does not allow to detect the residual energy of the particles. Other detection systems currently investigated for proton and heavy ion imaging (Zygmanski et al 2000, Murashi et al 2007) face the same difficulty. They use passive energy modulation via a range shifter to correlate the signal to energy. The highest detected signal corresponds to an initial beam energy at which the ion's range in water is equal to the WET of the object. In this work in addition to a passive version, the active energy variation of the accelerator was exploited as described in the next section.
2.3.1. Active energy variation
In order to overcome the ambiguous correlation of detector signal to particle energy, a special ion range measurement technique called energy scanning was developed. High energies are used to irradiate through the imaging object, at the back the flat-panel detector is positioned to measure the energy loss of the particles in the active detector layer. Particle energy of the HIT accelerator can be adjusted with high precision in steps of 1 mm WET for medium energies and 1.5 mm WET for high energies. The object is irradiated with a number of rectangular monoenergetic fields with different carbon ion beam energies. This procedure is called energy scanning. This method allows to correlate the measured signal S with the initial beam energy Einit. For each pixel of the detector a dependence of the signal on the initial beam energy is measured, for example see figure 4. The WET of the object is then given by the water equivalent range for the energy at which the maximum signal Smax is detected. This energy corresponds to an energy Einit, max at which the particles reach the end of range in the detector.
In order to measure absolute WET of the object, the WET of the flat-panel itself has to be taken into account. It was estimated by measuring a response curve in depth of poly methyl methacrylate (PMMA) (protons, E = 132 MeV) with the flat-panel and comparison of the measured curve to depth-dose data from the HIT base-data (Martis˘íková 2011). The shift of the simulated depth-dose curve to match the measurement determines the WET of the flat-panel. The WET of the flat-panel detector WETFlat-panel was found to be about 2.3 mm (Martis˘íková 2011) for all applied energies and is assumed to be valid also for carbon ion beams. The final WETObject is then given by

2.3.2. Passive energy variation
Passive energy variation was used in combination with the flat-panel detector for the tomographic experiment solely. Therefore, the WET energy scan measurement technique was slightly modified to accelerate the process. The necessary energy scanning process for the WET measurement was reduced to one single energy by taking advantage of the phantom symmetry and adjustment of the setup. A static 19.57° PMMA wedge was placed infront of the detector to vary the energy along the vertical axis of the phantom. The advantage of this modified setup lies in the fact, that only one energy is needed for irradiation which saves the time consuming energy changes of the accelerator. However, this method can only be applied if the object is symmetric. Further details are described in section 3.2.
3. Experiments
3.1. WET measurement
In order to validate the proposed energy scanning technique, the profile of a WET distribution of a cylindrical PMMA phantom equipped with tissue equivalent inserts (Gammex) has been measured (see figure 1). This has the advantage, that the exact geometry and the WEPL of the used materials are known (Jäkel et al 2001). The accuracy of the proposed technique is investigated by comparison of the calculated WET values to values measured by the energy scanning method employing the flat-panel detector. Figure 2 shows a drawing of the radiographed phantom (a) and a profile of the calculated WET values (b). The obtained WET profile is evaluated indicated by the green box in figure 2(b). The setup has been irradiated with carbon ion beams of energies ranging from 244 MeV u−1 to 355 MeV u−1 and a FWHM of 10 mm at three spot positions with a 10 mm spacing as shown in figure 2(a).

Figure 1. Schematic drawing of the applied method. The detector is placed directly behind the imaging object and irradiated with ions of several energies.
Download figure:
Standard image
Figure 2. Ion range measurements of the PMMA phantom. Illustration of the investigated area. (a) Schematic drawing of the phantom setup viewed from the top. Arrows indicate area of interest and irradiation direction. (b) WET values calculated from the known geometry and material. The evaluated WET profile along the phantom is shown. The green box marks the area of interest.
Download figure:
Standard image3.2. WEPL measurement
As an extension of the proposed WET measurement technique, the feasibility of carbon ion CT with the flat-panel detector was investigated. Carbon ion CT directly measures the WEPL values of an object by sectional imaging. A carbon ion CT was acquired of the cylindrical PMMA phantom assembled with nine tissue equivalent Gammex rods, see figure 3(a). The WET distributions were measured with passive energy variation by a static PMMA wedge. Therefore, the phantom was placed in a 170×170 mm2 PMMA block with a 19.57° PMMA wedge ajar as seen in figure 3(b). The block is used to simplify the geometry and thus minimize the energies needed to measure the WET. Further, the static wedge allows to continuously vary the WET over the phantom. The setup was irradiated with carbon ions of 341 MeV u−1 and a fluence of 5.55× 10⁴ particles mm−2 for each angle. Inside the PMMA cube rotation of the cylindrical phantom was automatically performed in steps of 2.25° over 180° with a step motor. The single images were evaluated in terms of WET value and than reconstructed with a conventional Ram–Lak filtered backprojection algorithm to obtain a sectional WEPL images.

Figure 3. Schematic drawing of the irradiation setup for the carbon ion CT. (a) The cylindrical PMMA phantom was equipped with the Gammex inserts in the following arrangement. The direction of irradiation is indicated by the red arrow. Inside the PMMA cube rotation of the cylindrical phantom was automatically performed. (b) Schematic drawing of the measurement setup used for tomographic imaging with the flat-panel detector. The PMMA head phantom is placed in a cubic PMMA block to accelerate image acquisition. A static PMMA wedge (right side) is used to vary the energy in y-direction. A geometrical reference for calculation of the wedge thickness at any point in y direction is given by yref, the location of a small air gap between the bottom side of the wedge and the table.
Download figure:
Standard image4. Results
4.1. WET measurement
For validation of the energy scan method the WET distribution of a cylindrical PMMA phantom was measured. The signal as a function of the applied beam energy was obtained for each detector pixel. An example of such a curve is shown in figure 4. The obtained peak position corresponds to a certain initial beam energy Einit, max. It is translated into its corresponding water equivalent range (WET). The measured WET values are then given by the subtraction of the WETFlat-panel. They agree well with the expectation from the calculation (see figure 5(a)). The measured WET resolution is limited by the energy steps available from the accelerator. Due to the very different measured peak shapes it is not possible to fit for example a learning base-data set to the obtained signal curve to increase WET resolution. However, a possible way to increased WET resolution is by linear interpolation of the energy-signal curve and evaluation of S80 at which the signal amounts to 80% of the peak value at the steep descending flank of the peak, see figure 4. This idea is based on the fact that the descending flank is very steep and similar for all signal-energy curves. The WET80 value obtained at 80% of the signal increases WET resolution as seen in figure 5(b). However, the measured values are slightly lower than the calculated values. This underestimation can be quantified by investigation of the energy-signal correlation. When passing through matter, an ion experiences deflection caused by the Coulomb field of the nucleus. Neglecting multiple Coulomb scattering in homogeneous material, initial beam energy variation only shifts the Bragg peak in depth while preserving the peak shape. Therefore, the shift between the Smax and S80 value is nearly constant and can be used as a correction factor. Figure 5(b) shows the corrected WET80 values. They agree very well with the calculation. The standard deviations between the calculated and measured WET values are given in figure 6 indicated by the dashed lines. With the interpolation method the standard deviation decreases from 0.61 mm WET to 0.22 mm WET. However in the case of more complex imaging objects, the Bragg peak degrades due to multiple Coulomb scattering at material interfaces (Urie et al 1986). This Bragg peak degradation leads to an increased peak width; see figure 7. As a result the S80 is shifted here towards higher energy values. Correspondingly, the initial beam energy Einit, 80 is shifted to higher energies, which corresponds to smaller WET80 values. The effect of Bragg peak degradation is strongly correlated to the local inhomogeneity of the imaged object. For the WET measurement of our cylindrical PMMA phantom, minor Bragg peak degradation due to particle scattering and partial volume effect can explain the slight underestimation of measured WET value at the location of around 13 mm, indicated by the red arrow in figure 6.

Figure 4. Experimental WET evaluation. For each detector pixel a energy-signal curve is measured. The penetrated WET corresponds to the peak position  . The nominal resolution can be increased by evaluation of
  .
.
Download figure:
Standard image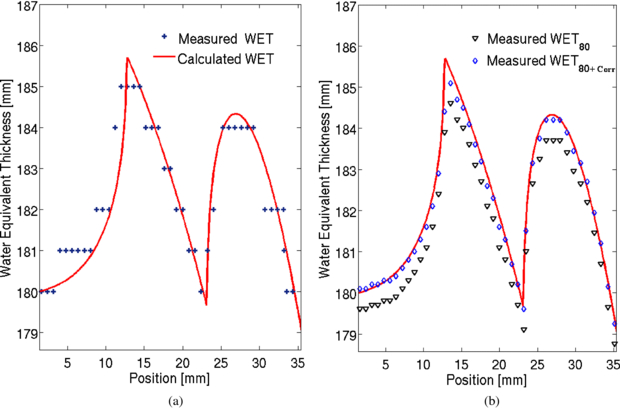
Figure 5. Comparison of the calculated and measured WET values. (a) Measured WET obtained at Smax. (b) Measured WET obtained at S80. A correction shift is applied to the measured WET values to agree well with the expected calculated WET distribution.
Download figure:
Standard image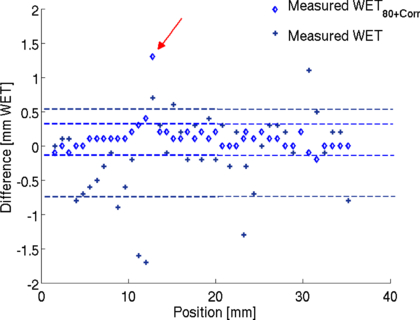
Figure 6. Difference between calculated and measured WET values. Lines indicate one standard deviation. Larger deviation occurs at a position of around 13 mm indicated by the red arrow.
Download figure:
Standard image
Figure 7. Comparison of two characteristic signal-energy curves detected with the flat-panel detector. At a location of about 13 mm Bragg peak degradation and partial volume effects broaden the peak. This leads to an underestimation of the WET value.
Download figure:
Standard image4.2. WEPL measurement
Carbon ion CT would in principle allow one to measure distributions of the WEPL of complex imaging objects. In analogy with an x-ray CT, this is done by measuring the WET of the imaging object for many rotation angles, representing single projections. The reconstructed image should yield information about three-dimensional WEPL distribution also for objects where the standard method of x-ray CT transformation tends to be inaccurate.
The cylindrical PMMA phantom equipped with tissue equivalent inserts was radiographed for tomographic imaging with the flat-panel detector. In contrast to the energy scan method for tomographic imaging the setup was modified to accelerate the imaging process. In this modification the phantom symmetry was exploited by embedding the cylindrical phantom in a PMMA cube and placing a static PMMA wedge in front of the detector. This wedge was used to passively modulate the given carbon ion beam energy across the phantom, replacing the energy scanning from the accelerator. Therefore with this setup, a field of x × y (cm2) was irradiated with only one primary energy to measure the WET distribution for each angle. Tomographic imaging was carried out by rotation of the cylindrical head phantom in the reference system of the PMMA cube and wedge (figure 3). Each measured projection (example shown in figure 8(a)) represents in y direction the measured wedge-modulated signal to energy curve for a given position x. The wedge thickness increases from top to bottom forming the characteristic signal curves which were used as replacement for the signal-to-energy curves measured in the previous WET experiments (figure 8(b)). The WET value is given by the position of the maximum signal Smax. The position is calculated by the distance in y direction to the reference position yref (air gap) with known wedge thickness dwedge. To increase the WET resolution, which is given by the slope of the wedge (19.57°), the steep fall-off of the peak dominated by the wedge geometry is used to determine the peak position at 80 % of the peak height.

Figure 8. (a) Flat-panel signal image of the phantom setup for one projection. The signal distribution along the y-axis can be calculated into a WET value. (b) Profiles along the white dashed lines of figure 8(a). The signal peak position is given by y80 at 80 % of the peak height. A geometrical reference for calculation of the wedge thickness at y80 is given by yref, the location of an air gap in the phantom setup.
Download figure:
Standard imageThe measured WET for a certain position in x is then given by:

with WET(Einit) being the water equivalent range of the particles of initial energy Einit, WEPLPMMA the WEPL of PMMA, and 0.8 the conversion factor from the detector pixel size to mm.
The resulting WET distribution for the measurement at 0° is shown in blue in figure 9. Further, the known geometry of the PMMA cube with a side length of dblock and a cutout the size of the cylindrical phantom dcylinder(x) allows to recalculate the WET distribution of the cylindrical PMMA phantom:

The final WET distribution WETcorr(x) with the characteristic steep gradient on the left and right side, which is due to the shape of the cylindrical object, is indicated in red in figure 9.

Figure 9. (a) Measured WET distribution in blue and the geometrical corrected distribution in red. (b) Final sinogram of the measured data.
Download figure:
Standard imageThe setup was imaged for 80 angles in steps of 2.25° over 180°. Calculation of the WETcorr distribution for each rotation angle forms the columns of the sinogram (figure 9(b)). It is used as an input parameter for the filtered back-projection algorithm.
Figure 10 shows the resulting reconstructed WEPL image of the cylindrical PMMA head phantom (a) and the known insert WEPL values (Jäkelet al 2001) in known phantom geometry (b). The overall reconstructed phantom shape with the inserts is in excellent agreement with the given geometry. Due to the reconstruction with a limited number of angles, streaking artifacts can be seen. To some extent image quality could be improved by filtering of raw image data. The quantitatively measured WEPL values were analyzed by averaging the WEPL values of the tissue equivalent inserts over an area of 1.6 cm in diameter. The measured WEPL values from the reconstructed image were plotted against the known WEPL values as shown in figure 11. The obtained data was linearly fitted (red) and shows in comparison to the expected values (black line) a systematic shift in WEPL of −0.007. The measured WEPL values seem to be lower than the known WEPL values.

Figure 10. (a) Reconstructed WEPL image of the phantom. (b) Expected WEPL image calculated from the known material and geometry.
Download figure:
Standard image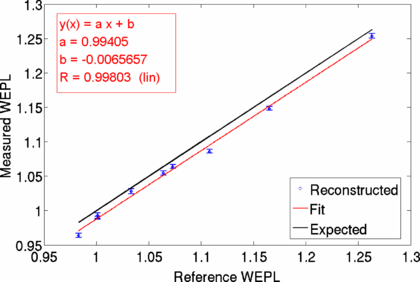
Figure 11. The WEPL values of the tissue equivalent inserts have been evaluated by calculating the mean and the standard deviation of ROIs placed over the inserts in the WEPL image. The reconstructed WEPL values are plotted against the expected reference values and are linearly fitted with the figure of merit given by the Pearson's correlation coefficient R.
Download figure:
Standard imageThe Ram–Lak filter used in the back projection algorithm is designed to cut-off high frequencies above a set threshold. This filtering process can lead to decreased values in the position space. To account for this, scaling of the obtained data is necessary. In x-ray CT imaging this is performed by applying a linear transformation called Hounsfield scale. Here, for the reconstruction in carbon ion CT, a scaling factor was obtained by comparison of the measured WET values of a single projection with the WET values obtained from the reconstructed image. In figure 12(a) the measured WET distribution for one projection is compared to the calculation from the reconstructed image. Clearly the noise originating from the reconstruction process can be seen. The reconstructed image underestimates the measured values. By multiplication with an estimated correction factor, both distributions agree well. This correction factor was found to be valid for all measured projections and WET distributions. Applying this correction factor to the obtained reconstructed WEPL values (figure 12(b)), the reconstructed and expected WEPL values agree within one standard deviation.
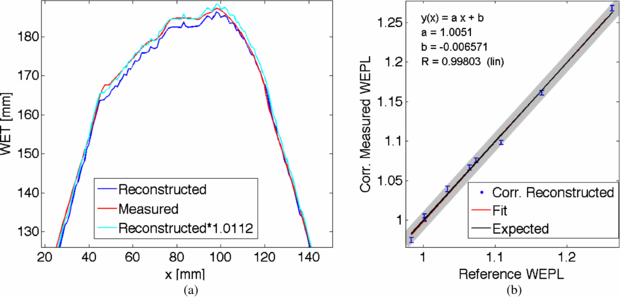
Figure 12. (a) Exemplarily for one projection angle, the measured and reconstructed WET values are plotted. The reconstruction underestimates the WET values by a factor of about 1.0112. (b) The correction factor was used to scale the reconstructed WEPL values. The corrected reconstructed WEPL values were fitted (red). The fit lies on top of the expected values (black). The gray band indicates the standard deviation of the reference WEPL values.
Download figure:
Standard imageThe resolution of the reconstructed WEPL image is given by the standard deviation of the WEPL values shown in figure 12 (vertical bars). The resolvable difference in the WEPL image corresponds to twice the standard deviation given by the fit. The WEPL resolution in the reconstructed carbon ion CT image is better than 0.01 WEPL.
5. Summary and conclusions
A new measurement technique was developed to measure WET values with a flat-panel detector by active energy variation of the accelerator. A PMMA phantom equipped with Gammex inserts was used to validate the method by comparison of the measured to the known WET values. It has been shown that the flat-panel detector is capable to measure the WET of objects using the energy-scanning method with carbon ion beams. Other commercially available flat-panel detectors are expected to behave similar as long as no signal overflow occurs. However, varying behavior in ion beams can not be excluded if the detectors components differ. For the investigated flat-panel detector an accuracy better than 0.5 mm WET was achieved neglecting Bragg peak degradation. The high spatial resolution of the technique is given by the pixelsize of the detector of 0.8×0.8 mm2. It allows two-dimensional resolution of WET in the detector plane. For the experiment minor dose optimization was carried out, resulting in a dose of 10 mGy per energy for an exceptable signal-to-noise-ratio. In the future the dose could be optimized using a range shifter in between the imaging object and the detector, shifting the Bragg peak area and high ionization density respectively downstream away from the imaging object. Further, dose reduction is possible by preselection of ion beam energies based on the information given in the x-ray CT image.
The WET measurement technique with the flat-panel detector was further investigated for sectional tomographic WEPL imaging. The energy scanning technique was slightly modified, so that a PMMA wedge yielded passive energy variation instead of active beam energy variation. This leads to an increased resolution with an energy step size of about 0.3 mm WET. The cylindrical PMMA phantom with Gammex inserts was measured for 80 angles and reconstructed using a filtered backprojection algorithm. The WEPL resolution in the reconstructed carbon ion CT image showed an accuracy better than 0.01 WEPL. The applied dose was not optimized and summed up to in total 8 Gy.
The investigated technique to measure WET and WEPL values with the flat-panel detector can be employed as a powerful tool to investigate the uncertainties of the treatment planning algorithm for complex patient like phantoms. With regard to conventionally available techniques at HIT, it offers good WET and WEPL resolution with high spatial resolution for a therapeutic relevant area of 20×20 cm2.
As a next step, we plan to investigate an anthropomorphic phantom. This would allow to quantify the quality of the used planning algorithm for patient like cases and might detect occurring discrepancies.
With respect to patient imaging the dose needs to be further reduced. This could be done by using a detector with higher efficiency like a crystalline-Si pixel detector (Seco and Depauw 2011, Sokup et al 2011).
Acknowledgments
The authors would like to thank the Heidelberg Ion–Beam Therapy Center (HIT) at the Heidelberg University Hospital for providing the beam time. JT was funded by the Virtual Institute Heavy Ion Therapy of the Helmholtz Association of German Research Centres under the contract number VH-VI-303. MM has received funding from the Deutsche Forschungsgemeinschaft (German Research Foundation), contract number MA4437/1-2.