
Export citation and abstract BibTeX RIS
Premise
The evolution of state of the art analytical instrumentation now embraces pragmatically available high-resolution mass spectrometry (MS) capable of separating mass fragments at the fourth or fifth decimal place (exact mass) where previous instrumentation was limited to single-digit mass units (integer mass). This perspective explains how the concept of 'exact mass' (or 'accurate mass') arises from basic physics principles, how different atoms contribute to the difference between integer mass and exact mass, and how these distinctions can serve as an additional dimension in the identification of unknown molecules in environmental or biological samples. The focus here is only on exact mass of 'mono-isotopic features'. More complex data reduction techniques invoking molecular fragmentation, isotopic abundance, and chromatographic separation are left for future articles.
Overview
Toxicity testing and disease diagnosis have evolved from simple target analysis with modest instrumentation to embrace discovery (or non-targeted) analysis. Therein, as many compounds are measured as possible, and then the resulting complex data stream is interpreted to deduce probative changes or perturbations (Reichenbach et al 2012, Pleil and Stiegel 2013). Furthermore, the traditional in vivo animal and human biological media approaches are being supplemented by high-throughput in vitro analyses (Pereira and Williams 2007, Andersen et al 2010, Tice et al 2013, Pleil et al 2015a, Judson et al 2014). The ultimate goal is to link environmental exposures to internal dose to ultimate health outcome (Pleil and Sheldon 2011, Sobus et al 2011, Pleil 2015, Bean et al 2015), which requires a variety of mathematical, statistical, and database interpretation techniques (Sobus et al 2010, Pleil et al 2015b, Sobus et al 2015). Additionally, interpretation of the in vivo to in vitro linkage is becoming a crucial component for streamlining environmental and public health research as implemented through adverse outcome pathways (Vinken 2013, Angrish et al 2015). Regardless of the specific application, current research relies primarily on instrumentation using some form of mass spectrometry as the analytical finish.
State of the art instrumentation
Recent developments in such new analytical instrumentation have coupled time-resolved separation (gas and liquid chromatography) with high-resolution mass spectrometry; the new technology is adding complexity to analyses, especially with respect to data interpretation (Glish and Vachet 2003, Schymanski et al 2014, 2015). We can now routinely discern up to thousands of molecular 'features' in individual samples of blood, breath and urine, in cell lines, as well as in environmental matrices of air, water, soil, dust, and food (Chance et al 2003, Muir and Howard 2006, Hernandez et al 2012, Forcisi et al 2013, Kalluri et al 2014, Marzinke et al 2014, Gago-Ferrero et al 2015, Moritz et al 2015).
This increasing ability to detect ultra-trace levels of many thousands of chemicals is no longer relegated to a few 'super-labs', but is commercially available for standard analysis in research and production laboratories. The two basic technological improvements are in multi-dimensional gas or liquid chromatography (GC or LC) commonly referred to as GC × GC, or LC × LC, and in high-resolution mass spectrometry detection based on sector, time of flight (ToF), or Fourier-transform ion cyclotron resonance (FT-ICR) trapping methods (Marshall et al 1998, Mondelo et al 2008, Liang et al 2011, Wu et al 2012). To date, most of the applications have been with LC-MS focused on blood and plasma; we note that gas-phase analytics, especially with GC-MS, and GC-ToF-MS are now gaining ground especially for in vivo breath analysis and in vitro measurements of cellular respiration that will ultimately gain advantage with the implementation of high resolution MS (Zhu et al 2013, Amann et al 2014, Bean et al 2014, Schivo et al 2014, Baranska et al 2015). Many of these new applications are directly geared towards disease and infection diagnostics, especially for pneumonia and cystic fibrosis (Filipiak et al 2015, Shestivska et al 2015).
Data interpretation
Given the complexity of the resulting data stream from the new generation of analytical instrumentation, bioinformatics mining is becoming routinely applied both for 'targeted' analysis and for 'discovery' (non-targeted) analysis. The underlying mathematics are complex, and specific to the particular instrumentation. As such, the interpretation of results is often subject to the current revision of software/firmware from a manufacturer and increasingly opaque to the user. We note that discrimination based on chromatographic elution time is still relatively straightforward; where the high complexity appears is in the interpretation of molecular weight which is measured to the 4th or 5th decimal place in standard atomic mass units such as amu, u, or Dalton (Da) discussed later. As such, the question arises as to what the total mass and tiny fractions of nucleon mass actually mean, and how differences should be interpreted (Cristoni and Bernardi 2004, Sleno 2012, Sugimoto et al 2012, Barbara et al 2011).
This perspective focuses on the concept of 'exact mass' which is the fundamental physics principle for high-resolution mass spectrometry. Certainly most of us are aware of the general ideas of mass spectrometry (ions are separated by their mass/charge ratio in an electromagnetic field, ionization creates a pattern of charged mass fragments, some atoms have isotopes, etc), but the subtleties of how the masses of individual atoms and the combinations of masses in a molecule are expressed at the atomic level are sometimes a bit vague. Herein, we hope to explain at a fundamental level how exact mass comes about, and how to exploit this new level of discrimination. The focus is on traditional organic molecules plus those containing at least one carbon atom as might be found in organic based media. The ultimate goals are to improve identification of targeted compounds by their exact mass determination, and to use exact mass to help classify unknown compounds found in discovery (non-targeted) analyses of complex organic matrices. There are certainly additional techniques for helping identify unknowns with mass spectrometry including isomer structure and fragmentation patterns; here we stay with the basics of mono-isotopic mass as the analytical discriminator. We further note that we focus exclusively with singly charged ions as is the basic assumption for MS in general.
What are atomic number and integer mass?
An element is defined by the number of protons in the atomic nucleus; this is the 'atomic number' as found in the periodic table of the elements. The 'integer mass' is defined as the sum of the number of protons and the number of neutrons in the atomic nucleus; an element can have more than one integer mass, but only one distinct atomic number. The number of electrons in a neutral atom is equal to the number of protons, but they do not contribute to the integer mass. Protons and neutrons are collectively referred to as nucleons.
What is the atomic (nuclear) mass?
We are much more attuned to measuring mass (or weight on the earth's surface) in units like kilograms or pounds. At the sub-atomic (proton, neutron and electron) level, this is a bit unwieldy as their masses are 1.6726 × 10⁻²⁷ kg, 1.6749 × 10⁻²⁷ kg, and 9.1094 × 10⁻³¹ kg, respectively. Initially, relative masses of individual atoms were assigned as the integer sum of the protons and neutrons (nucleons), and the contributions from the electrons were considered negligible. The nucleon counts reflected the initial designation of atomic mass, and a mole of an atom was defined as weighing as many grams as the nucleon number. For standard single mass unit resolution spectrometry, this remains a sufficient and elegant identifier. Many elements have isotopes, that is, the same number of protons, but different numbers of neutrons, and so the molar mass of an element accounts for the typical composition of isotopes; this is designated as 'atomic weight', and should not be confused with the 'mono-isotopic mass' which is discussed later.
The problem of fractions arose when instruments became capable of measuring mass at a finer resolution. The nucleons in different sized atoms have different observed masses. From a basic physics perspective, this is accounted for by Einstein's energy versus mass equation, E = mc2. The premise is that it requires energy to overcome the nuclear strong-force to pry neutrons and protons apart from their nucleus. As such, a free proton or neutron has slightly more mass than one bound inside an atom; the atomic mass is not just the sum of the masses of free protons and neutrons, but actually a slightly lower number.
Important: The atomic weight as found in the periodic table of the elements is comprised of a weighted average of all stable isotopes of that element. It is not the same as atomic mass, which is defined as the mass of an individual isotope. The atomic weight is used in thermodynamics equations using pressure, volume, temperature, density, etc. The atomic mass is the salient value for mass spectrometry.
What is an atomic mass unit (amu)?
The concept of 'amu' or atomic mass unit, was implemented to avoid using kg numbers and to make the mass of different elements (nuclei) more easily comparable. The popular web literature and Wikipedia searches attribute the concept of indexing atomic weight to hydrogen in 1803 to John Dalton (1766–1844) although his contemporaries including William Prout (1785–1850) and Jons Jakob Berzelius (1779–1848) were also involved in the early work for coming to consensus regarding atoms and their masses. Later on, Wilhelm Ostwald (1853–1932) is credited with suggesting 1/16 of the mass of the oxygen atom (16O, with 8 protons and 8 neutrons) as the index. Anecdotally, this pragmatic change was adopted because, at the time, it was more accurate to weigh oxygen compounds than hydrogen.
The discovery of isotopes in 1912, and especially that of the 18O isotope (8 protons and 10 neutrons), caused some re-evaluation of how to interpret atomic mass in general. As the relative abundance of 16O is 99.757%, and 18O is only ~0.205%, it was not considered an important problem and the common use of the 'amu' based on 1/16 of an oxygen atom mass continued. However, mass measurement and chemistry instrumentation continued to improve and the study of organic compounds dominated chemistry. In 1961, the International Union of Pure and Applied Chemistry (IUPAC) revisited the issue and it was decided to designate 1/12 of a carbon atom comprised of 6 protons and 6 neutrons (12C) as the index mass as carbon defines what is an organic molecule; this was designated as the 'unified atomic mass unit' or 'u'. To date, the acronym 'amu' is commonly used to represent u based on carbon, and more recently, the Dalton, or Da, was chosen as the official name of the unit. In some applications, the mass to charge ratio is used as an identifier; the unit Thompson (Th) is defined as Da/e where e is the elementary charge (Cooks and Rockwood 1991). A detailed history of the evolution of atomic mass interpretation is available in the literature (De Laeter et al 2003).
What is exact mass?
The 'exact mass' of a molecule is stated in u or Da and is measured empirically; nowadays, it is typically determined by the path a singly ionized molecule takes in a precisely defined electromagnetic field, and represents the underlying physics of mass spectrometry. If we know the chemical formula of the molecule, then the exact mass can also be calculated by summing the exact masses of the individual atoms making up the molecule. In mass spectrometry, we usually index each atom and molecule by its 'mono-isotopic mass', that is, we do not allow mixtures of isotopes to contribute to the exact mass of an individual molecule. This becomes a bit difficult to define for atoms that have numerous isotopes with similar percentages of naturally occurring stable isotopes, especially for those in metals. For organic species the six most common atoms are carbon, hydrogen, nitrogen, oxygen, phosphorus and sulfur (C, H, N, O, P, S). We are also concerned with exogenous organic compounds containing halogens (e.g. fluorine, chlorine, bromine and iodine). In either grouping, the mono-isotope choice is straightforward. For example, carbon (6 protons) has isotopes with 6, 7, and 8 neutrons, but the 6-neutron isotope dominates with 98.9% abundance. Chlorine (17 protons) has two major isotopes with 18 and 20 neutrons (75.8% and 24.2% abundance, respectively) so we use the 18-neutron isotope. Phosphorus (15 protons) has 23 different isotopes ranging from 9 to 31 neutrons, but only the 16-neutron isotope is stable, and so it is the proper choice. Even when there are lower isotopes, we generally choose the one most likely to be present in the real-world; for some metals, this is not always obvious, but fortunately, organic compounds with such atoms are rare.
Table 1 shows the number of nucleons and mass data for the atoms mentioned above, plus some others that are found in organic compounds. We define the mono-isotopic atom as the most prevalent stable isotope and the mass defect of an atom as the difference between the exact mass and the integer mass.
Table 1. Mono-isotopic masses and nucleon numbers for common atoms in organic molecules.
| Atom | Protons (#) | Neutrons (#) | Integer mass (# nucleons) | Exact mass (Da) | Mass defect (Da) |
|---|---|---|---|---|---|
| Carbon | 6 | 6 | 12 | 12.000 00 | 0.000 00 |
| Hydrogen | 1 | 0 | 1 | 1.007 83 | 0.007 83 |
| Nitrogen | 7 | 7 | 14 | 14.003 07 | 0.003 07 |
| Oxygen | 8 | 8 | 16 | 15.994 92 | −0.005 08 |
| Phosphorus | 15 | 16 | 31 | 30.973 76 | −0.026 24 |
| Sulfur | 16 | 16 | 32 | 31.972 07 | −0.027 93 |
| Fluorine | 9 | 10 | 19 | 18.998 40 | −0.001 60 |
| Chlorine | 17 | 18 | 35 | 34.968 85 | −0.031 15 |
| Bromine | 35 | 45 | 79 | 78.918 34 | −0.081 66 |
| Iodine | 53 | 74 | 127 | 126.904 48 | −0.095 52 |
Note. Exact mass from www.sisweb.com/referenc/source/exactmas.htm.
What is the exact mass of a molecule?
As mentioned above, the exact mass for a molecule (where we do not know the chemical formula) can be measured empirically using basic physics principles of a charged object moving in an electromagnetic field. If we know the chemical formula, then the exact mass can be calculated using table 1 entries for the exact masses of the constituent atoms. For example, the exact mass of ethane, C2H4, is calculated as:

and the exact mass of dichloromethane (the common solvent CH2Cl2) is calculated as:

We note that the integer masses of ethane and dichloromethane are 28 and 84, respectively, and that the exact masses can be above or below the integer masses depending on the atomic constituents.
How does measuring exact mass help tell compounds apart?
Traditional mass spectrometers, either linear quadrupole or standard ion trap configurations, have 1 Da resolution; for example, if a fragment lights up as 73 Da, then we can tell it apart from 72 or 74 Da, but not at any finer discriminator level. (We note that some higher performance quadrupole and triple quadrupole instruments may have finer resolution with about 0.1 to 0.5 Da). In general, however, if we have a chromatogram where compounds with 73 Da come out close together in time, we can only guess as to which compound, or mixture of compounds, is present. As a hypothetical example, suppose we run a breath sample using GC-MS and we find extracted ion profiles for 73 and for 86 Da. We could not discern the difference among the specific compounds as shown in the example if we only knew the integer mass. Table 2 shows different possible compounds (isobars) with 73 Da and 86 Da integer masses.
Table 2. Two examples of compounds with same integer mass and different chemical formulas; knowledge of exact mass allows discrimination.
| Compound | Formula | Integer mass | Exact mass (Da) | Mass defect (Da) |
|---|---|---|---|---|
| Methylisocyanate | C2H3NS | 73 | 72.998 62 | −0.001 38 |
| Ethene, nitro- | C2H3NO2 | 73 | 73.016 38 | 0.016 38 |
| N,N-Dimethylformamide | C3H7NO | 73 | 73.052 76 | 0.052 76 |
| 1-methylguanidine | C2H7N3 | 73 | 73.064 00 | 0.064 00 |
| Isobutylamine | C4H11N | 73 | 73.089 15 | 0.089 15 |
| Chlorodifluoromethane | CHClF2 | 86 | 85.973 48 | −0.026 52 |
| Methoxy, trifluoro- | CHF3O | 86 | 85.997 95 | −0.002 05 |
| Vinyl acetate | C4H6O2 | 86 | 86.036 78 | 0.036 78 |
| Ethylene urea | C3H6N2O | 86 | 86.048 01 | 0.048 01 |
| Pentanal | C5H10O | 86 | 86.073 16 | 0.073 16 |
Here we see that instruments with high mass resolution could distinguish among compounds with same integer mass but different chemical formulas (isobars). The concept of mass defect in the last column is described in the next section below. Typically, a high resolution MS has resolution of 5 parts per million (ppm) defined as the detectable Da difference of the MS divided by the molecular mass. In table 2, at ~80 Da, the resolution at 5 ppm would be calculated as 0.0004 Da, which is more than sufficient to separate the isobars from each other.
Important: Exact mass can only distinguish among different isobars (molecules with different formula but same integer mass); it cannot distinguish among isomers (same formula, different stereochemistry).
What is the mass defect of an atom or molecule?
The difference between the integer mass and the exact mass of an atom or molecule is termed the mass defect as shown for atoms in the last column of table 1 and for molecules in the last column of table 2. In effect, it is the mass equivalent to the energy required to separate each nucleon away from each nucleus. One might wonder why the mass defect for ethane appears positive, and the mass defect for methylene chloride is negative as we expect all mass defects to be negative under the physics interpretation. This discrepancy is an artifact of the definition of the Dalton as 1/12 of the carbon 12C atom; as such, the mass defect of carbon is defined as the zero set-point, rather than using a separated 'free' nucleon.
When the integer mass is known via the chemical formula, the mass defect is calculated directly by subtraction. However, if we measure the exact mass of an unknown 'feature' in a high-resolution mass spectrometer analysis, we cannot calculate the mass defect directly, and need to infer the integer mass somehow.
What is the mass defect of a molecule with unknown formula?
The mass spectrometer can provide the exact mass for many thousands of molecules and fragments in any individual sample analysis; the problem is how to determine the mass defect if we do not know the integer mass from the formula. This has been resolved to some extent with an approximation technique. For any given exact mass, the integer mass is defined as the closest whole unit. So, for the two examples above, if ethane and dichloromethane were considered unknowns of exact mass 28.0313 and 83.9534 Da, respectively, then the integer masses would be (correctly) assigned as 28 and 84 Da.
This is a reasonable approach as the deviations of atomic exact mass from the atomic integer mass are small (see table 1). However, we must acknowledge that this limits the range of assigned mass defect from ⩾ −0.5 to <0.5. What if the true mass defect is outside of this imposed range?
For example, a simple molecule like C4Br8 (a catalyst used in making oligomers) has a true mono-isotopic integer mass of 680 Da and exact mass of:

If we already know that the true formula is C4Br8, then the true mass defect is calculated as −0.6533; if we treat this compound as an unknown, then we would assign the integer mass as 679 Da, and erroneously calculate the mass defect as +0.3467.
Similarly, larger hydrocarbons (HC), especially saturated compounds, can have large positive mass defect. The n-alkanes with more than 31 carbons found in greases, waxes and asphalts, all have true mass defect greater than +0.5000. For example, C31H64 is a major alkane constituent of tobacco leaves and beeswax. It has a true integer mass of 436 Da and an exact mass of:
As for the previous case with C4Br8, if we know the formula C31H64 and thus the true integer mass, then the true mass defect can be calculated as +0.5008 Da. If however, this compound were treated as an unknown, we would assign the integer mass to 437 Da and erroneously assign the mass defect to −0.4992 Da. All higher n-alkanes would similarly be incorrectly assigned.
How can mass defect be used to classify unknown compounds?
In general, the exact mass can be used to better narrow down the identity of compounds that have already been placed into a library, and it can assist in suggesting specific chemical formulas that would add up to a specific exact mass within that instruments' particular resolution window. As such, the combination of exact mass and mass defect gives an indication of compound class and size according to the information in table 1. If mass defect is positive, then we expect a preponderance of hydrogen and nitrogen; if it is negative, we expect a preponderance of oxygen, sulfur, phosphorus and halogens. Recall that the carbon content of organic molecules remains neutral in these calculations as it is defined as having zero mass defect.
Various classification schemes have been proposed for specific biological matrices. Most often, they are based on a specific range of related compounds of interest, such as perfluorinated compounds (PFCs), organophosphorus pesticides (OPP), or groups of protein fragments for which there is already some knowledge. For example, if we have exact mass and true mass defect for a series 5 or 10 PFCs ranging from 175 to 450 Da with mass defect ranging from −0.015 to −0.066, then we could exclude unknowns outside of these ranges for detecting candidates of similar, but as yet undocumented, PFCs (Strynar et al 2015).
Testing mass defect classification with DSSTox
As indicated above, there are some caveats to using mass defect for classifying unknown compounds into groups. To test the value of using mass defect based on integer mass estimates, we need to use a database of known structures, and then determine how well we could classify them under the assumption that we do not know the true formula. To this end, we use the Distributed Structure—Searchable Toxicity (DSSTox) database developed by U.S. Environmental Protection Agency as a baseline. As defined by US EPA:
"...The DSSTox Database incorporates state-of-the-art cheminformatics workflows, provides the chemical infrastructure for EPA's Safer Chemicals Research, including the ToxCast and Tox21 high-throughput toxicology efforts. EPA will continue to add content to DSSTox and users will be able to directly access the updated and expanded DSSTox database, as well as chemical exploration tools and capabilities currently under development."
(www2.epa.gov/chemical-research/distributed-structure-searchable-toxicity-dsstox-database).
Briefly, we use the DSSTox database to represent a subset of the chemical space of environmental and biological, and commercial chemicals that includes "...standardized, high quality chemical structure files for chemical substances of interest to the U.S. EPA, and the larger environmental health community..." (Rager et al 2016). The purpose is to have a highly accurate and well-curated set of known chemicals against which methods for assessing unknowns could be tested.
The mass range for the organic entries in the DSSTox Database is from 15 to 2284 Da; these compound masses are lognormally distributed with geometric mean, GM = 244.73 and geometric standard deviation, GSD = 1.70. Figure 1 shows the theoretical mass frequency distribution. Although the total range goes up to 2284 Da, the 90th, 95th, 99th and 99.9th percentiles are much lower at 475, 586, 841, and 1261 Da, respectively.
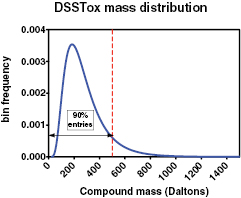
Figure 1. Distribution of compound masses in DSSTox Database. Units in Da: GM = 245; GSD = 1.7; range (15–2248); 90% = 475; 95% = 586; 99% = 841. Frequency on y-axis is for 1 Da wide bins.
Download figure:
Standard image High-resolution imageDistribution of mass defect for DSSTox entries
When we use mass defect for classifying unknowns, it is important to have an underlying concept of how these values are distributed; that is, how probative are differences in mass defect for classifying different unknowns? The calculated (true) mass defect is approximately normally distributed with mean μ = 0.102 and standard deviation σ = 0.128. Figure 2 shows this distribution.
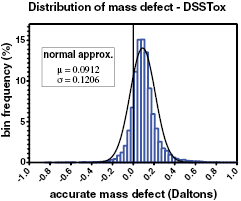
Figure 2. Empirical and modeled distribution of 'true' mass defect for all carbon containing entries in DSSTox database. The distribution is close to normal with μ = 0.0912 and σ = 0.1206, and 95% of all values are between −0.156 and 0.347; however, the actual range of mass defect is −1.23 to 2.04 which tends to broaden the model (smooth line) beyond the empirical (bars) data.
Download figure:
Standard image High-resolution imageFigure 2 demonstrates that about 95% of all mass defect values lie between −0.156 and 0.347 Da, and that only 22.4% are negative. This shows that there is a preponderance of hydrogen and nitrogen (positive mass defect) in organic molecules that overwhelms the occurrence of oxygen, phosphorus, sulfur and the halogens. The relative influence of common atoms is seen in table 1. A negative mass defect is relatively rare (1/5), and so is a useful first cut in categorizing unknowns. We note that halogens (especially) are of importance in finding anthropogenic chemicals with toxic properties in the wide range of all chemicals.
DSSTox database structure
The current completed and validated version of DSSTox (10/2014) contains 34 669 compounds, their structures, formulas, and various identification numbers. Internally, we have further calculated integer mass, exact mass, and mass defect for each compound. For the ensuing evaluation, we consider only organic compounds (defined as containing at least one carbon atom); this reduces the total count to 32 424 compounds each with a discrete entry using only the mono-isotopic mass. The full re-constructed database is given in the supplementary material (stacks.iop.org/JBR/10/012001/mmedia) as an excel file. Briefly, table 3 shows an example excerpt.
Table 3. Excerpt of DSSTox database as reconstructed for mass defect assessment (full database given in the supplementary material).
| DSSToxCID | CAS | Chemical name | Formula |
Mol. weight |
Monoisotopic (mass |
Rounded (mass |
Mass defect (rounded) | Integer (mass |
Mass defect (integer) | Correct |
|---|---|---|---|---|---|---|---|---|---|---|
| 33187 | 110999-46-7 | 1,2,3,7,8,9-Hexabromo-dibenzo-p-dioxin | C12H2Br6O2 | 657.5700 | 651.5155 | 652 | −0.4845 | 652 | −0.4845 | Yes |
| 30773 | 544-85-4 | Dotriacontane | C32H66 | 450.8800 | 450.5165 | 451 | −0.4835 | 450 | 0.5165 | No |
| 20521 | 56092-81-0 | Ionomycin | C41H72O9 | 709.0180 | 708.5176 | 709 | −0.4824 | 708 | 0.5176 | No |
| 9217 | 1569-01-3 | 1-Propoxy-2-propanol | C6H14O2 | 118.1760 | 118.0994 | 118 | 0.0994 | 118 | 0.0994 | Yes |
| 31893 | 55511-98-3 | Buthidazole | C10H16N4O2S | 256.3300 | 256.0994 | 256 | 0.0994 | 256 | 0.0994 | Yes |
| 22203 | 4726-14-1 | Nitralin | C13H19N3O6S | 345.3760 | 345.0995 | 345 | 0.0995 | 345 | 0.0995 | Yes |
| 2781 | 3577-01-3 | Cephaloglycin | C18H19N3O6S | 405.4310 | 405.0995 | 405 | 0.0995 | 405 | 0.0995 | Yes |
| 2760 | 60925-61-3 | Ceforanide | C20H21N7O6S2 | 519.5630 | 519.0995 | 519 | 0.0995 | 519 | 0.0995 | Yes |
| 24868 | 2050-43-3 | N-(2,4-Dimethylphenyl)-acetamide | C10H13NO | 163.2200 | 163.0997 | 163 | 0.0997 | 163 | 0.0997 | Yes |
| 376 | 1163-19-5 | Decabromodiphenyl oxide | C12Br10O | 959.1710 | 949.1783 | 949 | 0.1783 | 950 | −0.8217 | No |
| 34372 | 13654-09-6 | 1,1'-Biphenyl, 2,2',3,3',4,4',5, -5',6,6'-decabromo- | C12Br10 | 943.1720 | 933.1834 | 933 | 0.1834 | 934 | −0.8166 | No |
| 46967 | 71216-02-9 | Carbonic acid, 1,2-ethanediyl-bis(pentabromophenyl) ester | C16H4Br10O6 | 1091.2419 | 1081.1842 | 1081 | 0.1842 | 1082 | −0.8158 | No |
aValues for 'desalted' mass of compound to reflect real world occurrence.
The excerpted compounds were arbitrarily chosen to show a range of mass defects based on the true integer mass to demonstrate how using the rounding technique for unknowns might go awry. In the complete database of all 32 424 carbon-containing compounds, the rounding method turns out to be quite robust. The details are discussed in the next section.
Accuracy of rounding method for unknowns
We have seen how the rounding method for approximating integer mass may give the wrong value depending on the true formula of the mass spectrometric feature. Granted, it requires an odd combination of many positive or negative mass defect atoms to cause a disruption, however, when grouping unknowns by structure, this may cause misidentification of a crucial feature. Upon investigating the total DSSTox Database of defined organic compounds (supplementary material), we found that overall, the rounding method assigned 1.31% erroneous mass defects, of which 1.22% were incorrectly labeled as negative, and 0.09% were incorrectly labeled as positive.
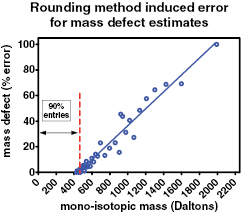
Under the assumption that the entries in the DSSTox database are representative of a broad spectrum of compounds that could be found in the environment or in biological samples, we now have reasonable (but not perfect) confidence for the mass defect grouping method for unknown features. We can further explore the classification error by sub-grouping these results by total molecular mass. Figure 3 shows the percent error (how many incorrect assignments of mass defect are expected), as a function of mono-isotopic mass. Here we see that the rounding method is completely valid for molecular mass up to about 450 Da, which represents about 90% of the entries in DSSTox. Beyond 450 Da, the remaining 10% of the entries have monotonically increasing error rates up to 100% at about 1900 Da.
Figure 3. Graph of error induced in mass defect assignment by using 'rounding' method for estimating integer mass. 90% of the DSSTox entries are below 450 Da and give accurate integer mass estimates. Above 450 Da, significant mass defect assignment error occurs and increases monotonically.
Download figure:
Standard image High-resolution image
Summary
Measuring the exact mass is a valuable tool for categorization, identification, and verification of organic chemicals as it adds another discrimination factor beyond standard time-elution and single-Dalton resolution. Herein we have explained the origins of mass differences among molecules with identical integer mass (total nucleon number), the evolution of the atomic mass unit (amu) and later the Dalton (Da), and finally how exact mass and the attendant mass defect are distributed, and how they can be interpreted for compound classification. The basis for all comparisons was the DSSTox database of about 33 000 compounds (from 2014); we assumed that this database is approximately representative of a broad variety of chemicals found in environmental and biological samples.
Specific conclusions
Based on this perspective, we can make a series of informed statements about the use of exact mass in the analytical laboratory:
- Atomic weight, as found in periodic tables, is not used for MS; it represents a weighted average of all isotopes.
- Mono-isotopic atomic masses are used as the baseline for a molecule; they represent the masses of individual isotopes of specific atoms that add up to the molecular mono-isotopic mass.
- Integer mass of molecules is crucial; this can be directly calculated from the chemical formula using mono-isotopic atomic nucleon numbers.
- For unknown chemical formula, integer mass can be estimated by rounding the measured exact mass to the nearest integer.
- Rounding method for integer mass is only robust below ~450 Da.
- 90% of all DSSTox entries have integer mass <475 Da
- 95% of mass defect values are between −0.156 and 0.347.
- Only about 22% of all DSSTox entries have negative mass defect.
- Negative mass defect is an indicator of excess halogens, oxygen, sulfur, and phosphorus atoms in a molecule.
- Positive mass defect is an indicator of excess hydrogen and nitrogen atoms in a molecule.
Caveats of using exact mass
We must recognize that isomeric structures, (compounds with the same atoms, but different arrangements) cannot be separated by exact mass. Also, it is always possible that two different chemical formulas could have exact masses so close together that the particular instrument cannot resolve the difference. Finally, exact mass and mass defect are not the complete answer to identifying unknowns; additional information from chromatographic retention time, isotopic mass abundances, and mass fragmentation patterns all contribute to unambiguously defining organic molecules. In short, added information is needed to discern which feature is actually the mono-isotopic molecule that can be used to identify a particular compound. We note that all high-resolution MS instruments have their own proprietary software that assists in making suggestions for chemical formulas and structures based on exact mass, estimated mass defect, and the other MS information mentioned above. For the present article, we restricted the discussion to the basics of mono-isotopic mass.
We note that the various proprietary computational approaches for identifying compounds using pattern recognition and rules-based tactics are effective, however, at some point a human must study the results and make the ultimate decision. As such, an a priori discriminator (or triage method) is important to streamline the ultimate interpretation. The exact mass and mass defect parameters described here are important because serve as such discriminators and are often used in larger high-throughput commercial laboratories where many of thousands of features need to be evaluated efficiently.
Ultimate advantage of using exact mass
In contrast to standard mass spectrometry with single Da resolution, the added information from high-resolution features narrows down the possible chemical formulas of a molecule, supports confirmation of targeted species, and helps identify unknowns. Once the integer mass and exact mass are established, the mass defect can be used to further classify compounds by the preponderance of atoms present; this is most useful for discerning halogenated molecules as a series or group in a complex sample. Finally, the use of rounding to estimate integer mass of unknowns can be considered robust for breath analysis as most exhaled gases are well below the 450 Da limit. In conclusion, exact mass adds a crucial third dimension for compound identification beyond chromatographic retention time and single Da fragmentation pattern.
Acknowledgments
The authors are grateful for the expert advice from Dr Mark Strynar, Dr Jon Sobus, and Dr Seth Newton of US EPA regarding non-targeted analysis and the DSSTox database. The United States Environmental Protection Agency through its Office of Research and Development has subjected this article to Agency administrative review and approved it for publication. Mention of trade names or commercial products does not constitute endorsement for use.