
Abstract
Drug-eluting bioresorbable vascular scaffolds (BVSs) have emerged as a potential breakthrough for the treatment of coronary artery stenosis, providing mechanical support and drug delivery followed by complete resorption. Restenosis and thrombosis remain the primary limitations in clinical use. The study aimed to identify potential markers of restenosis and thrombosis analyzing the vascular wall cell transcriptomic profile modulation triggered by BVS at different values of shear stress (SS). Human coronary artery endothelial cells and smooth muscle cells were cultured under SS (1 and 20 dyne cm−2) for 6 h without and with application of BVS and everolimus 600 nM. Cell RNA-Seq and bioinformatics analysis identified modulated genes by direct comparison of SS conditions and Gene Ontology (GO). The results of different experimental conditions and GO analysis highlighted the modulation of specific genes as semaphorin 3E, mesenchyme homeobox 2, bone morphogenetic protein 4, (heme oxygenase 1) and selectin E, with different roles in pathological evolution of disease. Transcriptomic analysis of dynamic vascular cell cultures identifies candidate genes related to pro-restenotic and pro-thrombotic mechanisms in an in-vitro setting of BVS, which are not adequately contrasted by everolimus addition.
Export citation and abstract BibTeX RIS

Original content from this work may be used under the terms of the Creative Commons Attribution 4.0 license. Any further distribution of this work must maintain attribution to the author(s) and the title of the work, journal citation and DOI.
1. Introduction
Atherosclerosis, from the early development of fatty streaks to classic atheroma and advanced plaques formation, is the common pathology underlying major adverse events such as myocardial infarction and stroke. The acute rupture or erosion of a plaque may cause local thrombosis, leading to partial or total occlusion of the affected artery [1]. Among the available treatment techniques, percutaneous invasive interventions (PCIs), including coronary angioplasty and stent implantation, represent the leading choice. The advent of coronary stents resulted in reduction of procedure-related complications and markedly improved the long-term outcomes [2]. Nowadays, the majority of PCI procedures include the utilization of coronary stents and interventional cardiologists are faced with a wide spectrum of coronary stent types, from early conventional stents as bare-metal stent (BMS) to drug-eluting stent (DES), commonly used in current practice, followed by the new bioresorbable vascular scaffold (BVS) stents. The evolution from BMS to DES produced a significant decrease in the frequency of major PCI complications, namely in-stent restenosis (ISR) and stent thrombosis (ST). PCI with BVS has emerged as an alternative since the presence of the prosthesis in the coronary artery is temporary [3]. This technology enables restoration of the normal vasomotor tone and allows positive remodeling, simultaneously reducing inflammation and facilitating further interventions by percutaneous or surgical means [4]. In this action of recovery a support is obtained by the use of specific drugs, as everolimus, which is an inhibitor of mammalian target of rapamycin and are currently used as an immunosuppressant to prevent rejection of organ transplants. This drug has an anti-proliferative effect inhibiting vascular smooth muscle cells (VSMC) proliferation via blocking the cell cycle in the G1 phase [5], and has showed an anti-inflammatory effect in neutrophils reducing the release of IL-8 and decreasing tumor necrosis factor (TNF)-α-induced adhesion of neutrophils to endothelial cells (ECs) [6]. Despite expectations, clinical trials have registered a higher incidence of ST [7] and also ISR [8] following BVS (Abbott Vascular). Likewise coronary atherosclerosis development and progression, also this so-called 'stent disease' is a nonlinear, complex process, which follows different stages and involves several cell types and dynamic dys-regulations in biomolecular networks [9, 10]. For early prediction and prevention, it is critical to identify pre-disease molecular markers. VSMC and EC have leading roles in ISR and ST. Endothelial denudation and dysfunction are involved in vascular remodeling, thrombus formation and VSMCs activation. ECs synthesize several growth factors, including fibroblast growth factor (FGF), platelet-derived growth factor (PDGF), transforming growth factor (TGF)-beta as well as heparin and other growth-inhibitory factors that are important in SMC proliferation [11]. Normally quiescent VSMCs de-differentiate to a proliferative activated phenotype in response to endothelial injury. Activated VSMCs migrate to the intimal space, synthetize and secret large amounts of Extracellular Matrix (ECM), especially collagen and fibronectin, together with matrix metalloproteinases (MMP-1 and MMP-3) [12–14]. Multiple growth factors and cytokines (PDGF, interleukins, TNF-a, vascular endothelial growth factor (VEGF), monocyte chemoattractant protein-1 (MCP-1)) are involved in ISR [15]. Moreover, it is well-known since a long time ago that ECM/integrin/focal adhesion pathway is important for the regulation of VSMC gene transcription, in response to the mechanical factors that are significant in arteries, subjected to shear stress (SS) due to blood pressure [16, 17]. Flow driven mechanosensing pathways can alter endothelial phenotype and causes the production of cellular adhesion molecules, pro-inflammatory cytokines and transcription factors (TFs) [18].
The aim of this work is focused on the investigation, through an in-vitro fluid dynamic model, of the gene expression in human vascular cells human coronary artery smooth muscle cells (HCASMCs) and human coronary artery endothelial cells (HCAECs) exposed to physiological or pathological SS after application of BVS and everolimus, to highlight potential markers associated with restenosis and/or thrombosis.
Human coronary primary vascular cells (VSMCs—HCASMCs, endothelial cells—HCAECs) were cultured in static and dynamic conditions (SS of 1 and 20 dyne cm−2) with and without BVS and drug. RNA was isolated and the transcriptomic profile was analyzed. Comparing different cell culture conditions and with the support of Gene Ontology (GO) and network enhancing analysis, a group of genes were highlighted.
Among these, we focused on mesenchyme homeobox 2 (MEOX2), semaphorin 3E (SEMA3E), bone morphogenetic protein 4 (BMP4), heme oxygenase 1 (HMOX-1) and selectin E (SELE) for their involvement in different aspects of vascular injury and arterial wall homeostasis.
MEOX2, SEMA3E and HMOX-1 have all protective effects against the progression of atherosclerosis. MEOX2 is a TF known to regulate proliferation and differentiation of VSMC and EC [19] and these mechanisms play key roles in cardiovascular diseases [20]. SEMA3E interferes with the process of neointimal formation, blocking VSMC migration and proliferation [21]. HMOX-1 depletion in animal model was shown to accelerate atherosclerosis and its influence is due to the degradation of pro-oxidant heme and the generation of anti-oxidant products [22].
BMP4 is an inflammatory mechanosensitive cytokine and its expression is enhanced by disturbed SS in ECs. BMP4 triggers an inflammatory cascade involving ICAM-1 that in turn allows monocyte recruitment, foam cell lesion formation and thus atherosclerotic plaque onset [23].
Also, SELE is produced by ECs; it is an adhesion molecule and a specific marker of endothelial dysfunction regulating the extravasation of leukocytes towards the sites of inflammation. VSMCs seem to induce its expression in the adjacent ECs while SS (12 dynes cm−2) inhibits it [24]. This study shows how data integration approaches based on transcriptomic techniques could facilitate the identification novel disease markers and molecular targets to be used for prevention and early diagnosis [25, 26].
2. Method
2.1. Cell cultures
Primary cells were recovered from healthy subjects. Primary HCAECs were purchased from Promocell GmbH (Heidelberg, Germany) and cultured in the manufacturer's recommended medium, the EC growth basal medium MV2 supplemented with growth medium MV2 supplement pack. Primary HCASMCs were purchased from Thermo Scientific (Waltham, MA, USA) and cultured in the manufacturer's recommended medium, the Medium 231 supplemented with smooth muscle growth supplement.
2.2. Cell imaging
For cell characterization by immunofluorescence, cells were washed with phosphate-buffered saline (PBS), fixed with a 5% formalin solution in PBS for 20 min at room temperature (RT) and stored at 4 °C in PBS. Cells, after fixation, were placed in contact with 0.1% Triton X-100 in PBS at RT for 3–5 min to permeabilize cell membranes. Triton solution was removed and 5% BSA in PBS 1X for 30 min to block non-specific binding. In order to highlight cell structure a solution of TRITC-Phalloidin (Elabscience, Houston, TX, USA) diluted 1:200 in 1% BSA was added and incubated in the dark at RT for 1 h. At the end of the protocol, an anti-fade solution, supplemented with DAPI (4' 6-diamidino-2-phenylindole, Sigma-Aldrich, St. Louis, MO, USA), useful to mark cell nuclei, was added.
2.3. Everolimus cytotoxicity
A range of concentrations (1–2000 nM) was tested on both HCAECs and HCASMCs. Cells (8000 cells/well) were seeded in a 96-well plate and cultured with 100 μl of drug-supplemented media for 6 and 24 h. At the end of each experimental time, cells were tested with CellTiter-Blue® Cell Viability Fluorometric Assay (Promega, Madison, USA). After 2.5 h of incubation, the fluorescence signal was detected with a microplate reader (BMG Labtech, Ortenberg, Germany).
2.4. Dynamic flow tests
HCAECs and HCASMCs, within the 2nd and 6th passages, were used. When at confluence, cells detached with 0.5% Trypsin in 0.5 mM EDTA (Sigma-Aldrich, St. Louis, MO, USA), and seeded (50 000 cells µ−1-Slide) in Ibidi GmbH µ-Slide I Luer 0.4 mm (Gräfelfing, Germany). The BVS was a polylactic acid prototype furnished by Boston Scientific (Galway, Ireland): it has a length of 16 mm, an internal diameter of 3 mm, and strut thickness of 105 μm (figure S1, see supplementary file (available online at stacks.iop.org/BMM/16/045039/mmedia)).
In BVS experiments, scaffolds were placed over a polymeric coverslip stuck to Ibidi sticky-Slide I Luer flow system, a bottomless channel slide with a self-adhesive underside. Everolimus (Sigma-Aldrich, St. Louis, MO, USA) was directly dissolved into the medium at a fixed concentration of 600 nM (consistent with data obtained by cytotoxicity tests and literature) [27] to ensure reproducible results. Every experiment lasted 6 h. The experiments were conducted under 1 or 20 dyne cm−2.
2.5. RNA extraction
Total RNA was extracted from cells by a dedicated kit (RNeasy Plus Micro Kit, Qiagen Spa, Milano, Italy) accurately modified to purify total RNA (including microRNA (miRNA)) from small amounts of cells (<5 × 10⁵); after re-suspension and lysis of the cells in a highly denaturing guanidine–isothiocyanate-containing buffer, samples were selective passed through a gDNA eliminator spin column. Ethanol was added to the flow-through to provide appropriate binding conditions for RNA, and the samples were then applied to a silica-based membrane (RNeasy MinElute spin column), speeded on a microspin centrifuge; specific buffers allowed RNA to bind to the RNeasy silica-membrane and contaminants were efficiently washed away. High-quality RNA was then eluted in 14 μl of RNase free water without the need for additional DNase digestion.
The total RNA samples concentration was determined by measuring the absorbance at 260 and 280 nm (NanoDrop Thermofisher, Waltham, MA, USA) and calculated using the Beer–Lambert law (expected values between 1.8 and 2.1).
2.6. Transcriptome analysis for discovery and gene expression
Ovation SoLo RNA-seq Library Preparation kit (NuGEN, Redwood City, CA) has been used for library preparation following the manufacturer's instructions (library type: fr-second strand). RNA samples were quantified and quality tested by Agilent 2100 Bioanalyzer RNA assay (Agilent Technologies, Santa Clara, CA) or Caliper (PerkinElmer, Waltham, MA). Final libraries were checked with both Qubit 2.0 Fluorometer (Invitrogen, Carlsbad, CA) and Agilent Bioanalyzer DNA assay or Caliper (PerkinElmer, Waltham, MA). Libraries were then prepared for sequencing and sequenced on single-end 75 bp mode on NextSeq 500 (Illumina, San Diego, CA), ensuring 30 million reads per sample.
2.7. Bioinformatics analysis
Six groups of experiments for each cell type were considered for differential analysis of gene expression data, as summarized in table 1.
Table 1. Experimental conditions. Each group indicates the hemodynamic condition of in-vitro experiments performed with HCAECs and HCASMCs.
| Group | Experiments | Objective |
|---|---|---|
| 1 | Static set up | In-vitro standard static condition |
| 2 | Dynamic set up (1 dyne cm−2) | In-vitro hemodynamic reference standard |
| 3 | Dynamic set up (20 dyne cm−2) | |
| 4 | Static set up—BVS + drug | In-vitro standard static condition with application of BVS + drug |
| 5 | Dynamic set up (1 dyne cm−2)—BVS + drug | In-vitro model of stented coronary artery hemodynamic |
| 6 | Dynamic set up (20 dyne cm−2)—BVS + drug |
For bioinformatics analysis, a case calling and demultiplexing was performed processing raw data for both format conversion and demultiplexing by the Bcl2Fastq 2.20 version of the Illumina pipeline. Then, a trimming and deduplication process was done, removing lower quality bases and adapters by ERNE and Cutadapt software. Reads deduplication based on the unique molecular identifier composed of eight random bases for unambiguous identification of unique library molecules by IGATech (Udine, Italy) proprietary script were used to discriminate between true Polymerase Chain Reaction (PCR) duplicates and independent adaptor ligation events to fragments with the same start site. Alignments on the reference genome GRCh38 were performed with STAR using a two-pass method. The transcripts count was executed, assembling, and quantifying the full-length transcripts, which represented multiple spliced variants for each gene locus by Stringtie. DESeq2 was used to perform comparisons between expression levels of genes and transcripts. Normalization was performed using the median-of-ratios method [28]. An initial list of modulated genes in the current experimental set was determined by application of a likelihood ratio test [29] accounting for the model 'cell-type + flow + stent + stent:flow', which was reduced by the variance accounted for 'cell-type' only. Adjusted p-value <0.01 was set an initial threshold. Further analyses on pairwise comparison were obtained by filtration of the fold change (FC) calculation: the ratios between the relative expression values of two different conditions, expressed as absolute value, was assessed to be above 3. The transcriptomic data were submitted to the Gene Expression Omnibus under Accession No. GSE139292.
For the GO analysis, focused on gene association to specific biological processes, the Genemania web application was used (https://genemania.org/).
For the network enhancing process, miRNET system (www.mirnet.ca/miRNet/home.xhtml), an easy-to-use, web-based platform designed to help elucidate miRNA and TF functions by integrating users' data with existing knowledge via network-based visual analytics [30], was used.
3. Results
3.1. Cell characterization
HCAECs and HCMASCs were observed under fluorescent microscopy in order to observe the cell morphology under the different experimental conditions. In figure S2 (see supplementary file), the presence of BVS + drug in HCAECs seems to better preserve, at 1 dyne cm−2, cytoskeletal structure and morphology, probably due to the physical presence of BVS that contrast and protect against the turbulent flow. At 20 dyne cm−2, ECs, as expected, present a more elongated shape with cytoskeletal fibers aligned to the flow (figures S2(c) and (d)). For HCASMCs (figure S3, see supplementary file), at 20 dyne cm−2, both with and without BVS + drug (figures S3(c) and (d)), cells seems to loose the typical spindle-shape morphology acquiring a more polygonal structure, related with an activated and synthetic state [12]. At 1 dyne cm−2 with BVS + drug (figure S3(b)), we can observe a dysregulation of cytoskeletal organization respect to the cells without (figure S3(a)).
3.2. Everolimus cytotoxicity
Cytotoxicity analysis showed that, for the concentration range explored (1–2000 nM everolimus), cell viability was preserved above 80% within 24 h and no significant differences were observed between the two cell types and the two-time intervals chosen (6 and 24 h) (figures 1(a) and (b)).
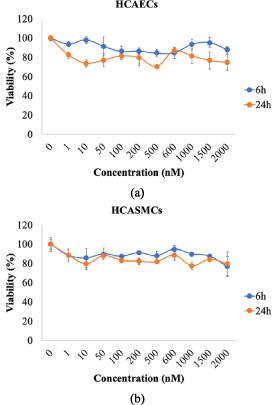
Figure 1. Cell viability was evaluated in HCAECs (a) and HCASMCs (b) static cultures exposed to incremental concentrations of everolimus (1–2000 nM) for 6 and 24 h.
Download figure:
Standard image High-resolution imageViability decreased below 80% after 24 h and at high concentration levels (data not shown), these findings agreed with those of Fejes et al [27]. Everolimus concentration chosen for cell experiments was 600 nM.
3.3. Transcriptomic analysis
Transcriptomic expression profiling showed that the samples are clustered according to their biological origin, confirming that SS between the groups, both in HCASMCs and HCAECs, is the major contributor to the variation in the data set (figure 2).
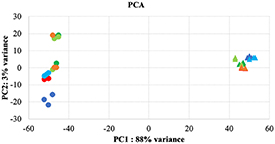
Figure 2. Principal component analysis (PCA) of HCASMCs () and HCAECs () samples, based on expression levels, was showed in static without (, ) and with BVS + drug (, ), 1 dyne without (, ) and with BVS + drug (, ), 20 dynes without (, ) and with BVS + drug (, ).
Download figure:
Standard image High-resolution imageThe principal component analysis (PCA) indicated a low variability between the biological replicates. The global hierarchical clustering, focused on 100 most expressed genes, showed a separation of the samples, as illustrated in figure 3.
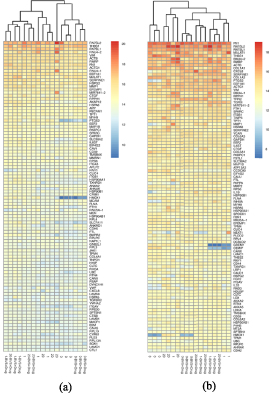
Figure 3. Cell clusterization of 100 most expressed genes in HCAECs (a) and HCASMCs (b) samples. Through the dendrogram of the mean expression values from replicated samples, a separation of all samples into distinct clusters was displayed.
Download figure:
Standard image High-resolution imageConfirmed the separation between HCAECs and HCASMCs, for these last there was an evident difference between static and flow condition: in dynamic conditions was also evident the difference between cells treated with BVS + drug and untreated ones.
3.4. Overall findings of HCASMCs and HCAECs gene expression
Transcriptome data was generated using messenger RNA (mRNA) sequencing of HCASMCs and HCAECs static and dynamic culture samples and were analyzed comparing the experimental conditions for HCASMCs and HCAECs, respectively. The stepwise workflow exploited to derive a small panel of relevant genes significantly associated with the main pathways of vessel pathobiology is the following:
Step 1. In-vitro cell model characterization. Gene expression changes associated to dynamic conditions as compared to the static state in HCASMCs and HCAECs (cases A, B, D, E) are assessed as also gene expression changes associated to BVS + drug application in static culture (case G) and dynamic conditions (cases H and I)
Step 2. In-vitro model of SS-related mRNA changes. Differential expression in a pathological SS-induced putative proatherogenic environment (case C) and in a potentially pro-restenotic/thrombotic environment (case F) with its peculiar hemodynamic characteristics was classified trough GO approach and analyzed by direct comparison of genes present in the two conditions.
Step 3. Shared biological processes in HCASMCs and HCAECs with common relevant genes among the different cases (A–I) were analyzed through GO providing a condensed number of genes mostly involved in the pathological processes.
3.5. Global modulation of gene expression
Out of a total of 18 189 genes for which expression values have been evaluated using a general linear model, 2086 (11.5%) genes were found differentially expressed. By applying minimum FC criteria, for 537 genes (2.95%, table 2) to be globally modulated, of which, 179 (0.98%) down- and 358 (2.96%) up-regulated in HCASMCs were found, while, for HCAECs modulated genes were 410 (2.25%, table 3) genes, 131 (0.72%) down- and 279 (1.53%) up-regulated (see supplementary file).
Table 2. Number of differentially expressed HCASMCs genes. The table shows the number of HCASMC genes modulated by the comparison of the different cell culture conditions described in table 1. Selection criteria: p < 0.01, FC ± 3.
| Case | HCASMCs differential analysis | Comparison | Number of genes | DOWN | UP |
|---|---|---|---|---|---|
| A | 0 vs 1 (Group 1 vs 2) | Static vs dynamic (patho SS) | 145 | 71 (48.9%) | 74 (51.1%) |
| B | 0 vs 20 (Group 1 vs 3) | Static vs dynamic (physio SS) | 101 | 27 (26.7%) | 74 (73.3%) |
| C | 1 vs 20 (Group 2 vs 3) | Patho vs physio SS | 81 | 26 (32.0%) | 55 (68.0%) |
| D | 0-BVS + drug vs 1-BVS + drug (Group 4 vs 5) | Static vs dynamic (patho SS) under BVS + drug | 56 | 11 (19.6%) | 45 (80.4%) |
| E | 0-BVS + drug vs 20-BVS + drug (Group 4 vs 6) | Static vs dynamic (physio SS) under BVS + drug | 64 | 3 (4.7%) | 61 (95.3%) |
| F | 1-BVS + drug vs 20-BVS + drug (Group 5 vs 6) | Patho vs physio SS under BVS + drug | 4 | 0 (0.0%) | 4 (100.0%) |
| G | 0 vs 0-BVS + drug (Group 1 vs 4) | BVS + drug effect in static | 23 | 17 (73.9%) | 6 (26.1%) |
| H | 1 vs 1-BVS + drug (Group 2 vs 5) | BVS + drug effect in dynamic (patho SS) | 21 | 6 (28.6%) | 15 (71.4%) |
| I | 20 vs 20-BVS + drug (Group 3 vs 6) | BVS + drug effect in dynamic (physio SS) | 42 | 18 (42.9%) | 24 (57.1%) |
Table 3. Number of differentially expressed HCAECs genes. The table shows the number of HCAEC genes modulated by the comparison of the different cell culture conditions described in table 1. Selection criteria: p < 0.01, FC ± 3.
| Case | HCAECs differential analysis | Comparison | Number of genes | DOWN | UP |
|---|---|---|---|---|---|
| A | 0 vs 1 (Group 1 vs 2) | Static vs dynamic (patho SS) | 76 | 5 (6.6%) | 71 (93.4%) |
| B | 0 vs 20 (Group 1 vs 3) | Static vs dynamic (physio SS) | 103 | 6 (5.8%) | 97 (94.2%) |
| C | 1 vs 20 (Group 2 vs 3) | Patho vs physio SS | 11 | 1 (0.9%) | 10 (99.1%) |
| D | 0-BVS + drug vs 1-BVS + drug (Group 4 vs 5) | Static vs dynamic (patho SS) under BVS + drug | 103 | 41 (39.8%) | 62 (60.2%) |
| E | 0-BVS + drug vs 20-BVS + drug (Group 4 vs 6) | Static vs dynamic (physio SS) under BVS + drug | 35 | 15 (42.8%) | 20 (57.2%) |
| F | 1-BVS + drug vs 20-BVS + drug (Group 5 vs 6) | Patho vs physio SS under BVS + drug | 13 | 7 (53.8%) | 6 (46.2%) |
| G | 0 vs 0-BVS + drug (Group 1 vs 4) | BVS + drug effect in static | 12 | 3 (25.0%) | 9 (75.0%) |
| H | 1 vs 1-BVS + drug (Group 2 vs 5) | BVS + drug effect in dynamic (patho SS) | 12 | 9 (75.0%) | 3 (25.0%) |
| I | 20 vs 20-BVS + drug (Group 3 vs 6) | BVS + drug effect in dynamic (physio SS) | 45 | 44 (97.8%) | 1 (2.2%) |
When subjected to flow conditions corresponding to 1 and 20 dyne cm−2 SS values (case A, B), HCASMCs showed a larger increase of modulated genes as compared to HCAECs (246 vs 179), with a prevalence of up-regulated ones (148 vs 11). On the other hand, the presence of BVS + drug (case D, E), generated a pronounced reduction in genes modulation in HCASMCs (246 vs 120) and HCAECs (179 vs 138): in HCASMCs, BVS + drug exerted a general trend of gene up-regulation (87.8% vs 62.0%), while in HCAECs this tendency was attenuated (58.7% vs 93.8%).
Pathological as compared to physiological SS (case C) had a deeper impact on smooth muscle cells, in which 81 genes are modulated compared to ECs (11 genes): for both, the up-regulation is prevalent, in particular in ECs that show 99.1% up-regulated genes. When BVS + drug is applied (case F), a different behavior in the two cell types is observed: in HCASMCs, BVS + drug reduces the number of modulated genes (4 vs 81), all up-regulated while in ECs the scaffold favors a small increase of modulated genes (13 vs 11) with a more balanced ratio between up- and down-regulation.
The application of BVS + drug in static condition (case G) and at the same SS values in cases H and I, leads to the following: the number of modulated genes is limited and stable in static setting and at 1 dyne cm−2, while strongly increases at 20 dyne cm−2 (case I): twofold in HCASMCs, with balanced ratio between up- and down-regulated genes (57.1% vs 42.9%), and threefold in HCAECs with a prominent down-regulation (97.8% vs 2.2%).
3.6. Selected genes for restenosis and thrombosis model
In HCASMCs, 81 genes (26 down-, 55 up-regulated) are modulated in case C (pathological vs physiologic SS in the absence of drug-eluting BVS) and only four, all up-regulated, in case F (pathological vs physiologic SS in the presence of drug-eluting BVS) as shown in figure 4.
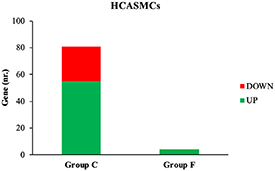
Figure 4. Number of up- and down-regulated HCASMCs genes in case C and F.
Download figure:
Standard image High-resolution imageThe gene ontology analysis between cases C and F for HCASMCs shows a single common biological process, the angiogenesis pathway (table 4) that includes SEMA3E. Specific biological processes, for case C (table 4) were positive regulation of coagulation (thrombomodulin) an positive regulation of cell cycle (insulin-like growth factor-1, epiregulin and ubiquitin carboxyl-terminal hydrolase 2 (USP2)), while, for case F (table 4), biological processes were leukocyte migration (SELE) and fatty acid metabolic process (elongation of very-long-chain fatty acids protein 7 (ELOVL7)).
Table 4. Gene Ontology biological processes in HCASMCs. Biological processes in HCASMCs exposed to pathological and physiological SS values, without (case C) and with (case F) application of BVS + drug.
| GO biological process | Gene symbol | Gene name | Case C (FC) | Case F (FC) |
|---|---|---|---|---|
| Angiogenesis | SEMA3E | Semaphorin 3E | 3.21 | 3.82 |
| Positive regulation of coagulation | THBD | Thrombomodulin | 4.73 | — |
| Positive regulation of cell cycle | IGF1 | Insulin like growth factor 1 | 3.07 | — |
| EREG | Epiregulin | 6.11 | — | |
| USP2 | Ubiquitin specific peptidase 2 | 3.62 | — | |
| Leukocyte migration | SELE | Selectin E | — | 8.43 |
| Fatty acid metabolic process | ELOVL7 | ELOVL fatty acid elongase 7 | — | 3.20 |
In HCAECs, 11 genes (1 down-, 10 up-regulated) are modulated in case C and 13 (7 down-, 6 up-regulated) in case F (figure 5).
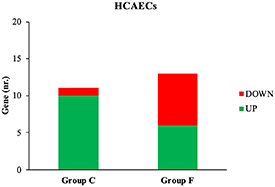
Figure 5. Number of up- and down-regulated HCAECs genes in case C and F.
Download figure:
Standard image High-resolution imageThe gene ontology analysis between case C and F for HCAECs showed a single common biological process, the blood circulation pathway (MEOX2, table 5); specific biological processes correlated with the specific aim of the work were, for case C (table 5), leukocyte migration (SELE), inflammatory response (SELE) and regulation of mitotic cell cycle (USP2), while, for case F (table 5), underlined biological processes were response to FGF (fibroblast growth factor 1 (FGF1)), cytoplasmatic vesicle membrane (frizzled class receptor 2 (FZD2)), response to lipid (Wnt family member 5B (WNT5B)) and response to insulin (FGF1).
Table 5. Gene Ontology biological processes in HCAECs. Biological processes in HCAECs exposed to pathological and physiological SS values, without (case C) and with (case F) application of BVS + drug.
| GO biological process | Gene symbol | Gene name | Case C (FC) | Case F (FC) |
|---|---|---|---|---|
| Blood circulation | MEOX2 | Mesenchyme homeobox 2 | 3.30 | 4.03 |
| Leukocyte migration | SELE | Selectin E | −3.11 | — |
| Inflammatory response | SELE | Selectin E | −3.11 | — |
| Regulation of mitotic cell cycle | USP2 | Ubiquitin specific peptidase 2 | 4.07 | — |
| Response to fibroblast growth factor | FGF1 | Fibroblast growth factor 1 | — | −3.77 |
| Cytoplasmatic vesicle membrane | FZD2 | Frizzled class receptor 2 | — | 3.09 |
| Response to lipid | WNT5B | Wnt family member 5B | — | −3.89 |
| Response to insulin | FGF1 | Fibroblast growth factor 1 | — | −3.77 |
This experimental set-up aims at in-vitro modeling of both the atherosclerotic plaque formation (C) as well as of restenosis/thrombosis after drug-eluting BVS implantation (F). The presence of a common gene between these two experimental conditions suggests a general relevance of SEMA3E (table 4) and MEOX2 (table 5) in pathological SS-induced vessel wall pathology.
3.7. Shared biological processes and common genes
The analysis was focused on the selection of genes sharing the same biological processes both between the two cell types as well as in the pathways specific to each cell type. The list of genes selected in HCASMCs (270 genes) and HCAECs (202), expressed in the conditions A–I of tables 3 and 4, generated a map of interactions, comprehensive of several biological processes.
Comparing the results, only three genes were constantly present: BMP4, HMOX1, and SELE. These genes were present in four biological processes shared by HCASMCs and HCAECs, two specific processes of HCASMCs, and two specific processes of HCAECs, as reported in table 6.
Table 6. Shared genes in HCASMCs and HCAECs associated to Gene Ontology biological processes. Main biological processes related to relevant genes previously selected from differential analysis: GO biological process shared by both HCAECs and HCASMCs (1–4) HCASMCs-specific (5, 6) and HCAECs-specific (7, 8).
| NR | GO biological process | HMOX1 | BMP4 | SELE | Samples |
|---|---|---|---|---|---|
| 1 | Epithelial cell proliferation | √ | √ | — | HCASMCs + HCAECs |
| 2 | Sprouting angiogenesis | — | √ | — | HCASMCs + HCAECs |
| 3 | Blood vessel development | √ | √ | — | HCASMCs + HCAECs |
| 4 | Regulation of phospholipase C activity | — | — | √ | HCASMCs + HCAECs |
| √ | |||||
| 5 | Leukocyte migration | — | — | √ | HCASMCs |
| 6 | Smooth muscle cell proliferation | √ | √ | — | HCASMCs |
| √ | √ | ||||
| 7 | Angiogenesis | √ | √ | — | HCAECs |
| 8 | Inflammatory response | √ | — | √ | HCAECs |
3.8. Network analysis
miRNET system was used to enhance and better understand regulatory relations that take place among the identified genes. To limit the large amount of regulators predicted targets, only confirmed by miRTarBase v8.0, TarBase v8.0 and miRecords (for miRNAs) and TransmiR v2.0 (for TFs) databases were collected [30].
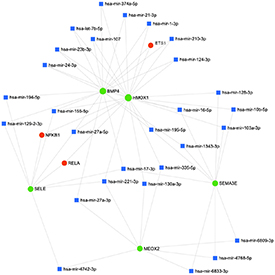
The enhanced network is depicted in figure 6 and the list of enhanced entities (TFs and miRNAs) is reported in table 7.
Figure 6. Schematic representation of the enhanced network. Green circles represent the five selected genes, blue squares represent microRNAs, and red circles represent transcription factors.
Download figure:
Standard image High-resolution image
Table 7. List of microRNA and transcription factors obtained in enhancing process.
| Node | Type | Overall function |
|---|---|---|
| hsa-mir-16 | miRNA | Cell proliferation and angiogenesis |
| hsa-mir-17 | miRNA | Apoptosis |
| hsa-mir-221 | miRNA | Cell migration, differentiation and proliferation |
| hsa-mir-155 | miRNA | Inflammation |
| hsa-mir-27a | miRNA | Cell proliferation |
| hsa-mir-195 | miRNA | Inflammation and growth factors regulation |
| hsa-mir-374a | miRNA | Cell adhesion |
| hsa-mir-21 | miRNA | Angiogenesis |
| hsa-mir-1 | miRNA | Angiogenesis |
| hsa-mir-210 | miRNA | VSMC apoptosis, EC migration, angiogenesis |
| hsa-mir-124 | miRNA | Inflammation, VSMC proliferation |
| hsa-let-7b | miRNA | Apoptosis, angiogenesis, EC proliferation |
| hsa-mir-107 | miRNA | VEGF production |
| hsa-mir-23b | miRNA | Angiogenesis |
| hsa-mir-24 | miRNA | EC proliferation, VSMC apoptosis |
| hsa-mir-194 | miRNA | Inflammation |
| hsa-mir-129-2 | miRNA | Inflammation, EC proliferation |
| hsa-mir-128 | miRNA | Cholesterol efflux and homeostasis |
| hsa-mir-10b | miRNA | EC proliferation, angiogenesis |
| hsa-mir-103a | miRNA | Glucose homeostasis |
| hsa-mir-1343 | miRNA | n.a. |
| hsa-mir-335 | miRNA | n.a. |
| hsa-mir-130a | miRNA | Proliferation, angiogenesis |
| hsa-mir-6809 | miRNA | n.a. |
| hsa-mir-4768 | miRNA | n.a. |
| hsa-mir-6833 | miRNA | n.a. |
| hsa-mir-27a | miRNA | Proliferation |
| hsa-mir-4742 | miRNA | n.a. |
| ETS1 | Transcriptional factor | Angiogenesis, EC migration, inflammation |
| NFKB1 | Transcriptional factor | Inflammation, cholesterol transport |
| RELA | Transcriptional factor | NFKB regulation |
The proposed enhanced network shows the interaction of the five genes, further enlarging the set of regulations and highlighting the presence of common regulatory motif composed by TFs and miRNAs, that possibly finely tune the pathway behavior.
4. Discussion
In the present study, human coronary vascular cells (HCASMCs and HCAECs) were used, to study the effect of drug-eluting BVS on gene expression and identify differentially expressed genes as potentially related to the molecular pathway of restenosis and thrombosis, after application of BVS to vascular cells. HCASMCs and HCAECs were cultured in static and dynamic (SS of 1 and 20 dyne cm−2) conditions, with and without BVS and drug: 1 and 20 dyne cm−2 are representative, the first, of a pathological disturbed flow and, the second, of physiological flow conditions [31, 32]. Vascular cell RNA was isolated and the transcriptomic profile was analyzed. Comparing different cell culture conditions and with the support of GO analysis, a group of genes related to neointima formation, angiogenesis, thrombosis, and inflammation were highlighted.
Genes selected by transcriptomic analysis (BMP4, HMOX1, SELE, SEMA3E, MEOX2) have been previously analyzed for their role, at different levels, in vascular disease development but no integrated approach as described in this article, has been ever reported, nor applied to evaluate BVS interaction with vascular cells so far.
From a toxicological point of view, cell viability is preserved above 80% after 6 h and decreasing below 80% after 24 h at high concentration levels (figure 2), confirming results of literature [27].
Focusing on the PCA and hierarchical distribution of samples in transcriptomic analysis, the presence of BVS + drug seems to operate a strong phenotype modulation in particular when cells are cultured in dynamic conditions.
Starting from a general, comprehensive point of view, the higher number of modulated (mostly up-regulated) genes in HCASMCs (537 genes) compared to HCAECs (410 genes) in all the experimental settings can be explained by the specific cell physiological roles. Indeed, ECs are naturally exposed to the SS produced by blood flow, while smooth muscle cells are not directly exposed to shear forces thus they can be more sensible to this mechanical stimulation. This fact can explain the higher number of modulated (mostly up-regulated) genes in HCASMCs compared to HCAECs. In addition, BVS + drug application effects more the gene expression of both cell types when cultured in dynamic conditions.
A more specific analysis of the modulated pathways in the different experimental conditions allowed the underlining of a restricted number of genes and among these of interest SEMA3E, significantly up-regulated in HCASMCs, and MEOX2, up-regulated in HCAECs.
Semaphorins are a family of proteins originally discovered as axon guidance [33], among them, SEMA3E interacts with its receptor, plexinD1, regulating migration and inhibiting EC proliferation [34]. Inactivation of PlexinD1 in mice embryos leads to congenital heart diseases, absence or atresia of left carotid arteries and less VSMCs coverage of aortic arch arteries [35]. Wu et al showed how the expression of SEMA3E in VSMCs is progressively decreased during neointimal hyperplasia and is down-regulated in human atherosclerotic arteries while the replenishment of SEMA3E caused a significant reduction of neointimal hyperplasia [21].
Homeobox genes are TFs that regulate normal development, phenotype cell identity and control primary cellular processes [36]. MEOX2 encodes a TF expressed both in smooth muscle and ECs and it has been suggested as master regulatory gene for the angiogenic phenotype [37]. MEOX2 expression, maximal in quiescent ECs but rapidly down-regulated in response to serum and proinflammatory factors, inhibits EC proliferation and angiogenesis [38].
Among the biological processes shared by HCASMCs and HCAECs, three genes are constantly up-regulated in pathological SS, thus pathological conditions: BMP4, HMOX1 and SELE.
BMPs are members of the TGF-β superfamily. BMP4, together with BMP2, has been shown to play an essential role in cardiovascular physiology and pathophysiology [39] angiogenesis, neointima formation and development of pulmonary hypertension [23]. Studies suggest that BMPs are up-regulated at atheroprone regions in blood vessels and may contribute to vascular calcification and the development of atherosclerotic plaques [40]. Because BMP4 elicits endothelial activation and dysfunction, hypertension, and vascular calcification, inhibition of BMP4 expression by SS is likely to exert antiatherogenic and vasculoprotective effects.
Heme oxygenase catalyzes the oxidative degradation of Heme into biliverdin, carbon monoxide, and free iron [41]. It is mainly represented by an inducible isoform, HMOX1, that plays a cytoprotective role in modulating tissue responses to injury [42]. Activation of HMOX1 in ECs is crucial for pro-angiogenic response to VEGF since pharmacological inhibition of HMOX1 or knockout of HMOX1 gene impair proliferation, migration, and angiogenic potency of VEGF-stimulated ECs [43]. However, the role of HMOX1 in angiogenesis depends on the underlying conditions since, for example, the inflammation-induced blood vessel formation is attenuated, whereas VEGF-driven non-inflammatory angiogenesis is facilitated by HMOX1 [44]. Expression of HMOX1 in atherosclerotic lesions, its ability to inhibit VSMC proliferation and to exert anti-inflammatory, antioxidant, and antithrombotic effects suggest a protective role during atherogenesis [45]. Furthermore, HMOX1 in ECs exposed to oscillatory flow is markedly attenuated [46].
Hematopoietic cells, as well as ECs, express three known types of selectins: SELP, SELE and SELL [47]. These adhesion molecules mediate rapid on-off interactions and it has been suggested that SS may activate some selectin-mediated events, which lead to 'tethering' or short-lived adhesion between cells [48]. SELE is primarily expressed by activated ECs following inflammatory stimuli [49].
In order to evidence potential correlation among these genes we integrated network enhancing analysis to point up miRNAs and TFs involved in underlined pathway modulation.
Figure 6 summarizes the results obtained. The enhancing process added to the network 30 new interactors (3 TFs and 27 miRNAs) (table 7), each of them has been assessed to evaluate its role. Interestingly, several of the regulators appear strongly related to the cell proliferation and angiogenesis. The TFs, appeared in the network, seem to link different pathways and factors: in particular, ETS1, RELA and NFKB1 (these last two often associate in a complex), have been described having pivotal roles in vascular inflammation and EC and VSMC activation [50–53]. The 28 miRNAs present different multiple functions, in particular: nine are involved in proliferation, seven in angiogenesis, five in inflammatory response, four in apoptosis, six in other function (glucose homeostasis, VEGF production, cholesterol efflux and homeostasis, cell migration, differentiation, cell adhesion) and finally, for the remaining six no specific function was currently defined. Interesting, among the miRNAs, three of them (miR-16, miR-155 and miR-195) are involved in the regulation of inflammatory pathways related to atherogenesis [54–56]. Moreover, miR-155 seems to be responsible of the destruction of tight junctions and endothelial barriers enhancing atherosclerotic progression and inhibiting re-endothelialization [55].
Finally, mir-221 is also implicated in maintaining endothelial integrity and in atherosclerotic vessels it activates VSMCs towards the 'synthetic' pathological phenotype [57].
5. Conclusion
ISR and ST, caused by stent procedures, represent a major clinical problem. A better understanding of the underlying and causative mechanisms responsible for initiating and sustaining such detrimental effects on the coronary bed is needed to prevent these drawbacks.
The results of this study suggest that the phenotypic environment of cells under combination of BVS + drug and hemodynamic disturbed flow conditions could lead to a hyperplasic and pro-atherogenic (SEMA3E, BMP4), pro-inflammatory (MEOX2), impaired vascularization (MEOX2, HMOX1) and pro-adherent condition (SELE). Furthermore, a moderate pro-adherent platelet phenotype and pro-thrombotic (HMOX1) environment associated with BVS + drug and low ESS suggested the necessity for an intensive antiplatelet treatment following stent deployment in clinical practice.
The novelty of this study consists, as first work in literature of this type on BVS, in the evaluation molecular effects of vascular scaffolds on the separate main cellular components of arterial wall: our transcriptomic approach allowed the identification of potential gene and miRNA networks able to explain the mechanisms involved in the disease onset and development.
The combined evaluation of SS and everolimus-eluting BVS application to in-vitro cell cultures shed light on the biological mechanisms and the leading molecular actors involved in the development of restenosis and thrombosis associated to stent deployment.
5.1. Study limitations
The experimental nature of this work requires further clinical studies to quantify how the genes as well as their related proteins are expressed in the plasma of patients before exploiting these molecules as potential candidate biomarkers of IR and ST in revascularized patients treated by BVS.
Besides some methodological drawbacks, our approach was commonly used in similar in-vitro studies and the profile of the selected panel of genes should be tested in pathological tissue-derived vascular cells as further confirmation. Furthermore, the aim of this work was to evaluate BVS as the most promising approach thus different types of stents, mainly the commonly used DES, have not been tested. For this reason, information whether the same genes are modulated in different stents are currently not available.
A major outcome of this work is the deduction that the implemented in-vitro experimental model of HCAECs and HCASMCs is methodologically reliable and adequate to investigate the underlying cellular mechanisms of in vivo stent complications. Differential analysis of the experimental conditions tested allowed the identification of 537 genes significantly modulated in HCASMCs (179 down- and 358 up-regulated), and 410 in HCAECs (131 down- and 279 up-regulated). Flow SS has a more significant impact on SMCs compared to ECs (81 vs 11 modulated), as expected from their biological role. The three-step workflow of differential analysis of transcriptomic results highlights the relevance in pathological conditions of MEOX2 (EC proliferation, angiogenesis and inflammation), SEMA3E (VSMC migration and proliferation), BMP4 (angiogenesis), HMOX1 (inflammation, thrombosis) and SELE (leukocyte migration).
Acknowledgment
We would thank IGA Technology for their support in transcriptomic and data analysis.
Data availability statement
The data that support the findings of this study are openly available at the following URL/DOI: www.ncbi.nlm.nih.gov/geo/query/acc.cgi?acc=GSE139292.
Funding
This study was supported by the European Union's Horizon 2020 research and innovation programme under Grant Agreement No. 777119 (InSilc project). This article reflects only the author's view and the Commission is not responsible for any use that may be made of the information it contains.
Conflict of interest
The authors declare that they have no conflict of interest.