
Abstract
Development of robotic exoskeletons to assist/enhance human locomotor performance involves lengthy prototyping, testing, and analysis. This process is further convoluted by variability in limb/body morphology and preferred gait patterns between individuals. In an attempt to expedite this process, and establish a physiological basis for actuator prescription, we developed a simple, predictive model of human neuromechanical adaptation to a passive elastic exoskeleton applied at the ankle joint during a functional task. We modeled the human triceps surae–Achilles tendon muscle tendon unit (MTU) as a single Hill-type muscle, or contractile element (CE), and series tendon, or series elastic element (SEE). This modeled system was placed under gravitational load and underwent cyclic stimulation at a regular frequency (i.e. hopping) with and without exoskeleton (Exo) assistance. We explored the effect that both Exo stiffness  and muscle activation
  had on combined MTU and Exo (MTU + Exo), MTU, and CE/SEE mechanics and energetics. Model accuracy was verified via qualitative and quantitative comparisons between modeled and prior experimental outcomes. We demonstrated that reduced
  can be traded for increased
  to maintain consistent MTU + Exo mechanics (i.e. average positive power
  output) from an unassisted condition (i.e.
  ). For these regions of parameter space, our model predicted a reduction in MTU force, SEE energy cycling, and metabolic rate
  , as well as constant CE
  output compared to unassisted conditions. This agreed with previous experimental observations, demonstrating our model's predictive ability. Model predictions also provided insight into mechanisms of metabolic cost minimization, and/or enhanced mechanical performance, and we concluded that both of these outcomes cannot be achieved simultaneously, and that one must come at the detriment of the other in a spring-assisted compliant MTU.
Export citation and abstract BibTeX RIS
Introduction
In the last two decades, significant progress has been made towards developing functional wearable robotic devices to assist/enhance human locomotion [1]. The majority of these devices rely on powered actuation to effectively assist the wearer through a conventional rigid [2–7] or (more recently) soft/elastic [8] robotic interface. Unfortunately, powered devices are either restricted to a laboratory setting [4, 6, 7], or carry a significant added mass penalty [2, 3, 5, 8], which offsets most, if not all, of the mechanical/energetic benefit the device may provide. Recently, however, there has been a shift towards development of unpowered passive (i.e. spring driven) exoskeletons, as these devices can provide increased limb/joint stiffness/torque with minimal added mass penalty [9–11].
The rationale underlying application of springy actuators for locomotion assistance is not limited to decreasing device weight and power consumption, it also makes sense from a mechanical perspective. Humans employ 'bouncing' gait patterns during walking, running, and hopping; and it has been demonstrated that the center of mass mechanics in each of these modes of gait can be predicted by treating the leg as a simple spring-loaded inverted pendulum [12–15]. Elastic mechanics are not exclusive to the whole limb behavior, and there are multiple reports of muscle level mechanics that facilitate energy storage and return in series compliant tissues (e.g. tendon and aponeurosis) spanning the ankle joint during walking [16–20], running [16–19], hopping [21, 22], and bouncing [23, 24]. Given the spring-like behavior at the whole limb and joint level, passive exoskeleton actuation is uniquely well-suited to integration with existing limb mechanics.
There have been several studies that illustrate the effectiveness of springy actuators for assisting functional movement [21, 22, 25–27]. Grabowski and Herr [26] demonstrated that a spring-actuated exoskeleton spanning all three joints of the lower limb could reduce the metabolic demands of hopping in place. Their study participants achieved this by reducing biological contributions to limb stiffness and utilizing the parallel springs for energy storage and return; all while keeping center of mass and whole-limb plus exoskeleton mechanics consistent with limb mechanics observed during unassisted hopping [26].
Similar studies conducted with springy exoskeletons spanning only the ankle demonstrated that this effect scales, and that humans modulate muscle activation and biological stiffness to maintain joint-level and whole limb stiffness [27]. Plantar-flexor muscle groups generally decreased activation levels when assistance was provided by a wearable device, thereby reducing force production [21, 22, 25, 27]. This ultimately affects the function of series compliant tissues (e.g. tendon, aponeurosis) known to cycle large amounts of energy during bouncing gait [12, 16–20, 23, 28, 29].
A recent muscle-level ultrasound study demonstrated that a spring assisted exoskeleton facilitated decreased soleus muscle force production in conjunction with increases in soleus fascicle excursion [22]. This had a net effect of maintaining a constant level of muscle average positive mechanical power  output. The Achilles tendon, however, experienced a large decrease in energy cycling which ultimately resulted in reduced MTU
  [22]. Despite this, it has been demonstrated that these 'detuned' mechanics can result in reduced metabolic rates [21, 22]. These reductions only hold to a point, though. As Grabowski et al demonstrated, more exoskeleton stiffness can decrease (or even eliminate) the metabolic benefits of a spring-actuated exoskeleton [26].
While it is clear that some exoskeleton assistance can be beneficial [21, 22, 26], and too much can be counterproductive or even detrimental [26], very little has been done to examine how muscle architecture and system mechanics can be optimally assisted by a springy actuator. For this to be possible, a broader understanding of how exoskeleton stiffness  impacts neuromechanical and energetic function at the muscle level is required. With this in mind we present a simplified model of the triceps surae–Achilles tendon complex with parallel spring-actuated assistance during simulated human hopping. Based on previous findings from human studies, we predicted our model would (1) be able to trade reduced muscle activation for increased
  to maintain system (i.e. MTU + Exo) level stiffness and
  production [27]. Given constant MTU + Exo
  output but increasing spring stiffness, we predicted (2) increased
  output from the Exo component, as well as decreased output from the MTU and SEE components of the biological system would occur with increasing
  [21, 22, 25, 26]. Despite reductions in loading of biological components with increasing
  , we hypothesized that (3) the contractile element (CE) would maintain constant
  output by increasing its excursion in conjunction with reduced force [22]. Finally, we predicted that (4) these changes in system and component level mechanics would ultimately result in a reduced metabolic expenditure when springy assistance is provided [21, 22, 26].
Methods
Hopping as a model of functional ankle mechanics
We chose to model hopping in this study because it is a primarily ankle driven mode of bouncing gait that is simple both mechanically, and from a neural control perspective [21, 30]. Despite its inherent simplicity, however, hopping captures one of the critical features of all bouncing gait: the ability to store and return energy in series tendon at distal joints [22, 23]. Using hopping as a model of functional ankle joint mechanics allowed us to ask fundamental questions concerning the impact of passive exoskeleton assistance on the mechanics and energetics of biological muscle–tendon unit in a simple, straightforward way. Finally, hopping comes with a wealth of experimental whole limb [26, 27], joint-level [21, 25–27], muscle level [22], electromyographic [21, 22, 25], and metabolic [21, 22, 26] data to compare model predictions against.
Biological muscle tendon unit model
Our modeled muscle–tendon unit (MTU) consisted of a single Hill-type CE subject to nonlinear force–length (F–L) and –velocity (F–V) actuation dynamics (figure 1); as well as first order activation dynamics. It also had a parallel elastic element capable of generating passive force at lengths greater than  , the length at which active muscle produces its peak isometric force [31] (figure 1). Parameterization of normalized F–L characteristics was based on experimental observation in Rubenson et al [32]. Normalized F–V and first order activation dynamics were based on parameterized equations from Haeufle et al [33]. Tendon/series elastic element (SEE) dynamics were modeled based on observations from Lichtwark et al [18], and exhibited a nonlinear 'toe' region, after which dynamics can be approximated as linear. All model equations and parameter values used here are detailed in supplementary text.
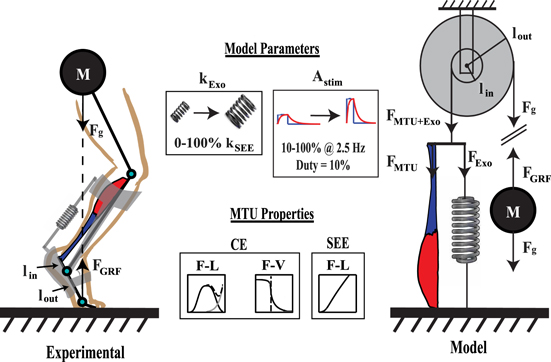
Figure 1 Experimental (left) and modeled (right) exoskeleton assisted human hopping. Range of stimulation and exoskeleton parameters explored here (top), as well as CE/SEE actuation properties (bottom) are indicated in boxes. The Astim parameter acts on biological muscle, and  is the stiffness of the modeled parallel passive exoskeleton.
Download figure:
Standard image High-resolution imageInertial environment
System inertial mechanics were modeled by assuming a single rigid attachment point of the biological MTU and exoskeleton (Exo) system to lever arm acting with a fixed mechanical advantage (i.e. pulley) on a point mass under constant gravitational load. This was meant to reflect loading experienced by the triceps surae–Achilles tendon complex at the ankle joint during human hopping (figure 1). Rationale and justification for using this simplified inertial environment are discussed further in Robertson et al [34].
Model simplifications
Several key simplifications were made to facilitate implementation of this modeling framework. First, the gastrocnemii and soleus muscle of the triceps surae–Achilles tendon complex were lumped into a single, mono-articular, fusiform muscle. This facilitated use of a simplified limb geometry, and disregards complications that arise from having biarticular and bipennate (i.e. non-fusiform) gastrocnemii muscles (figure 1). While, based on physiological cross-sectional area (PCSA), soleus is the primary force producer within the triceps surae muscle group, these simplifications likely diminished the potential impact that gastrocnemii operating point and architecture played in governing adaptation at the ankle and knee in humans during spring assisted hopping [21, 22]. Secondly, our system operates with a fixed mechanical advantage, disregarding shifts in biological moment arm length that can occur in vivo [35, 36]. Finally, all muscle fibers were assumed to have identical activation/deactivation time constants ( and
and  respectively), and values used in first order activation dynamics are a weighted average of observed values based on muscle PCSA in cadavers [37–39]. Further justification of model simplifications can be found in Robertson et al [34].
Modeled exoskeleton
Our model of human hopping with exoskeleton assistance had a linear tension spring in parallel with the biological MTU (figure 1). The slack length of our modeled exoskeleton was the combined length at which the inactive CE developed passive force  , and slack length of SEE complex
  . The exoskeleton moment arm length is the same as that of the biological MTU
  [37]. This was done to simplify scaling of relative Exo/MTU stiffness relationships explored in this study. We note that stiffness comparisons can be extended to systems where exoskeleton and biological moment arms are not equal by converting linear stiffness
  to rotational stiffness
  using the following relationship

where  is rotational stiffness,
  is linear stiffness, and
  is the distance from the point where force is applied to the center of joint rotation (i.e. moment arm) (figure 1). Finally, transmission of assistive forces was presumed to be ideal, and no attempt was made to model interaction of rigid exoskeleton with soft tissue.
Experimental protocol
The model stimulation frequency  was 2.5 Hz, a frequency at which metabolic cost was consistently reduced in human experiments examining exoskeleton assisted hopping [21, 22, 26].
  was varied in
 increments from unassisted
  to that of biological tendon
  , corresponding to joint level stiffness during perfectly isometric unassisted hopping (i.e.
  ). Stimulation was provided as a square wave pulse with 10% duty relative to
  (i.e.
(i.e.  ). This pulse was subject to first order activation dynamics exhibited by biological muscle [31]. Stimulation amplitude
  ranged from 10% to 100% of maximum possible. All modeled conditions were run for 15 s (∼37 hops) to allow time for the system to become stable and cyclic. For each
  combination, the final 4 complete hopping cycles were used in all subsequent analysis. Parameter values and equations used in model implementation are detailed in supplementary material.
Experimental metrics
The major criterion for a simulation to successfully 'hop' included having a flight phase where the MTU + Exo system went slack, and the only force applied to our virtual mass was gravity (i.e.  ). Potential risk of injury was also taken into account as part of determining a successful hop, and normalized peak CE strains
  > 0.3 were assumed to pose significant risk of injury based on reports from literature [40–42].
  was computed as follows
where the cycle period  and
and  was CE length as a function of time. Finally, successful hopping was required to be cyclic with stimulation, and show no variance when subjected to the integrated return map method detailed in [34].
Once it had been determined that a given condition meets the criterion for hopping in a safe and effective manner, system and component level analysis of mechanics and energetics was performed. First, we determined average positive power over a cycle of hopping for the system (i.e. MTU + Exo) and its respective mechanical components (i.e. MTU, active/passive CE, SEE, Exo) as follows
where
In other words, power output was positive for shortening (i.e. work done against gravity).
Next, we explored system peak force  over a cycle of hopping
where  is MTU + Exo force as a function of time, and
  is the time point within a cycle where peak system (MTU + Exo) force occurs. We were also interested in how the MTU, Exo, and active/passive CE components shared loads at
  and computed their respective forces as well.
We were also concerned with how CE F–L and F–V dynamics influenced system mechanics, so we computed the range and average operating strains/velocities from stimulation onset (muscle activation,  ) to the initiation of flight
  . Note that this does not include any passive stretch prior to stimulation onset, and only encompassed portions of ground contact where active muscle was likely to make significant contributions.
We were also interested in system energetics, and calculated average metabolic rate  using a dimensionless model of metabolic cost [43, 44] as a function of muscle velocity scaled by physiological constants
  (the maximum active isometric CE force),
  (maximum CE shortening velocity), (supplemental text table 1), and normalized muscle active state
  [45].
[45].  was computed as follows

where  is dimensionless metabolic cost at time
  from [1] (supplemental text table 2). MTU + Exo, MTU, and CE apparent efficiency
  were also a focus of this study, and were computed as follows based on their respective
  output

Further details on equations, metrics, and constants used as part of model implementation and subsequent analysis can be found in supplementary text.
Comparison to experimental data
Experimental data used in all quantitative comparisons made here were taken from Farris et al [21]. Exoskeleton rotational stiffness used in experimental conditions was  which, when scaled by our modeled biological 'in' moment arm
  [37] and converted to
  yields
  . We constrained our selection of points based on experimental conditions (i.e. unassisted/
 and assisted/
 ), and matched MTU + Exo and MTU average positive power to experimental data for the whole ankle joint with and without an exoskeleton [21]. We selected these two metrics as a basis for comparison because our simplified model does not have the necessary geometric/physiological complexity for quantitative comparisons to muscle level data observed in [22].
Results
Stability, injury risk, and flight phase
For all modeled conditions, stable and cyclic mechanics were easily achieved within the time allotted, and the final 4 cycles used in analysis are all representative of steady-state behavior. Significant risk of injury was observed for low  , low
, low  combinations. These regions exhibited CE peak eccentric strains > 0.3 at some point in their hopping cycle (figure 2(A)) [40–42].
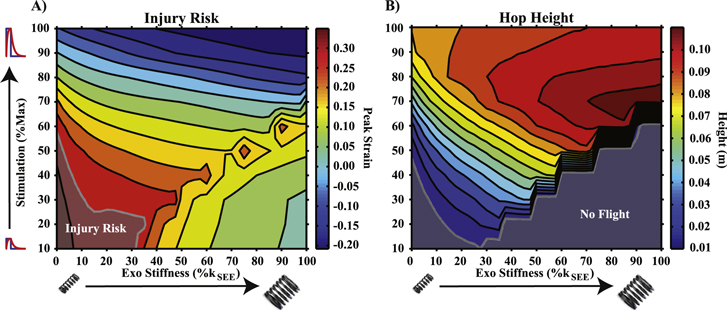
Figure 2 (A) Contour of peak eccentric strain over a cycle of hopping. Regions exceeding a value of 0.3 or greater were indicated by opaque region labeled 'injury risk.' (B) Contour of peak height achieved over a cycle of hopping. Regions where flight height ≈0 were indicated by the opaque region labeled 'no flight.'
Download figure:
Standard image High-resolution imageA flight phase was achieved for the majority of the parameter space, with notable exceptions for low  (< 20% of max) low
  (< 20%
 ) combinations, as well as low-to-medium
  (< ∼ 50% of max) and high
 conditions. The greatest flight amplitude was observed at 70%
  and high
  (> 70%
 ) conditions (figure 2(B)).
Regions where elevated injury risk or no flight phase were observed are indicated by opaque regions labeled 'Injury Risk' and 'No Flight' in figures 2(A) and (B) respectively and all subsequent contour plots (figures 3(A), (C) and 6(A)–(C)).
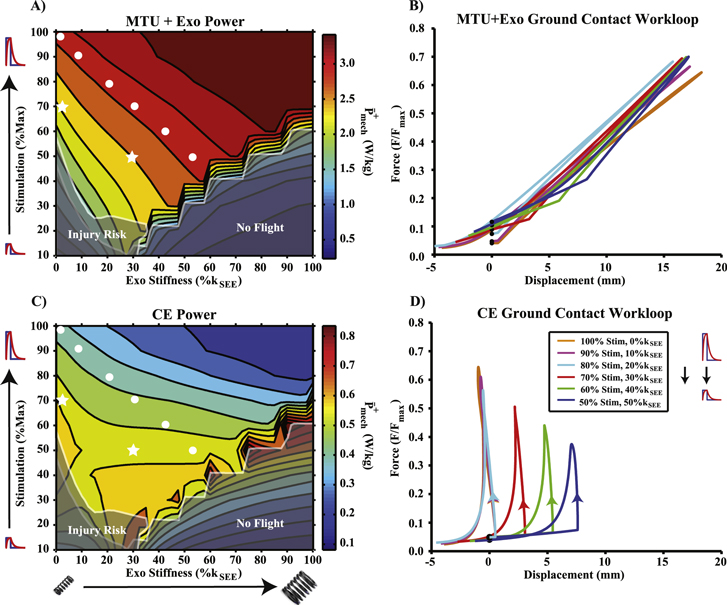
Figure 3 (A) Average positive power output for the combined MTU + Exo system. White dots in this and all subsequent contour plots indicate points in parameter space of equivalent MTU + Exo positive power. Stars represent points that correspond to joint level mechanics observed in [22]. Note that there were several contours which trade stimulation amplitude for Exo stiffness to achieve constant MTU + Exo positive power output. (B) Workloops during ground contact (i.e.  ) for points in parameter space indicated by white dots in (A). The force–displacement profile (i.e. 'stiffness') in each case was nearly identical. (C) Contour plot of average positive power produced by the CE (active + passive). (D) CE workloops during ground contact for points in parameter space indicated by white dots. Positive power remained nearly constant by trading decreased force output for increased excursion.
Download figure:
Standard image High-resolution imageAverage positive power
Maximal MTU + Exo  was generated for high
  , high
  conditions (figure 3(A)). Minimums in MTU + Exo
  were generally observed for low stimulation amplitudes regardless of
  (figure 3(A)). Data points from a contour of constant Exo + MTU
  spanning 100%
  with no exoskeleton (i.e.
  ) through 50%
  and an
  (i.e.
(i.e.  ) were selected for further analysis, and are indicated by white dots in all subsequent contours (figure 3(A)). MTU + Exo workloops from data during ground contact were generated for these selected points and are visualized in figure 3(B).
In general, CE  was highest for low
  /high
/high  combinations along the border of the 'no flight' region (figure 3(C)), and lowest for high
  conditions where a flight phase was safely achieved (figure 3(C)). Ground contact CE workloops for selected points from figure 3(A) are visualized in figure 3(D).
Force and power sharing
Selected points of constant MTU + Exo  (figure 3(A)) traded energy cycled in biological tendon for energy cycled in the modeled exoskeleton, dramatically reducing
  and
and  from the biological MTU (figure 4). Maintaining constant MTU + Exo
  as in figure 3(A) required a slight increase in MTU + Exo
  while simultaneously decreasing the force burden on the biological MTU (figure 4(A)). Despite reduced
  with increased
  for selected data points, there was a small increase in contributions to
  from passive CE components (figure 4(A)). This had little effect on CE
  , which remained nearly constant for these same points in parameter space. CE power actually increased slightly from baseline (unassisted,
  ) to high
  , low
, low  conditions for selected points of constant MTU + Exo
  (figure 4(B)).
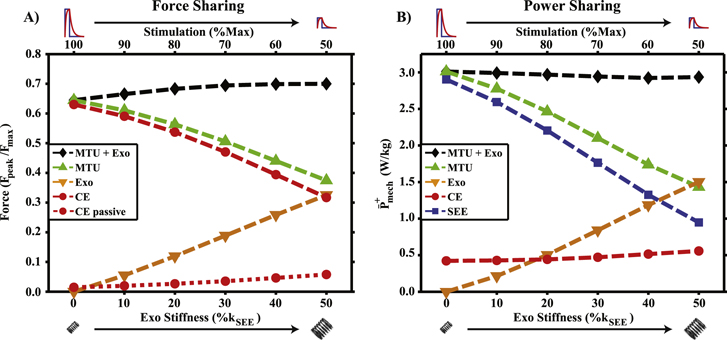
Figure 4 (A) MTU + Exo peak force and system component contributions for points indicated by white dots in figure 3(A). Biological components are unloaded as Exo contributions rise in conjunction with increased passive contributions from CE. (B) Average positive power output from MTU + Exo and it components for the same points as in (A). System level power remains constant by trading MTU/SEE power output for energy cycled in Exo, while CE positive power remains nearly constant.
Download figure:
Standard image High-resolution imageForce–length and force–velocity dynamics
Force–length (F–L) and –velocity (F–V) operating points during active force production for data points selected in figure 3(A) can be seen in figure 5. As  decreased and
  increased, the modeled CE increased its range of operating lengths as well as average values of both operating length and velocity (bars, figure 5). Average operating strain increased from approximately 0.9-1.15
 (∼4.9–6.3 cm) (markers, figure 5(A)), while average operating velocity more than doubled from ∼0.07 to 0.16
  (∼3−7 cm s−1) (markers, figure 5(B)).
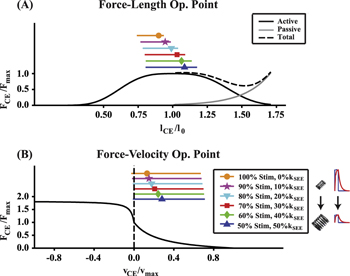
Figure 5 (A) CE force–length operating point for points in parameter space indicated by white dots in figure 3(A). (B) CE force–velocity operating point for white dot points in figure 3(A). In both figures, markers indicate average operating point, and bar indicates range of operating points. Both average and range of force–length and –velocity operating points increases as stimulation amplitude was decreased and Exo stiffness was increased to maintain constant MTU + Exo average positive power output.
Download figure:
Standard image High-resolution imageMetabolic rate and efficiency
Average metabolic rate scaled almost directly with  /integrated muscle activation (figure 6(A)), but there was a slight increase in
  when
when  was held constant and
  was increased (figure 6(A)). For the data points of constant MTU + Exo
  selected in figure 3(A),
  decreased with decreasing
  and increasing
  (figure 6(A)).
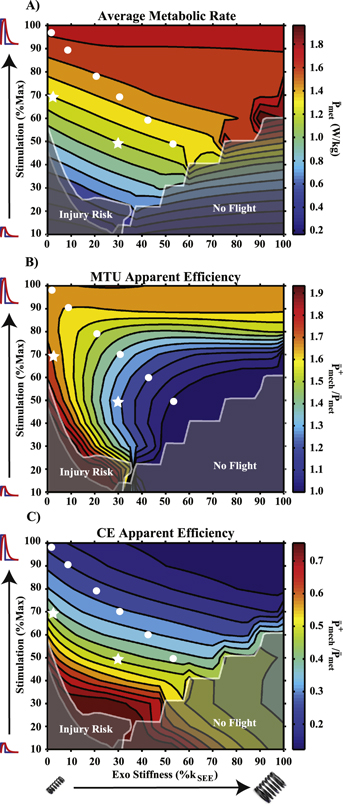
Figure 6 (A) Average metabolic rate for the modeled CE. Stimulation amplitude was the primary factor governing metabolic cost, as indicated by horizontal contours. (B) Contour plot of MTU apparent efficiency. Note that any application of exoskeleton assistance resulted in reduced apparent efficiency except for stimulation amplitudes ≥90%. (C) Contour plot of CE apparent efficiency (passive + active). In general, decreased stimulation amplitude increased CE apparent efficiency, and adding exoskeleton stiffness decreased CE apparent efficiency.
Download figure:
Standard image High-resolution imageMTU  decreased with decreasing
  except in low-to-no
  conditions (figure 6(B)). MTU
  also decreased as
  increased unless
  was ≥90% of maximum, at which point it increased slightly from unassisted (figure 6(B)). For the data points selected in figure 3(A), MTU
  declined rapidly with decreasing
  and increasing
  (figure 6(B)).
CE  (active + passive components) generally decreased with increasing
  , and increased with decreasing
  (figure 6(C)). For the data points selected in figure 3(A), CE
  increased with decreased
  and increased
  (figure 6(C)).
Experimental comparison
An MTU  of ∼2.4 W kg−1 was observed for the 60%
  ,
,  condition, and output ∼1.7 W kg−1 was observed for the 50%
 , 30%
, 30% (i.e.
(i.e.  ) condition, matching findings for whole ankle
  in a single limb from previous human studies [21] (figure 7(A)). These conditions are highlighted on most contour plots by a white star (figures 3(A), (C) and 6(A)–(C)), and compared directly in figure 7. Similarities between experimental and modeled conditions include little to no change in
  for the CE, large reductions in
  for both the SEE and whole MTU, with a considerably greater fraction of MTU
  coming from the CE (figure 7(A)), and a reduction in
  (figure 6(A)) when springy assistance was provided. There were also strong qualitiative similarities in the time-course of MTU/MTU + Exo force production and MTU/CE excursion dynamics during ground contact (figures 7(B), (C)). The major difference between modeled/experimental data had to do with rate of force onset/offset (figure 7(B)) and CE excursion (figure 7(C)) in late/early stance.
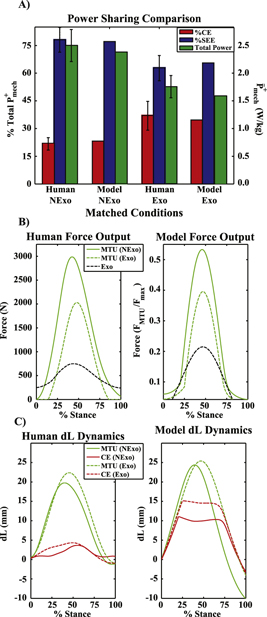
Figure 7 (A) Comparison of Exoskeleton (Exo) and No Exoskeleton (NExo) conditions from [22] with appropriately matched model conditions (stars in figures 3(A), (C) and 6(A)–(C)). The left axis indicates percent contribution from CE/SEE to total MTU  . The right axis is total ankle joint/MTU
  for experimental and model studies respectively. Note that an error bar indicating ±1 SEM is on all experimental data, and that matched model data fell easily within this range of values. (B) Human (left) and model (right) force versus % stance for matched (star) conditions. Note comparable timecourse of force production for NExo and Exo conditions, as well as reduced peak MTU force when exoskeleton assistance was applied. (C) MTU and CE excursion during stance for experimental (left) and matched model (right) Exo and NExo conditions. Note that both show increased MTU and CE excursion for the Exo condition due to increased CE excursion in early stance, as well as a shift in the timing of peak MTU length relative to stance time.
Download figure:
Standard image High-resolution image
Discussion
The intention of this study was to use a simple neuromechanical model to understand the impact of springy exoskeleton assistance at the ankle joint. Model predictions agreed well with observation from experimental studies, and provided ample insight into muscle-level mechanisms of neuromechanical and energetic adaptation during spring-assisted hopping [21, 22, 25–27]. Based on model results, we were able to provide general insight into factors influencing system performance, as well as limitations on the benefits a passive device can ultimately provide.
MTU + Exo mechanics
Based on observations from previous experimental studies we hypothesized that by increasing exoskeleton stiffness and reducing stimulation amplitude, our model system (MTU + Exo) would be able to maintain a constant  output and 'stiffness' from an unassisted condition [21, 25–27]. Model findings agreed with this hypothesis, and it was possible to start at any stimulation level ≥60% without exoskeleton assistance, and maintain
  production by decreasing
  and increasing
  (figure 3(A)). By following any one of these contours, it was observed that there were nearly identical force–displacement (e.g. 'stiffness') dynamics during stance as demonstrated by MTU + Exo workloops from selected points in figure 3(A) (figure 3(B)).
MTU and SEE mechanics
Our second hypothesis was that, by following a contour of constant MTU + Exo  , there should be reduced MTU forces at
  as well as a decrease in SEE and MTU contribution to MTU + Exo
  [21, 22, 25–27]. By examining figure 4, it can be seen that this is indeed the case. As
  was increased and
  decreased, contributions to peak MTU + Exo force from MTU were reduced, while those from Exo increased (figure 4(A)). A similar trend emerges for power sharing, where reductions in MTU/SEE
  were offset by increased output from the Exo (figure 4(B)). Given that the ankle plantar flexor muscle groups depend primarily on inertial dynamics and elastic energy cycling as a means for joint level
  generation [16, 22, 23], it follows that reduced loading results in reduced
  production in the SEE and MTU as a whole.
Muscle mechanics
Our third hypothesis predicted that, in spite of reduced biological loading, average positive power in the CE would remain constant. The predicted mechanism by which this would occur was increased excursions in conjunction with reduced CE forces, which would result in nearly constant CE average positive power production [22]. By examining figure 4(B), it can be seen that, as  was decreased and
  increased, CE
  remained nearly constant, and even increased slightly for
  conditions (figures 3(C) and 4(B)). Our model also predicted that this occurred in conjunction with reduced biological loading (figure 4(A)) as well as increased CE excursion (figures 3(D) and 5(A)) and average operating velocity (figure 5(B)) in full agreement with hypothesis (3). Increased excursions also occurred in conjunction with greater values of
  , many of which were
  (i.e.
(i.e.  ) (figures 2(A) and 5(A)), resulting in passive CE force generation (figure 4(A)). This coupling of force generation to CE length also played a role in keeping CE
  at near constant levels (figure 4(B)).
Energetics of assisted hopping
For our fourth and final hypothesis, we predicted that by following a contour of constant MTU + Exo  it would be possible to reduce
  from the unassisted condition [21, 26]. Following the contour of white dots from figure 3(A), increasing
  required a reduction in
  , which was the primary determinant of
  for our modeled data (figure 6(A)). This was in spite of greater average operating velocities (figure 5(B)), and no reduction in
  output from the CE (figures 3(B) and 4(B)).
Contours of constant MTU + Exo  in figure 3(A) all ran into the same problem as
  increased and
  decreased: there came a point where the system was no longer capable of hopping. In these conditions, the mechanical response of biological and exoskeleton model components to cyclic stimulation was such that they counteracted each other, resulting in force and power production dynamics that did not facilitate a flight phase (figure 2(B)). In order to achieve hopping behavior at higher values of
  it became necessary to raise
  , and ultimately increase
  (figures 3(A) and 6(A)). This outcome was in line with observations from Grabowski et al (2009), which demonstrated that a more compliant exoskeleton achieved greater reductions in
  than a stiffer one [26]. Unfortunately, Grabowski et al did not record EMG as part of their study, so there is no way of knowing whether or not reduced metabolic benefit in stiffer exoskeletons was accompanied by increased muscle activation as predicted here [26].
Even though there were significant reductions in metabolic rate when  was reduced in conjunction with increasing
  , it did not make the biological system as a whole more efficient. In fact, it had the exact opposite effect (figure 6(B)). By applying mechanical assistance and reducing the force burden on the MTU, the ability for an SEE to effectively cycle energy was reduced considerably (figure 4). The ultimate result was a large decrease in MTU apparent efficiency (figure 6(B)) despite concomitant reductions in metabolic rate (figure 6(A)).
This system level trend did not hold at the muscle level, and CE  output remained constant as
  declined with increasing
  (figure 4(A)). This resulted in muscle
  rising from ∼25% in the unassisted condition to ∼40% at the highest level of assistance for the data point in figure 3(A)
  (figure 6(C)). This increased CE apparent efficiency, however, came with greater
  values/risk of injury (figure 2(A)) and increased energy cycling in passive CE elements (figure 4(B)).
Comparison of modeled and experimental data
Despite the simplicity of the model implemented here, it could be compared rather nicely to human joint level data observed in Farris et al [21, 22]. By constraining our  values based on those used in experimental studies, and sweeping our
  for values of MTU
  observed experimentally, we identified a point of best fit for the Exo with no spring (
 of max,
  ) and Exo with spring
  conditions from [21, 22] for hopping at 2.5 Hz (figure 7(A), stars in figures 3(A),(C) and 6). These points maintained constant MTU + Exo
  (figure 3(A)), reduced
  and
and  requirements from unassisted (figure 6(A)), and traded reduced CE force (figure 7(B)) for increased excursion (figure 7(C)) to keep
  constant (figure 3(C)). Direct comparisons of muscle/tendon mechanics was difficult, since experimental data were only for the soleus MTU, and our model has all three plantarflexors lumped into a single monoarticular MTU. We did, however, directly compare % of total
  from CE/SEE in both studies, and found a quantitative match easily within ±1 Standard Error of the Mean (SEM) of experimental data (figure 7(A)).
There were, however, some shortcomings of model findings as well. Most notably, our model predicted significant passive CE stretch in early stance (figure 7(C)). This was not observed in human studies, where the ability to actively modulate MTU position with antagonist muscles (i.e. tibialis anterior) and knee flexion likely work together to limit CE lengthening in early stance (figure 7(C)). Secondly, while qualitative trends in metabolic demand agreed (i.e.  reduced with Exo, figure 6(A)), the model underestimated values of reductions in whole body metabolic cost attributed to reduced plantar-flexor loads from [22]. Again, this was likely attributable to model simplifications, which do not allow for bi-articular plantar flexors (i.e. medial and lateral gastrocnemii) that contribute to knee joint mechanical demands in humans [21].
Conclusions and the case for optimal exoskeleton stiffness for bouncing gait
With all of these model predictions and simplifications in mind, the question now becomes one of optimization. How can metabolic benefits, MTU and CE efficiency, and risk of injury all be balanced to best assist a compliant MTU? Was there a point or region in parameter space where detrimental and beneficial aspects can be balanced to achieve an idealized outcome? We are confident that humans would follow a path through our parameter space that kept Exo + MTU stiffness and average positive power nearly constant [27](figures 3(A)–(B) and 4(A)), maintained near constant CE positive power [22] (figures 3(C)–(D) and 4(A)), reduces muscle activation [21, 22, 25], and allowed for reduced metabolic energy consumption [21, 22, 26] (figure 6(A)). A significant region of parameter space remained accessible even with these restrictive criteria in place, and all of these regions terminated at a point where flight was no longer achieved or injury risk was too great beyond some terminal increase in  /reduction in
  (figure 3(A)). In every case, the only way to sustain hopping beyond this point was to increase
  in conjunction with increasing
  , ultimately resulting in increased metabolic cost (figure 6(A)) and average positive power from the MTU + Exo system (i.e. enhanced performance) (figure 3(A)). This, again, agrees with observed trends in human data [26], and leads us to the conclusion that springy assistance will be optimized for metabolic benefit when muscle activation is minimized and MTU + Exo power/stiffness remains consistent with the baseline/unassisted condition.
This model also made a second interesting prediction: by increasing assistance beyond the point of optimal metabolic benefit, it was possible to obtain better mechanical performance (i.e. hop height, Exo + MTU positive power) than the biological system alone (figures 2(B) and 3(A)). These regions of enhanced performance were also coincident with reduced CE positive power (figure 3(C)) and injury risk (figure 2(A)), as well as an increased metabolic cost relative to conditions where expenditure is minimized (figure 6(A)). This agrees with observations from Grabowski et al, where increased performance/hop height was also accompanied by greater variability in touchdown position, indicating that greater performance may come at the cost of reduced stability [26]. In conclusion, our model does predict that metabolic and mechanical performance benefits can be achieved simultaneously, but that neither is likely to be optimal while the other persists in a compliant MTU.
Future directions
By examining the interplay of reflex feedback, feed-forward control, and a wearable device, we hope to better understand how design of assistive devices may be optimized to achieve a desired outcome, be it reduced metabolic cost or enhanced performance. Towards this end, future modeling work will integrate simulated spinal cord reflex pathways in conjunction with feed-forward control to further explore the possibilities and limitations of spring-based assistive exoskeletons. Given the possible variation in muscle fascicle length, velocity and force production dynamics observed in this study, it seems likely that feedback through spindle and/or golgi tendon organs could play a role in shaping adaption to steady state dynamics in the context of external assistance. Finally, future experimental work will include studies of human hopping for a range of exoskeleton stiffness' with instrumentation similar to Farris et al [21, 22] to better understand neural and metabolic adaptation to springy exoskeletons, and either verify or refute predictions made here regarding tradeoffs between reductions in metabolic cost and enhanced mechanical performance.
Acknowledgments
This study was in part funded by US Israel Binational Science Foundation Start Up Grant 2011152 awarded to G S Sawicki.