


Abstract
Many types of bacteria form colonies that grow into physically robust and strongly adhesive aggregates known as biofilms. A distinguishing characteristic of bacterial biofilms is an extracellular polymeric substance (EPS) matrix that encases the cells and provides physical integrity to the colony. The EPS matrix consists of a large amount of polysaccharide, as well as protein filaments, DNA and degraded cellular materials. The genetic pathways that control the transformation of a colony into a biofilm have been widely studied, and yield a spatiotemporal heterogeneity in EPS production. Spatial gradients in metabolites parallel this heterogeneity in EPS, but nutrient concentration as an underlying physiological initiator of EPS production has not been explored. Here, we study the role of nutrient depletion in EPS production in Bacillus subtilis biofilms. By monitoring simultaneously biofilm size and matrix production, we find that EPS production increases at a critical colony thickness that depends on the initial amount of carbon sources in the medium. Through studies of individual cells in liquid culture we find that EPS production can be triggered at the single-cell level by reducing nutrient concentration. To connect the single-cell assays with conditions in the biofilm, we calculate carbon concentration with a model for the reaction and diffusion of nutrients in the biofilm. This model predicts the relationship between the initial concentration of carbon and the thickness of the colony at the point of internal nutrient deprivation.
Export citation and abstract BibTeX RIS

Content from this work may be used under the terms of the Creative Commons Attribution 3.0 licence. Any further distribution of this work must maintain attribution to the author(s) and the title of the work, journal citation and DOI.
1. Introduction
Bacterial biofilms constitute a highly robust class of bacteria colonies responsible for infections in tissues and medical implants [1–3], tooth decay [4, 5] and fouling of pipes and industrial equipment [6]. Biofilms are permeated with a matrix of extracellular polymeric substance (EPS) that binds the bacteria together, providing the colony with elasticity and strong surface adhesion [7]. A spatially heterogeneous distribution of cell phenotypes within biofilms and a high degree of resistance to extreme biochemical and physical conditions, including resistance to antibiotics, are biofilm hallmarks [8]. Bacillus subtilis biofilms exhibit this heterogeneity in EPS production; large groups of cells dramatically increase EPS production when they transform into the biofilm phenotype [9]. The gene regulatory pathways and numerous signaling mechanisms that control EPS production in biofilms have been largely unveiled; the timing of expression of repressors and anti-repressors of EPS genes, and the location of their products in biofilms have been discovered [10, 11]. However, the general physiological mechanism behind this heterogeneous EPS production remains unclear. Mature biofilms exhibit spatial gradients of metabolite concentration and species, from the surface to the center, that parallel this spatial variation in EPS production [12]. Far from the edge of the colony, metabolite depletion is most severe and may trigger EPS production within the biofilm. The influence of metabolite gradients on the production of EPS is not known, and a demonstration of the relationship between metabolite depletion and EPS production will provide the general physical mechanism that controls biofilm heterogeneity, EPS production and the transformation of bacteria colonies into biofilms.
Here we investigate the relationship between EPS production and nutrient depletion within B. subtilis biofilms. We quantify colony thickening, spreading and matrix production throughout the transition into an EPS permeated biofilm. We find that nutrient depletion within the colony triggers an increase in EPS production and a transition of cells into the biofilm phenotype. Consistent with previous studies [17], we find that this transition is marked by a change in growth mode; the colonies thicken before spreading radially, coincident with an increase in EPS production at a critical colony thickness. The dependence of biofilm formation on nutrient concentration is measured, and the relationship between critical colony thickness and nutrient concentration is predicted by a balance between nutrient transport into the biofilm and the nutrient uptake required for cells to proliferate. We also find that an increase of EPS production can be induced in individual cells in liquid culture by reducing nutrient levels in growth medium.
2. Materials and methods
2.1. Bacteria strains and culture
Fluorescent reporter strains of B. subtilis NCIB3610 are used in the study. Changes in cell motility are determined by monitoring the hag gene, which encodes flagellin, a major protein component of flagella. Changes in EPS production are measured by monitoring the tapA-sipW-tasA operon, which encodes the primary protein component of the extracellular matrix [13, 14]. A dual reporter strain for both of these genes is used in which genes encoding fluorescent proteins were fused to promoters of the tapA and hag genes. A PtapA-YFP (yellow fluorescent protein) fluorescence reporter construct was integrated into the amyE locus, and Phag-CFP (cyan fluorescent protein) was integrated into the lacA operon [15]. The same reporter constructs have been used previously, demonstrating the emergence of spatio-temporal heterogeneity in B. subtilis biofilms [9]. Cells are kept cryogenically stored and streaked directly from frozen stocks to a 1.5% agar, Luria Bertani (LB) medium, plate. After 12 h of incubation at 37 °C, 3 ml of LB liquid medium is inoculated with cells from an isolated colony. The inoculated LB medium is incubated on a shaker at 37 °C for 3 h, until the optical density, A600, of the bacteria solution is approximately 1.
In control experiments, a mutant strain that is incapable of producing the polysaccharide component of the extracellular matrix is used. Below we refer to this strain as the eps mutant because the epsA-O operon encodes the polysaccharide component of the extracellular matrix [9]. A strain that constitutively expresses green fluorescent protein (GFP) is used in protein expression control tests (B. subtilis YC161, Pspank-GFP fusion).
2.2. Colony studies
Approximately 0.5 μl of the bacteria solution is spotted onto a 1.5% agar plate containing minimal salts glycerol glutamate (MSgg) medium [16]. After the droplet of bacteria dries, the sample is transferred to a humidified chamber on an inverted microscope and kept at 30 °C. Every 45 min, automated data collection and stage control software collects a 9 × 9 grid of fluorescence images and transmission-mode bright-field images. The grid of images is stitched together and processed with custom written MATLAB software. The images are collected as uncompressed 16-bit tiffs with a cooled (− 70 °C) Andor EMCCD camera. The very high sensitivity of the camera allows low light exposures, using a 10% transmission filter in front of the fluorescence lamp with exposure times of 100 ms. Control tests show no detectable bleaching of the fluorescent proteins used in the experiments. Imaging is done with a low numerical aperture objective (5 ×), which also reduces bleaching due to the low photon flux within the focal spot.
2.3. Single-cell studies in liquid medium
Forty microliters of cells in shaking culture are transferred to 400 μl of pre-warmed liquid MSgg medium supplemented with 1.0 μg ml−1 surfactin, a B. subtilis quorum sensing molecule (MSggS). The addition of surfactin provides the single cells in liquid medium with one of the chemical signals required for biofilm differentiation [16, 17]. The planktonic cell solution is transferred to a glass-bottomed Petri dish and imaged on an inverted fluorescence microscope equipped with an environmental chamber maintained at 30 °C.
3. Results
3.1. Nutrient dilution triggers extracellular polymeric substance (EPS)-promoter expression in single cells
Bacteria live under nutrient-limited conditions in the wild, so the role of nutrient deprivation in EPS production and cell attachment to surfaces has been explored [18]. To test the B. subtilis response to reduced nutrient concentration at the single-cell level, we image standing suspensions of the dual reporter strain with fluorescence microscopy in time lapse, prepared as described in section 2.3. Automated image collection is performed over a grid of locations spanning an area of approximately 1 cm2, with a 2 s time lag between images. Most cells captured in the images have attached to the coverslip at the bottom of the imaging chamber. After the first 15 min of imaging, we deprive cells of their primary carbon sources by adding to the dish MSggS broth deficient in glycerol and glutamate. This procedure instantly reduces glycerol and glutamate levels to 13% relative to full medium. Images are collected for an additional hour after reducing the nutrient levels. We note that these experiments should be distinguished from total nutrient depletion experiments often done to study bacterial metabolism; here we merely reduce the concentration of the cells' preferred carbon source.
At each time point, one bright-field and two fluorescence images are collected: one with CFP filters and one with YFP filters. The fluorescence images are combined to create a segmentation mask, isolating locations in the images where cells lie; the fidelity of the segmentation procedure is verified by comparing to the bright-field images. Both CFP and YFP intensities are measured at all cell locations by applying the segmentation mask to the CFP (motility) and YFP (matrix) channels separately. To detect changes in matrix and motility reporter expression independent of cell number–density, segmented intensities from each channel are normalized by the total intensity from both channels, and each channel is normalized by its average intensity prior to nutrient dilution. For each normalized fluorescence channel, histograms of single pixel intensity at all segmented locations in the 1 cm2 field of view are made at each time point. This procedure provides a measure of the changes in both CFP and YFP signals per cell at every location in the images, relative to the average levels at the time of nutrient dilution. Since the lifetime of the fluorescent proteins in the cells is of the order of a half hour, any changes detected are cumulative measures of protein expression, not real-time rates.
We directly observe a decrease in CFP fluorescence levels and an increase in YFP fluorescence levels in the fluorescence images, indicating increased expression of matrix promoters. The histograms reflect this change in gene expression after nutrient dilution; the peak in the PtapA-YFP histograms shifts to higher fluorescence levels over time, and the peak in the Phag-CFP histogram shifts to lower levels. In control experiments, in which the same volume of full, undiluted MSggS medium is added to the sample, there is a slight response in which the opposite effect is observed: Phag-CFP increases slightly and PtapA-YFP decreases slightly. The same effect is observed in a second control, in which nutrient levels are reduced without the addition of surfactin. These results show that matrix production can be triggered by the depletion of nutrients in the presence of surfactin, and that surfactin alone does not trigger matrix production in individual cells over these timescales. Because surfactin has been shown to play a role in biofilm formation, we reason that adding surfactin to a standing liquid culture may cause a single cell to have a similar response to nutrient depletion as a cell in a biofilm. If this is the case, when a biofilm grows to a size at which nutrient levels significantly deplete due to mass transport limitations, we expect that the cells will respond to increasing matrix production levels (figure 1).
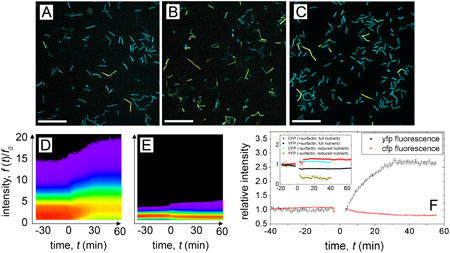
Figure 1. The nutrient-triggered transition in matrix expression is directly observed at the single-cell level. Before reducing the glutamate and glycerol concentrations in the MSgg medium, fluorescence images in dual reporting cells are dominated by CFP fluorescence, arising from high levels of hag-CFP expression (A). By contrast, after the glutamate and glycerol concentrations are reduced to 13% of that within the full growth medium, PtapA-YFP expression is visibly increased relative to Phag-CFP expression (B). In similar experiments in which no surfactin was added to the medium, no increase in YFP fluorescence is observed (C). Histograms of pixel intensity, relative to the intensity at t = 0, show this evolution in time; the peak in the PtapA-YFP histogram shifts to higher fluorescence intensity levels ((D), the vertical axis is the normalized YFP fluorescence intensity), whereas the peak in the Phag-CFP histogram shifts slightly toward lower fluorescence levels ((E), the vertical axis is the normalized CFP fluorescence intensity). Both (D) and (E) are false color maps of histogram values. Following the histogram peaks in time graphically, we see a clear shift to higher fluorescence levels in the PtapA-YFP after diluting glycerol and glutamate at t = 0 min, and a slight decrease in CFP expression ((F), the gap in data corresponds to the time it takes to stop the measurement, add additional medium and commence imaging; Y-axis: fluorescence levels relative to pre-treatment conditions). A control protocol, in which the same time course is carried out as in (D) and (E) with the addition of full MSggS rather than dilution, shows a weak change in fluorescence intensity, but with a decrease in PtapA-YFP and an increase in Phag-CFP (F, inset). A similar response is observed in another control measurement, in which the nutrient dilution protocol is followed without the addition of surfactin ((F), inset). Scale bars = 20 μm.
Download figure:
Standard image High-resolution image3.2. Colony growth and EPS production
We explore the relationship between colony growth and EPS promoter expression by imaging an entire biofilm with time-lapse microscopy. At each time point we collect a two-dimensional (2D) grid of bright-field and fluorescence images; the fluorescence signal indicates expression levels of EPS promoters, and the bright-field signal quantifies the colony thickness profile. We stitch the grid of images together at each time point to create large bright-field and fluorescence images of the entire colony. The bright-field images are converted into 2D thickness maps as described previously [19]. Briefly, we use the Beer–Lambert law of light absorption, I(r) = I0 e− h(r)/λ, where the incident intensity, I0, is directly measured at the periphery of the images where no bacteria lie, and the absorption length, λ = 235 μm, is measured in calibration experiments described in [19]. At each time point we segment the stitched bright-field images to distinguish the colony from bare agar, compute I0, and convert I(r) into h(r). Over time, we inspect the colonies visually, finding that they develop significant surface roughness, which can also be seen in the thickness maps, h(r). We qualitatively explore the physical changes in the colonies over time by manually probing the biofilms with micro-pipette tips. We find that when the biofilms thicken and roughen, they become physically robust, behaving like solid materials, which indicates the production of EPS.
We repeat these experiments on colonies provided with different amounts of nutrients. We vary the concentration of glycerol and glutamate, the primary carbon sources in the medium. Several time points of a biofilm provided with a mid-range nutrient concentration, MSgg50 (glycerol and glutamate at 50% of full medium), are shown in figure 2. The progression from small, thin, transparent colonies to large, thick, opaque biofilms is illustrated in figures 2(A) and (B). Additionally, the progression of matrix production in time and space is directly seen in the fluorescence images in figure 2(C).
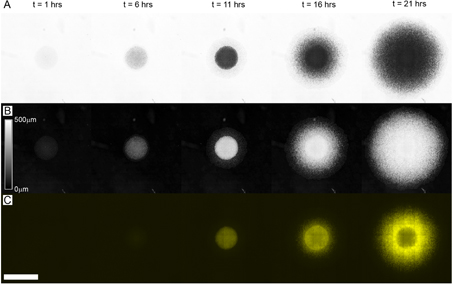
Figure 2. We monitor B. subtilis biofilm growth over time with bright-field microscopy by collecting a grid of high-resolution images to create a macroscopic composite. The bright-field images become darker as the biofilm thickens (A). We convert the bright-field transmission images into thickness maps using an exponential absorption law. In the thickness maps, the brightness of a pixel is proportional to the height of the colony at that point ((B), intensity scale bar: height in microns). The expression of extracellular matrix genes is monitored in space and time with fluorescence imaging by using cells expressing the tapA-YFP fusion reporter (C). Scale bar = 4 mm. See the movie 1 (available from stacks.iop.org/NJP/16/015028/mmedia) for time lapse of (A) and (C) overlay.
Download figure:
Standard image High-resolution imageTo quantify colony thickness and radius, we integrate h(r) over the azimuthal angle to produce an average height map, h(r). We process the fluorescence images in a similar manner; the stitched fluorescence images are normalized by background intensity levels F(r) = (I(r) − Ibg )/Ibg, where Ibg is the amount of signal coming from incident light transmitting through the fluorescence emission filter. The resulting intensity map, F(r), is the fractional intensity above background. We average F(r) over the azimuthal angle, and divide by h(r) to produce an average fluorescence map per unit height, f(r). A time series of h(r) and f(r), produced from images collected every 45 min for 25 h, shows the thickening and spreading of the colony. Both h(r) and f(r) appear to evolve nonlinearly in time, reaching a maximum rate of increase, prior to saturation, at around the tenth time point, shown in figure 3.
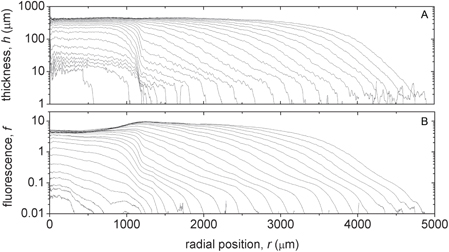
Figure 3. The 2D thickness maps, h(r), are converted into 1D thickness profiles h(r) by averaging the thickness maps over the azimuthal angle. Each line in (A) corresponds to a different time point, separated by a 45 min lag time, increasing in thickness and radius over time. The 2D fluorescence maps, f(r), are converted into 1D fluorescence profiles, f(r), in a similar manner (B).
Download figure:
Standard image High-resolution image3.3. Nutrient depletion triggers matrix production in the biofilm
As a biofilm grows, metabolites must diffuse from the surrounding medium, through the colony's periphery, into regions far from the nutrient source. For biofilms grown on agar slabs containing nutrient medium, the cells near the bottom of the colony will deplete the level of metabolites as they diffuse deeper inward, reducing the amount of nutrients available for cells near the top of the colony. Our nutrient dilution studies in planktonic culture show that, in the presence of surfactin, cells produce EPS in response to exogenous dilution of their preferred carbon sources. Based on this observation, we hypothesize that in biofilms, where surfactin is naturally produced, matrix production will start at a critical thickness at which nutrients are depleted. To quantify colony sensitivity to the depletion of nutrients, we explore the relationship between matrix production levels and biofilm thickness. We use the maximum of h(r), hmax, as a metric of the thickening of the biofilm over time, and we use the maximum of f(r), fmax, to follow the highest levels of EPS production in time. The thickness of the biofilm follows a sigmoid-like growth curve; the biofilm thickens slowly for the first several hours of growth, thickens rapidly between 4 and 10 h, and saturates at around 14 h. The expression of the matrix follows a similar sigmoidal curve with a much slower transition. Since the production of EPS is a hallmark of biofilms, distinguishing them from non-biofilm bacteria colonies, we use EPS-promoter expression as the marker for cell differentiation into the biofilm phenotype. The mid-point of the sigmoidal fluorescence curve is identified by fitting the growth curve
allowing the definition of a transition time, τ*, at which the colony crosses over from low levels of matrix production to high levels. Our result does not depend on the specific curve; any smooth sigmoidal function can be used to extract the mid-point. We then find the thickness of the biofilm at τ*, using the same type of growth curve, defining a transition thickness, h* (figures 4(A) and (B)). To verify that fmax reflects the fluorescence level per unit thickness, we carry out the same experiments on colonies of cells expressing a constitutive fluorescent reporter, Pspank-GFP. We find no increase in fmax for these control colonies (figure 4(C)).
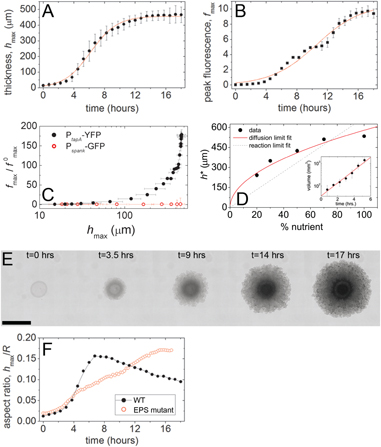
Figure 4. At each time point, the maximum value of h(r) is chosen to define the height of the biofilm, hmax, which increases and saturates over time (A). To monitor those regions where extracellular matrix is produced at the highest rate, we also follow in time the maximum value of f(r), fmax (B). Control experiments on the constitutively expressing constructs, Pspank-GFP, show no dramatic increase in expression with colony thickness, compared to matrix reporter constructs (C). From the sigmoid-like growth of fmax we extract a transition time, τ*, at which the biofilm crosses over from low levels of matrix expression to high levels. The thickness of the biofilm at τ* defines a critical thickness, h*; biofilms thicker than h* produce high levels of extracellular matrix. The thickness, h*, at which the cells shift into a matrix-producing phenotype increases with global nutrient concentration, suggesting that matrix production increases as a response to nutrient depletion ((D), red line: consumption–diffusion balance predicts h*). The biofilm follows an exponential increase in volume over the first several hours of growth ((D), inset). When the cells increase matrix expression, the biofilm changes from a thickening growth phase to a spreading growth phase. Mutant colonies unable to transition into matrix-producing biofilms do not exhibit this change in colony growth dynamics ((E), time lapse of EPS-mutant colony; (F), aspect ratio of wild-type and EPS-mutant colonies over time). (Panels (A)–(C), (E) and (F) correspond to the 50% nutrient medium case.) Scale bar = 2 mm.
Download figure:
Standard image High-resolution image
If matrix production is a response to nutrient deprivation, then the transition thickness, h*, should vary with the nutrient concentration initially present in the growth medium. We therefore study the relationship between h* and global nutrient concentration. We image biofilms in time lapse, as described in section 3.2, grown on MSgg agar plates prepared with varying amounts of glycerol and glutamate. We determine h* for biofilms provided with 20, 30, 50, 70 and 100% glycerol and glutamate, relative to full MSgg medium. We find that cells differentiate into the matrix-producing biofilm phenotype more rapidly with decreasing nutrient concentration, at correspondingly smaller transition thicknesses (figure 4(D)).
We also see the transition to a matrix-producing biofilm reflected by changes in the size and shape of the colony over time. Before the transition occurs, we observe that the biofilm thickens faster than it spreads. After the transition, the colony spreads faster than it thickens. The transition to a spreading dynamic occurs at a time very close to τ*. Mutant strains that cannot produce the polysaccharide component of the matrix do not exhibit this transition (figures 4(E) and (F)).
3.4. A balance of nutrient diffusion and consumption predicts h*
Our experiments on individual bacteria show that cells respond to glycerol and glutamate deprivation by turning on matrix, provided that they sense surfactin. Glycerol and glutamate are the primary carbon sources in MSgg broth, suggesting that carbon deprivation triggers matrix production in a biofilm. To bridge the gap between single-cell assays and conditions in the biofilm, we calculate carbon concentration in the biofilm as cells consume nutrients to proliferate. If cell growth is fast, diffusion limits the amount of nutrients that flows from the agar to the colony. Under these 'diffusion-limited' conditions, cells at the top of the biofilm starve significantly earlier than cells in contact with agar. The carbon flux diffusing from the bottom of the biofilm to the top is 2D(ctop − cbottom)/h, where D is the nutrient diffusivity, ctop − cbottom is the difference in nutrient concentration between the top and bottom of the biofilm and h is the biofilm thickness. This flux must balance the flux of nutrients required for biomass growth, Γh, where Γ is the nutrient consumption rate per unit volume that we assume to be constant. When the cells at the top first starve, those in contact with agar still experience no depletion, so that ctop ≈ 0 and cbottom ≈ c∞, where c∞ is the initial nutrient concentration in the MSgg medium. Solving for h, we obtain a scaling law for the critical height, h*, at which cells first starve:  . A fit of this prediction to the experimental data is shown in figure 4(C), and for D = 10−7 to 5 × 10⁻⁶ cm2 s−1 it provides an estimate for the carbon consumption rate of Γ = 0.02–1 mM s−1. This estimate is comparable with the expectation based on carbon content in a cell (see supplementary information, available from stacks.iop.org/NJP/16/015028/mmedia). A more detailed calculation including the exact pre-factors is shown in the supplementary information.
This scaling argument is consistent in the case in which  , and diffusion across h is slower than growth, or D < 5 × 10⁻⁶ cm2 s−1, for a cell division time, T = 1 h. Here D is an effective diffusivity, since carbon is present in both glycerol and glutamate that have different diffusivities. Diffusivities of both species in pure water are available in the literature and can be estimated from the Stokes–Einstein relation, Dgly ∼ 5 × 10⁻⁶ cm2 s−1, Dglu ∼ 10−7 cm2 s−1 [20, 21]. Further experiments to measure the diffusivity of glycerol and glutamate in a biofilm are needed to confirm this hypothesis and corroborate the use of single-cell assays to probe biofilm physiology. Note that the diffusion-limited hypothesis is consistent with previous observations showing vertical stratification in gene expression (9).
In the opposite case, where diffusion is faster than growth, the whole colony experiences the same nutrient concentration. Under these 'reaction-limited' conditions, the argument is recast to obtain an alternative prediction for h*: the flux of nutrients flowing from the agar to the biofilm in a division timescale is  , and must balance consumption for biomass growth Γh. At starvation, we impose cbiofilm = 0, and solving for h we obtain
  . A linear fit to the data is shown by the dotted line in figure 4(C), and does not fit as well as the diffusion-limited prediction. With T = 1 h, the fit provides an estimate for Γ = 0.03–0.3 mM s−1 depending on D, smaller but comparable with the estimate based on carbon content in a cell.
4. Discussion and conclusions
Here we have shown that nutrient depletion triggers matrix production in B. subtilis biofilms. We find that colonies reach a critical thickness above which matrix production is increased, and the critical thickness, h*, can be controlled by the amount of nutrients provided to the colony. We observe a similar response to nutrient deprivation in liquid cultures; when individual cells are starved, they increase matrix production. To bridge the gap between single cells and conditions in the colony, we calculate carbon concentration in the biofilm, as gradients develop due to consumption. If the dynamics is diffusion limited, we predict that cells at the top of the biofilm starve at a critical height  , in good agreement with the data. Previously it was shown that the up-regulation of EPS drives fluid flow into the biofilm and generates an osmotic pressure that causes the biofilm to spread [19]. We see the same result here; when h* is reached, the biofilm begins to rapidly spread, and EPS knockout strains do not exhibit this transition (figures 4(E) and (F)). Matrix production thus confers a potential benefit to the colony as expansion provides the biofilm with fresh nutrients. Further studies that directly measure the rate of nutrient transport into the colony during the transition process are essential to test the extent to which the biofilm benefits from polymer-driven flows.
The observed nutrient-based trigger has potential implications in the evolution of mass transport in biofilms. In order to grow in size, multicellular organisms must evolve physiological mechanisms that overcome diffusive mass transport limitations [22]. Bacterial biofilms are much larger and more complex than non-biofilm-type colonies, and resemble primitive multicellular organisms [23–25]. In the life cycle of a biofilm, once cells differentiate into the biofilm phenotype, most cells remain in the colony until conditions become excessively unfavorable [26]. Thus, without an alternative mechanism, cells in a biofilm passively wait for nutrients to diffuse into the colony from the environment, or bacteria must excrete enzymes that break down materials in the surrounding medium, and again wait for nutrients to diffuse in [6]. One alternative transport mechanism that helps to accelerate nutrient delivery into biofilms is evaporation at the surface of the biofilm that drives the fluid through microscopic channels, which develop at late stages of biofilm growth [27]. The increase of EPS production and transition into the biofilm-type colony occurs approximately 24 h before the emergence of fluid channels, and the development of channels requires EPS production [9]. Thus, the EPS triggering mechanism observed here may be part of a larger mechanism that has evolved in biofilms to bring in nutrients more efficiently than diffusion.
Finally, our results provide a physical foundation for heterogeneity in biofilms. Biofilm complexity is often described in terms of a division of labor model; cells in different regions of the colony perform different tasks, observed in a stratification of gene expression in B. subtilis biofilms [9]. Cells near the top of a biofilm are the first to express proteins associated with sporulation; cells in the middle layers of the biofilm express matrix; cells near the bottom and the edges of the colony express proteins associated with flagellar motility. It is known that when B. subtilis cells are completely depleted of growth medium, they rapidly transition into spores, which develop at the top surface of the biofilm [16, 28]. Our results show that at low, but finite, nutrient levels, cells in a motility state shift into an EPS production state. These observations are consistent with the idea that stratification of protein expression in B. subtilis biofilms is driven by the gradient of nutrients that develops as the colony grows. Further studies are needed to connect nutrient redistribution with genetic and physical heterogeneity, and to probe how the coherent functioning of the whole community may result in a biofilm physiology.
Acknowledgments
We acknowledge support from the BASF Advanced Research Initiative at Harvard University, PEPS PTI CNRS and Marie Curie IOF to AS. We thank Hera Vlamakis, Yunrong (Win) Chai, Roberto Kolter and Richard Losick for B. subtilis strains used in these studies and for helpful advice and guidance.