

Abstract
Measuring brain electrical impedance (rheoencephalography-REG) is a potential technique for noninvasive, continuous neuro-monitoring. Typically, intracranial pressure (ICP), an invasive monitoring modality, is used in brain monitoring. Our hypothesis was that both modalities would reflect cerebrovascular reactivity. In the present study we compared results of REG to results of ICP measurement. Rats were used under anesthesia ( ; 36 control and 59 vinpocetine infusions). REG was measured by two bipolar REG amplifiers; time constants (Tc) were 3 and 0.3 s. The vinpocetine injection caused a transient decrease in systemic arterial pressure (SAP) and a simultaneous increase in ICP and REG pulse amplitude. SAP decrease was 25% ± 14%; ICP was 28% ± 16%; REG pulse amplitude increase was 209% ± 17% (Tc 3) and 107% ± 68% (Tc 0.3). ICP increase correlated with REG pulse amplitude increase. Area under the receiver operating characteristic curve was 0.9481 for ICP–REG time constants 3 and 0.9335 for ICP–REG time constants 0.3; both with
  . The fact that both REG and ICP reflect cerebrovascular reactivity indicates the usefulness of REG as a potential technique for noninvasive, continuous neuro-monitoring. The Tc of REG amplifier requires optimization for continuous monitoring of pressure reactivity index.
Export citation and abstract BibTeX RIS
1. Introduction
The purpose of neuro-monitoring is to prevent secondary brain damage due to elevation of ICP, hemorrhage, edema formation, hypoxia and vasospasm, conditions associated with ischemia and poor outcome after brain injury (Steiner and Andrews 2006, Rubin et al 2009). Invasive modalities most typically measured in neuro-monitoring are ICP, brain tissue O2 and temperature, blood flow by laser Doppler and tissue perfusion (Czosnyika et al 2009, Mendelson et al 2012). Noninvasive modalities used are near infrared spectroscopy (NIRS), transcranial Doppler (TCD) and neurophysiological methods (Steiner and Andrews 2006, Rubin et al 2009). Brain imaging methods are not suitable for continuous monitoring because of bad time resolution. TCD with probe holder also far from ideal for continuous monitoring; it is measured maximum few times per day in neurosurgery intensive care units.
Few studies have compared results of measurements made with REG to measurements of ICP (Traczewski et al 2005, Brady 2010). The present study compares REG with ICP to determine if results obtained with REG (a noninvasive modality in humans) are comparable to results obtained with ICP (an invasive modality).
The most advanced neuromonitoring is to calculate pressure reactivity index—PRx: it is a correlation coefficient between slow, spontaneous changes in ICP and SAP (Czosnyka et al 2009). Recent publication is in studying the short and long PRx in the management of traumatic brain injury (Lang et al 2014) point out the same direction as our study. Since REG shows promise as a method for noninvasive neuromonitoring, because it reflects cerebrovascular reactivity, we are investigating clinical and technical conditions required to use REG, specifically, we compared Tc (Cooper et al 1980) for the REG signal.
1.1. Rheoencephalography
The US Food and Drug Administration defined REG as 'a device used to estimate a patient's cerebral circulation (blood flow in the brain) by electrical impedance methods with direct electrical connections to the scalp or neck area' (US Food and Drug Administration 1997). The physical basis of the REG measurement is the fact that blood and cerebrospinal fluid are better conductors than the brain or other 'dry' tissue. The REG signal reflects the pulsatile electrical impedance change: during blood inflow into the cranial cavity, electrical conductivity increases and resistance decreases, as represented by increasing REG pulse amplitude. The REG pulse wave represents only a small percentage of the total electrical impedance. In order to avoid potential extracranial interference, we used intracranial and invasive derivations.
In this study, we used vinpocetine to increase cerebral blood flow (CBF). Vinpocetine is a drug long used in clinical practice and as a reference drug in pharmaceutical research. Studies have been published that included the administering of vinpocetine in human patients and in animal studies (Vas et al 2002). In the present study, our hypothesis was that vinpocetine would produce increases in CBF, ICP and REG pulse amplitude.
2. Materials
2.1. Measurement setup
REG amplifiers used were: (1) device A: Cerberus amplifier (Quintlab, Budapest, Hungary) with a band width 0.5–30 Hz (Tc 0.3 s) and a measuring frequency of 125 kHz. (2) device B: KR-Ea RHEO (OTE Biomedica, Italy) with a Tc of approximately 3 s and a measuring frequency of 45 kHz—table 1.
Table 1. Technical specification of used REG amplifiers.
| Device A | |
| Number of channels | 6 |
| Measuring current | 1 mA, 125 kHz, sinusoidal |
| Input impedance (Z0) | Max. 2 KΩ |
| Sensitivity (dZ) | ±1 Ω |
| Bandwidth 0.5–30 Hz | 0.5–30 Hz |
| Noise | <2 mΩ/50 Ω |
| Device B | |
| Impedance bridge | De Sauty type |
| Operating frequency | 45 KHz approx. |
| Balance | Fine control, with resistance direct ohm-reading and rz-step capacity selector |
| Balance readout | On magnetodynamic meter |
| Calibration values | 0.05, 0.1–0.5–1, pushbutton selectable |
| Maximum sensitivity | 400 mV for delta R/R = 0.5‰ |
| Coupling | AC type |
| Time constant | 3 s aporox. |
| Output voltage | 250 mV cm−1 |
REG electrodes were stainless steel intra-cerebral electrodes (Plastics One, Roanoke, VA) with a 5 mm uninsulated surface. The ICP probe was a micro sensor, and the electronics were an ICP Express (Codman, Raynham, MA). The analog output of ICP Express was amplified (Polygraph dc driver amplifier, Grass, Quincy, MA). SAP was measured with (Transducer: Disposable, Maxxim Medical, Athens, TX; and Digi-Med Blood Pressure Analyzer, Micro-Med, Louisville, KY). Recorded modalities were (1) SAP, (2) ICP, (3) REG device A: Tc 0.3 s, and (4) REG device B: Tc 3 s. Analog waveforms were stored in a PC with a 200 Hz sampling rate with a 16 bit resolution AD card (National Instruments, Austin, TX) using in-house developed software (DataLyser), based on a LabWindows program (National Instruments, Austin, TX), which was also used to process the data.
Cerberus amplifier is a 4-slot MicroBox IPC Chassis (MBPC-641, Advantech, CA) containing impedance, EEG and EKG sections and isolation card (Bodo et al 1995). KR-Ea RHEO is a subminiature amplifier to be used in 'E' Series encephalographs, 'PF' polygraphs and 'b' series electrocardiographs.
3. Methods
3.1. Animal experimentation
Male Sprague-Dawley rats ( ; 36 control and 59 vinpocetine infusions) were used under pentobarbital sodium (Nembutal®, Ovation Pharmaceuticals, Deerfield, IL) anesthesia (50 mg kg−1) spontaneously breathing. Body temperature was maintained at 37 °C with a heating pad-rectal thermometer closed-loop system (Homeostatic Blanket Control Unit, Harvard Apparatus Ltd. Edenbridge, KT). The surgical preparation involved (1) insertion of femoral arterial and venous, heparinized polyethylene tubing and tracheal catheters and (2) implantation of REG electrodes and ICP probe into the brain. The REG electrodes and ICP probe were fixed to skull with dental acrylate (Plastics One, Roanoke, VA) as was detailed previously—figure 1 (Bodo et al 2004, 2005). The two challenges were IV vinpocetine bolus infusion (2 mg kg−1) and, as a control, iv saline infusion; see table 2. Events are entered as text and marked on traces; for example ICP 10 mmHg (by reading of monitor screen), start of Cavinton, saline, and heparin infusion.
Table 2. Summary of measurements.
| Rat | Weight (g) | Injected volume (μL) | Control n | Vinpocetine n | R (Ω) |
|---|---|---|---|---|---|
| 1 | 666.4 | 266 | 1 | 5 | N/A |
| 2 | 577.6 | 231 | 3 | 9 | 8.3 |
| 3 | 654 | 262 | 3 | 7 | 8.3 |
| 4 | 531.4 | 213 | 3 | 10 | 8.3 |
| 5 | 666 | 266 | 2 | 4 | 3.7 |
| 6 | 667 | 266 | 4 | 4 | 4.4 |
| 7 | 692.3 | 277 | 4 | 9 | 8.8 |
| 8 | 734.6 | 294 | 2 | 2 | 9.5 |
| 9 | 632.2 | 253 | 4 | 4 | 7.6 |
| 10 | 700.4 | 280 | 4 | 7 | 7.7 |
| 11 | 700.7 | 280 | 1 | 5 | 6.46 |
| 12 | 603.2 | 341 | 5 | 4 | 7 |
| Mean | 652.15 | 269.08 | 3 | 5,83 | 7.28 |
| SD | 57.72 | 31.66 | 1.28 | 2.52 | 1.8 |
| Total | 36 | 70 |
Resistance between electrodes (R) was able to measure only with device B.
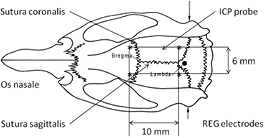
Figure 1. Dorsal view of a rat skull with the positions of Bregma, Lambda, and interaural line. The positions of four REG electrodes are labeled by asterix (*); the ICP probe is labeled by an arrow. The distance from the sutura sagittalis of the electrodes and the ICP probe was 3 mm.
Download figure:
Standard image High-resolution image3.2. Data processing
To quantify SAP, ICP and REG changes, we used the formula of cerebrovascular vasomotor reactivity (CVR) calculation (Ringelstein et al 1992), as the percentage change in SAP, ICP and REG after vinpocetine injection as compared with SAP, ICP and REG at rest/control (before injection). REG pulse waves were characterized by standard deviation (SD) values, similarly as previously to integral was measured for 5 s (Bodo et al 2004). The first step of REG pulse amplitude measurement was filtering (removing respiratory sub-harmonic) with a 2–50 Hz inverted Chebishev filter. The next step was to create first derivative of REG pulse wave. The third step was to calculate SD values for 5 s. Now data was copied and pasted into an Excel spreadsheet (Microsoft, Redmond, WA), where percentage calculation was performed. Percent numbers were copied and pasted into a Prism (GrapPhad, La Jolla, CA) spreadsheet where ROC AUC values were calculated—figure 2. The ROC curve characterizes sensitivity and specificity of the test method (REG) compared to standard (ICP). The diagnostic test in this study investigates REG. ICP is a standard neuromonitoring method; REG is investigational. ICP increase is the physiological phenomenon which was compared to REG increase. To measure SAP and ICP we used their mean values measured for 5 s. Numerical values of SAP and ICP were also copied into an Excel spreadsheet. ICP and REG change were compared for REG device A and B with A  and
and  . The device B amplifier was used in 59 challenges and not just 38 challenges, simultaneously to the device A amplifier. ROC calculation was performed for both cases, i.e. when data were symmetrical (
 ) and asymmetrical (38 and 59). Probability was considered significant at <0.05; data are mean ± SD, figure 3.
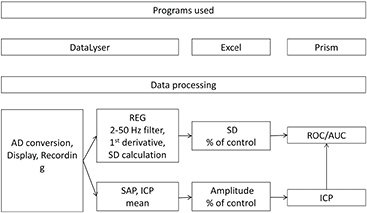
Figure 2. Used programs (upper panel) and data processing (lower panel). Note more steps for REG then for SAP and ICP. ROC/AUC calculation involved only REG and ICP percent changes. For details see section 3.
Download figure:
Standard image High-resolution image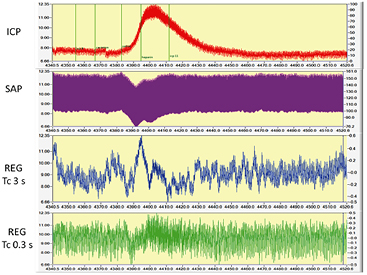
Figure 3. Effect of vinpocetine administration: ICP elevated, SAP decreased, REG amplitudes increased—visible only after filtering out respiratory subharmonic. Traces are ICP, SAP, REG device A and B. Device B allows more baseline oscillation than A. Time window is 180 s (2 October, file 1). Baseline (4343–4373 s; before drug administration) respiration was 82 bpm; heart rate was 348 bpm, measured by FFT on SAP trace. The numerical values of this challenge were: baseline SAP at 4335 s—138.96 ± 0.42 mmHg (mean ± SD of 40 s); minimum: 129.14 mmHg at 4385 s. ICP baseline was at the same window 7.24 ± 0.7 mmHg; maximum was 11.06 at 4395 s. As a comparison, the initial blood pressure after surgery and start of measurements was 160/125 mmHg, heart rate 406 min−1 (1 m average). At the end of measurement values were 148/122 mmHg and 385 min−1. ICP was 6 mmHg at start and 9 mmHg at end. Events are marked on ICP trace are as follow: ICP 8, Cavinton, saline, heparin, ICP 11. These traces are as appeared in DataLyser program. Left vertical scale is the original trace value (trace color is red—ICP); right is the value of overlay file (trace color not red). In order to show identical portion of traces, overlay was used to present SAP, ICP and REG waveforms.
Download figure:
Standard image High-resolution image4. Experimental results
Intravenous injection of vinpocetine caused a transient decrease in SAP and a simultaneous increase in both ICP and REG pulse amplitudes, both reflecting CBF pressure autoregulation. The average response to vinpocetine injections, calculated as a percentage of baseline value, was as follows: SAP decrease, 25% ± 14%; ICP increase, 28% ± 16%; REG pulse amplitude increase, 209% ± 166 % (device B) and 107% ± 68% (device A). Area under the ROC curve was 0.95 for ICP–REG (device B) and 0.93 for ICP–REG (device A); both with  . Area under the ROC curve was 0.96 for ICP–REG (device B) in the full group; table 3.
Table 3. Statistics of area under the ROC curve.
| Device A | Device B | Device B | |
|---|---|---|---|
| Area | 0.9481 | 0.9335 | 0.9558 |
| Std. error | 0.023 84 | 0.029 76 | 0.018 52 |
| 95% confidence interval | 0.9013 to 0.9948 | 0.8752 to 0.9919 | 0.9195 to 0.9921 |
| P value | <0.0001 | <0.0001 | <0.0001 |
| Data | |||
| Controls (ICP) | 38 | 38 | 59 |
| REG | 38 | 38 | 59 |
| Missing controls | 0 | 0 | 0 |
| Missing REG | 0 | 0 | 0 |
Comparison of area under the ROC curve between ICP and REG devices A and B. NB: the area value increased and standard error decreased with increased number of measurements (third column).
5. Discussion
We established a correlation between ICP and REG during transient SAP decrease, elicited by vinpocetine bolus injection. The area under the ROC curve confirmed the strong relationship between ICP and REG. This fact supports our hypotheses that (1) REG can be used for monitoring CBF autoregulation; (2) REG amplifier requires optimization of time constant for use of pressure reactivity index calculation.
The finding that the fundamental amplitude of REG at pulse frequency recapitulates slow waves of ICP is consistent with the hypothesis that pulse amplitude changes in REG are affected by autoregulation-induced changes in cerebral vascular resistance (Brady et al 2010). This study is part of series of measurements in which we used REG during physiological and pathological CBF manipulations (Bodo 2010).
5.1. Vinpocetine
Although an initial goal of this study was to administer vinpocetine because of its described CBF enhancing effect, we observed a transient decrease in SAP during the intravenous bolus injection of Vinpocetine. A PubMed search resulted in few reports of the hypotensive effect of vinpocetine (Kárpáti and Szporny 1976, Solti et al 1976, Imamoto et al 1984, Yamada et al 1995). In clinical practice vinpocetine is not administered by a bolus injection but rather by a slow intravenous infusion, in which an ampoule of vinpocetine (2 ml) is diluted in 500 ml saline. Additionally, continuous invasive monitoring of SAP in patients during vinpocetine infusion is not a routine practice. Further studies are needed to separate and explain the effect of vinpocetine on SAP. In this study CBF pressure AR response was inseparable from the known CBF enhancing effect of vinpocetine.
5.2. Clinical implications
In both previous and current published studies, the terms 'CBF autoregulation' (CBF AR) and 'cerebrovascular reactivity' are used to refer both to blood pressure manipulation and manipulation of reactivity triggered by chemical factors, such as drugs and CO2. Cerebral vascular reactivity (CVR) is an indication of autoregulation. Transcranial Doppler users call it vasomotor reactivity, expressed as percentage change in flow velocity. This type of vasomotor reactivity test is the simplest to use and estimate cerebrovascular reserve capacity in clinical practice.
The present study is part of an ongoing initiative to develop a noninvasive, continuous brain monitor for use in neuro-monitoring in both military and emergency medicine. In civilian clinical practice invasive SAP and ICP monitoring is typically used to detect status of CBF autoregulation—PRx; however, in military medical practice, these invasive modalities cannot be used during transport of injured, deployed military personnel. Moreover, in military medical practice, resuscitation techniques used to treat injured service members on the battlefield can result in the unintended consequence of secondary brain injury. After brain/blast injury CVR can be lost, which is bad prognosis. In the absence of the ability to maintain cerebral perfusion, a state of hypotension results in significant ischemia and secondary brain injury. Currently, however, there is no way of assessing the risk of implementing a hypotensive resuscitation strategy in a patient suspected of having traumatic brain injury (Holcomb 2001, Manley et al 2001, Committee on Tactical Combat Casualty Care 2003). If normal CVR is found to be present, then lower blood pressures/cerebral perfusion pressures can be tolerated. Conversely, if CVR is absent, then blood pressures must be maintained at a higher level to prevent cerebral ischemia. Related clinical aspects were detailed previously (Bodo et al 2004, 2005, 2013).
5.3. REG measurements
The advantage of REG measurement is the good time resolution, making real time calculation of PRx possible as well as convenient contiguous monitoring by using two electrodes. The cost of an REG amplifier is much less than a Doppler device. Influencing factors of REG are detailed by Moskalenko (1980); various calculations of REG indexes are published by Jenkner (1986). It was reported that vincopetine caused REG amplitude increase (Hadjiev and Yancheva 1976). On the basis of previous data, REG is actually a reflection of volume rather than flow (Bodo et al 2010). Since the REG amplifier in the new brain monitor should allow for the very slow component of the REG signal, there is a need for further studies to test and optimize its settings (i.e. Tc). As an illustration of the effect of different Tc, see amplitude decrease of REG signals after vinpocetine bolus injection in figure 4. An inadequate time constant will eliminate slow waves from the REG signal, resulting in an erroneous determination of the lower limit of CBF AR (Lang et al 2014). The REG amplifier requires optimization of Tc, since it is necessary to preserve slow waves while keeping the signal in range for automated data processing to calculate the lower limit of CBF AR. The technical specification of the REG amplifiers used is given in table 1.
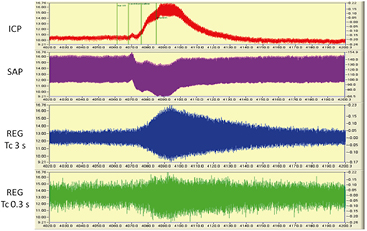
Figure 4. Typical changes during vinpocetine bolus injection: SAP decreased, ICP elevated and REG pulse amplitudes increased. Please note the difference of two REG amplitude increase and decrease in REG device A and B. REG was filtered and its first derivative is shown here, as described in section 3. Y axis is in volts; X axis is seconds. Time window: 180 s. File: 2 October 2009—2 (4020–4200 s). The numerical values of this challenge were: baseline SAP at 4335 s—138.96 ± 0.42 mmHg (mean ± SD of 40 s); minimum: 129.14 mmHg at 4385 s. ICP baseline was at the same window 7.24 ± 0.7 mmHg; maximum was 11.06 at 4395 s. Events are marked on ICP traces are as follow: ICP 10, Cavinton, saline, heparin. These traces are as appeared in DataLyser program. Left vertical scale is the original trace value (trace color is red—ICP); right is the value of overlay file (trace color not red). In order to show identical portion of traces, overlay was used to present SAP, ICP, and REG waveforms.
Download figure:
Standard image High-resolution imageOur filter selection criteria were designed to have minimal influence on the original REG signal. However, the main problem was to remove a respiratory artifact that influenced the REG pulse amplitude. Since rat heart rate is about 350–400 min−1, it is about 6–7 Hz; i.e. REG was in the unfiltered range. A Chebyshev filter was applied using the same settings that were used for the REG device A and B signals; consequently, use of the Chebyshev filter cannot be the explanation for the recorded difference between REG device A and B. The caused signal distortion was identical and minimal. The difference in the results could be due to the different specifications of the devices such as the noise spectrum, details of which are not available.
The ICM+ software3 uses ICP and SAP as input signals; both changes are in positive voltage range. REG is a biphasic signal, similar to EEG and EKG. The relevant information acquired during REG measurements is the change in REG pulse amplitude (minimum–maximum distance) as well as the very slow component of the signal. Methods for processing the REG signal to determine the lower limit of CBF AR have been described previously (Bodo et al 2010). Additional tests are in progress using CBF manipulations.
5.4. Study limitations
The main question is: could this signal be recorded from the scalp? The answer is yes. Bodo et al (1995) report a correlative study with carotid Doppler. Additional results of human studies are present in the literature (Hadjiev and Yancheva 1976, Moskalenko 1980, Jenkner 1986, Traczewski et al 2005, Perez 2014). The biggest hindrance is the suspected filter effect of the scalp, skull, as well as extracranial circulation (external carotid) contribution to the scalp REG signal. A recent publication helped clarify this problem, stating that 'a significant part of the REG signal is caused by a non-extracranial source and, therefore, it should not be used as a footprint of the extracranial blood flow' (Perez 2014). However, during Trendelenburg position (head down) this statement is not true: increase of extracranial blood volume masks the intracranial vasoconstriction (Jenkner 1986). An additional interpretation problem of REG comes from Doppler ultrasound comparisons. Unlike Doppler ultrasound which can target the middle cerebral artery and isolate a single source waveform, REG has no clear anatomical structure; see details by Moskalenko (1980). However, it can be hypothesized that if REG reflects CBF AR then it is the organ of autoregulation, i.e. arteriola. According to published observations, arteriola is the organ of CBF AR and not a big vessel (Kontos et al 1978).
5.5. Other potential applications of REG
In additional to applications in neuro-monitoring, REG has diagnostic and therapeutic control applications for other neurological diseases with cerebrovascular involvement (e.g. arteriosclerosis; migraine). Another potential application is the quantification of cerebrovascular involvement in EEG diagnostics during hyperventilation (by triggering potential pathological waveforms caused by CBF decrease); currently, there is no comparison or quantification for it (American Clinical Neurophysiology Society 2015). There is individual difference in depth of hyperventilation; i.e. the CBF decreased is different. By quantifying CBF decrease with REG pulse amplitude change, the challenge can be standardized not just with the length of time which does not guarantee the level of CBF decrease and consequently, the EEG diagnosis will be more exact.
5.6. ROC
In the field of medical diagnosis, ROC curves have become a standard tool (van Erkel and Pattynama 1998, Brady et al 2010, Jones et al 2010, Eng 2012, Eng 2015, Lang et al 2014); its use is becoming increasingly common in other field such as finance, atmospheric science and machine learning (figure 5). When a researcher creates a diagnostic test, an ROC curve helps the researcher decide where to draw the line between 'normal' and 'not normal'. For every possible boundary between 'normal' and 'abnormal', the ROC plot shows the tradeoff between sensitivity (ability to detect disease) and specificity (ability to detect lack of disease). Assessment of predictive accuracy is a critical aspect of evaluating and comparing models, algorithms or technologies that produce the predictions. Some journals require authors to present ROC area under curve values. There is a recent paper describing ROC use in bioimpedance application (Tronstad and Pripp 2014), which includes REG. Previous REG ROC calculation resulted AUC 0.86; ICP AUC was 0.91; linear correlation between ICP and REG showed good correlation (Spearman 
 ) (Brady et al 2010).
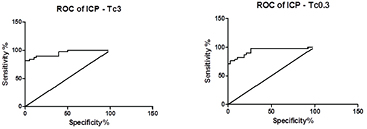
Figure 5. ROC curve with device B (left), AUC 0.9481 and device A (right) AUC 0.9335; related data see table 3. Figure was generated from REG and ICP percent change data by Prism, as was shown on figure 2. X axis is 1-specificity %.
Download figure:
Standard image High-resolution image
6. Conclusions
The novelty of this work is that instead of looking for an isolated physiologic parameter by using the REG pulse wave, we identified a physiological phenomenon (cerebrovascular reactivity), which is a practical neuro-monitoring modality and reflects the regulation process (CBF AR). Here we presented items of computerized REG data processing. Today, medical practice is increasingly computerized. Computerized data processing of analog physiological signals offers insight into the details of physiological function unimaginable decades ago, when vital signs were monitored by observation and measuring signals charted on paper. In summary, measurements of both REG and ICP reflected CBF AR. REG can be used as a noninvasive method to measure CBF AR noninvasively and continuously (in humans); whereas, measuring ICP is invasive. The suitability of REG as a brain monitoring modality is due to its potential to detect vasoreactivity and the lower limit of CBF AR (Brady et al 2010), which may indicate the onset of neurological deterioration due to edema, hemorrhage, vasospasm, hypoxia/ischemia or other causes. The REG amplifier requires optimization of Tc, since it is necessary to preserve slow waves while keeping the signal in range for automated data processing.
Acknowledgments
Special thanks to the late Emil Pásztor (1926–2015), who initiated the development of a brain monitor using REG; György Karmos, who supported this work in many way. The authors also thank Mike Falabella for surgical preparation; Lajos Baranyi for developing and use of DataLyser; Donald Brambilla for statistical support; Kornél Sipos for Cavinton donation; Janice Meer and Diana Temple for editorial and administrative help.
Disclosure/conflict of interest
The authors declare no conflict of interest.
Disclaimer
The views expressed in this article are those of the author and do not necessarily reflect the official policy or position of the Department of the Navy, Department of Defense, nor the US Government. This study protocol was reviewed and approved by the Walter Reed Army Institute of Research/Naval Medical Research Center Institutional Animal Care and Use Committee in compliance with all applicable Federal regulations governing the protection of animals in research. We are military members or employees of the US Government. This work was prepared as part of official duties; Title 17 USC 105 provides that Copyright protection is not available for any work of the US Government. This work was supported by the U.S. Army Medical Research and Materiel Command through WRAIR (CCCRP: D43_001_2008 WRAIR).
Footnotes
- *
In memory of Emil Pásztor.
- 3