Abstract
New patient monitoring technologies can noninvasively and directly provide an assessment of the adequacy of tissue perfusion through the simultaneous determination of muscle oxygen saturation (SmO2) and muscle pH (pHm). Non-pulsatile near infrared spectroscopy is used to determine these microvascular parameters. Two separate studies were conducted using an isolated perfused swine limb preparation to widely vary venous blood oxygen saturation (SviO2) and pH (pHvi) to assess the accuracy of a noninvasive sensor with the capability to simultaneously measure both parameters. The isolated limb model is necessary to establish equilibrium between the venous output of the perfusion circuit and the venule measurement of the spectroscopic sensor. The average absolute difference between SmO2 and SviO2 determined over 50 conditions of SviO2 between 13% and 83% on 3 pig limbs was 3.8% and the coefficient of determination (R2) was 0.95. The average absolute difference between pHm and pHvi determined over 69 conditions of pHvi between pHvi 6.9 and pHvi 7.5 on 3 pig limbs was 0.045 pH units with an R2 of 0.92. Measured accuracy was acceptable to support clinically relevant decision making for the assessment of impaired tissue perfusion and acidosis. Sensors were also evaluated on human subjects. There was no statistical difference in SmO2 by gender or location when multiple sensors were evaluated on the right and left calf, deltoid, and thigh of resting men and women (N = 33). SmO2 precision for subjects at rest was 5.6% over the six locations with four different sensors.
Export citation and abstract BibTeX RIS

Content from this work may be used under the terms of the Creative Commons Attribution 3.0 licence. Any further distribution of this work must maintain attribution to the author(s) and the title of the work, journal citation and DOI.
1. Introduction
Traditional patient monitoring focuses on real-time and continuous assessment of arterial blood pressure, heart rate and arterial oxygen saturation (SpO2). One of the main goals for monitoring these parameters, along with other hemodynamic variables such as cardiac output and central venous pressure, is to assure that the patient's tissues are adequately perfused with oxygenated blood. Periodic blood sampling to assess acid–base status assures the clinician that sufficient oxygen is being delivered to meet tissue metabolic demand, i.e. there is no acidosis. New patient monitoring technologies can noninvasively and directly provide an assessment of the adequacy of tissue perfusion.
Non-pulsatile near infrared (NIR) spectroscopy is used to determine microvascular oxygen saturation. NIR spectra selectively analyze arterioles, capillaries, and venules in the area of tissue under the sensor. Larger blood vessels (>1 mm in diameter) contain so much hemoglobin that all the NIR light is absorbed and none is reflected back to the detector to be measured by the optical system (Fadel et al 2004, Liu et al 1995, Mancini et al 1994). It is commonly assumed that parameters derived from NIR spectra represent the venous compartment of the tissue under the sensor (Ward et al 2006) because the venules and small veins hold 25% of the blood volume, the capillaries hold 7%, but only 2% of the blood volume is contained in the arterioles (Martini and Nath 2009). Non-pulsatile NIR spectroscopy (NIRS) is widely used to measure tissue oxygen saturation (StO2) and commercial sensors are available to assess cerebral (Pollard et al 1996) and peripheral StO2 (Myers et al 2005). It is challenging to determine the accuracy of an StO2 measurement, since a blood sample drawn from a large vein may not be representative of oxygen saturation in the microcirculation, particularly during exercise, where there is heterogeneous oxygen consumption throughout the body (MacDonald et al 1999). Beilman presented the isolated perfused canine limb model to overcome this problem and determine the accuracy of StO2 measurements on muscle (Beilman et al 2001). In this paper we describe an isolated perfused swine limb preparation and its use to determine the accuracy of a novel, commercially available NIR spectroscopic sensor4 which isolates the spectral signal of the muscle tissue from the overlying skin and fat tissue for calculation of muscle oxygen saturation, SmO2 (Yang et al 2005a, 2007).
Additionally, it has been shown that muscle pH (pHm) can be calculated from NIR spectra with pre-determined algorithms that relate pH-induced changes in the hemoglobin spectra to an independent measurement of pHm (Soller et al 2008a, Zhang et al 1998). We also describe a modification of the isolated swine limb protocol to vary pH and its use in assessing the accuracy of NIRS-determined pHm.
Accurate measurement on humans requires techniques to account for variation in skin pigment and fat thickness. The results are presented from a set of eight different sensors that were evaluated on the calf, deltoid and thigh of 33 subjects with both light and dark skin to assess SmO2 performance on humans.
2. Methods
2.1. Sensor technology
The CareGuide™ sensor's optical platform was designed to collect spectra for the simultaneous determination of SmO2 and pHm using continuous-wave (CW) (non-pulsatile) NIR spectroscopy. The sensor is adhered to the patient's skin by being inserted into a specially designed disposable sleeve, which has a window on the patient contact side (figure 1). To isolate the sensor from the patient's skin and prevent cross-contamination between patients, the window is covered with an NIR transparent film. The sleeve is designed to ensure that there is no air gap between the optical elements, the window film and the patient skin. Utilizing a large, black, flexible patient-contact surface, the sleeve ensures a conformal fit to muscles of varying circumferences such as the thigh, calf and deltoid, while ensuring good skin contact and rejection of ambient light.

Figure 1. Sleeve used to adhere sensor to the skin. Sensor inserted into the sleeve pocket; adhesive on the bottom adheres assembly to the skin.
Download figure:
Standard image High-resolution imageThe design of the spectroscopic sensor is based upon our previous Monte Carlo simulations that illustrate the effect of skin pigment and fat thickness on source–detector separation distance and depth penetration into tissue (Yang et al 2005b). The spectroscopic sensor is composed of eight banks of broadband LED light sources at varying distances from a spectroscopic detector (D). The 'S' bank (figure 2) is 6 mm from the detector and is always used to collect the spectrum of the skin layer. The banks L1–L6 are spaced 20–45 mm from D, every 5 mm. When the sensor is first placed on the patient, banks L1–L6 are serially illuminated and the reflected light is analyzed by the spectroscopic detector. A single 'L' bank is automatically selected based upon criteria to assure that light is reflected back from the muscle layer and the measurement time does not exceed the detector's specification for linearity.
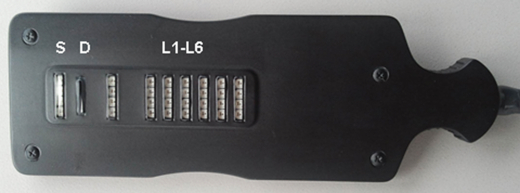
Figure 2. Spectroscopic SmO2 and pHm sensor. Illumination with the LED bank closest to the detector (S) provides spectral information on the skin pigment. Illumination of one of LED banks L1 to L6 is used to compensate for light scattering from fat. Light reflected back from the tissue is spectrally analyzed by the detector labeled D, a chip-scale spectrometer. The sensor is 139 × 47 × 13.4 mm3 and weighs 107.5 g. The LED bank between D and L1 is a second S bank spaced at 9 mm and is currently unused.
Download figure:
Standard image High-resolution imageThe CareGuide optical system is different from that typically used in SpO2 sensors. Pulse oximeters use a few LEDs at specific wavelengths and a detector without wavelength discrimination; each LED is turned on individually to determine tissue absorbance at the LED's peak wavelength. In the CareGuide sensor each bank contains a set of 12 LEDs with 6 different peak wavelengths (2 LEDS at each peak wavelength) that are turned on simultaneously to produce broadband, NIR illumination over the wavelength range 700–1000 nm. Each of the eight LED banks outputs the same spectrum with a power of approximately 0.26 mW. The illuminating light that penetrates into the tissue and is reflected back out from the muscle is detected by the chip-scale spectroscopic detector. The 1 mm wide, 8 mm long spectroscopic detector is composed of a four-element vertical stack. Light enters the top glass layer, passes through a light collimator, and into a wavelength discriminator, which spatially separates the light onto a linear charge-coupled device detector. Chip-scale spectrometers of this design have been previously described (Coates 2000, Schmidt et al 2007), though not for the NIR spectral region, nor for use on tissue.
2.2. Sensor algorithms
Algorithms on the sensor assess the reflected light signal prior to parameter calculation. If the signal does not meet pre-defined standards an optimization routine is run to re-determine the data collection parameters (integration time and long LED bank selection). The reflected light spectrum collected by the detector is converted into an absorbance spectrum using a reference spectrum that is stored on the sensor. Separate reference spectra are stored for each LED bank. Prior to calculation of SmO2 and pHm, the spectra are corrected to remove spectral interference from skin pigment. Spectra obtained from illumination with the 'S' bank of LEDs are used to assess the degree of pigmentation of the skin. This information is used to adjust the spectra to remove pigment-induced spectral artifacts. Figure 3 is one illustration of this adjustment for an individual with very dark skin and one with very light skin. Both human subjects were at rest and were expected to have similar SmO2 values and hence should have similarly shaped absorbance spectra; however the dark skinned subject (A) has a spectrum very different from the light skinned subject (C). After adjustment using information obtained from the S LED bank, the shape of the spectrum for the darkly pigmented individual (B) is similar to that of the lightly pigmented subject (D). The adjustment has minimal impact on the subject with light skin.
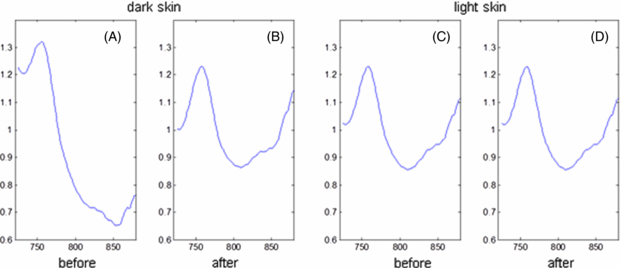
Figure 3. Result of skin pigment adjustment to tissue spectra. Each panel displays a spectrum recorded by a long bank capturing absorbance from skin, fat and muscle. The left two panels are from a very dark subject. The spectrum after correction (B) resembles the spectrum of a light skin subject (C), which changes little after correction (D). The y-axis is optical absorbance in arbitrary units, the x-axis is wavelength in nanometers.
Download figure:
Standard image High-resolution imageBoth SmO2 and pHm are calculated from pigment-corrected spectra, with new spectra acquired every 30 s. For SmO2, the effective concentrations of oxygenated hemoglobin (HbO2) and deoxygenated hemoglobin (Hb) are calculated by performing a nonlinear least squares fit of Beer's law as previously described (Yang et al 2007, Zou et al 2010). SmO2 is determined from the ratio of HbO2 to total hemoglobin (HbO2+Hb). For the SmO2 algorithm, total hemoglobin represents the concentration of blood in the tissue, rather than the concentration of hemoglobin in the blood. We have previously shown that there are pH-dependent variations in hemoglobin spectra that are independent of the pH-induced changes in SO2 (Soller et al 2012a), as have others (Alam et al 1998). The algorithm for calculating pHm from the pigment-corrected spectra was developed from a set of experiments where pH was known, producing an equation of the form of a linear combination of spectral features derived from the relevant portions of the spectrum. The coefficient for each spectral feature in the equation was also determined with the data collected during these developmental studies. The algorithms for both pHm and SmO2 are stored in the sensor memory.
2.3. Isolated perfused swine limb
SmO2 and pHm, which are spectroscopically determined from venule blood in the measured muscle, may be different from systemic venous oxygen saturation (SvO2) and pH (pHv), which are determined by analysis of blood collected from a large vein (Soller et al 2001). To evaluate the accuracy of the noninvasive SmO2 and pHm measurements we used an isolated limb preparation to limit mixing of blood from the target muscle and other tissues. In this model we controlled (separately) the level of oxygen or pH of the blood going into the muscle under the sensor and determined venous blood oxygen saturation (SviO2) or pH (pHvi) of the venous blood leaving the isolated muscle. The venous blood measurements in this preparation are expected to be equivalent to SmO2 and pHm determined with the spectroscopic sensor because of the surgical isolation of the muscle.
The isolated limb protocol was a modification of the procedure first reported by Beilman et al (2001) for canine subjects. Standard anesthesia and monitoring procedures were followed throughout the surgery. The iliac artery and vein supplying the leg to be amputated were isolated immediately distal to their origin from an insertion into the aorta and inferior vena cava respectively. These vessels were cannulated to provide input to and output from a perfusion circuit. The limb (hemipelvis and leg) was then fully amputated from the animal. Arteries and veins connected to the two cannulated vessels were cauterized as needed so that the SO2 or pH of the blood flowing through the muscle under the sensor was completely controlled with the perfusion circuit. The experimental set-up is shown in figure 4. Blood from the oxygenator went into the cannula in the iliac artery, passed through the muscle and returned through the iliac vein to the oxygenator creating a closed loop circuit. Venous blood was sampled from the line connecting the iliac vein and the oxygenator. Oxygen saturation of this blood, SviO2, is representative of blood that has passed through the muscle and has oxygen extracted by the muscle cells. pHvi determined with blood sampled from the iliac vein, is representative of the noninvasive pHm measurement. The CareGuide™ sensor was placed on the intact skin over the biceps femoris muscle of the hind limb; a CareGuide™ 1100 Oximeter sensor (Reflectance Medical, Westborough, MA) was used for the SmO2 study and Multi-Parameter Mobile CareGuide™ 3100 sensors (Reflectance Medical, Westborough, MA) were used for the pHm study. Throughout the evaluation, blood flow in the perfusion circuit was maintained between 200–300 ml min−1, hemoglobin concentration greater than 6 g dl–1, muscle temperature between 34 °C and 38 °C, and perfusion pressure between 20 and 70 mmHg. In both sets the experiment was ended if the limb could not be maintained within the prospectively defined range of hemodynamic (flow rate, temperature, pressure) and clinical chemistry parameters (hemoglobin, PO2, pH, potassium, calcium, total serum protein, glucose, and activated clotting time).
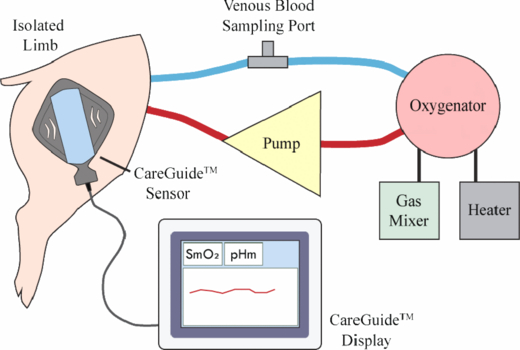
Figure 4. Isolated perfused limb experimental set-up.
Download figure:
Standard image High-resolution imageIn each of three separate limbs blood oxygen levels were varied by mixing oxygen with nitrogen in the oxygenator to achieve at least five different FIO2 levels between 10% and 85%. Blood samples were drawn from the venous line and SviO2 determined with the GEM OPL Co-Oximeter (Instrumentation Laboratory, Bedford, MA). The SO2 study was carried out at Concord Biomedical Sciences and Emerging Technologies (CBSET, Lexington, MA). In a separate study of three different limbs the pH was varied by mixing CO2 gas with oxygen in the oxygenator to achieve at least five different pH levels between 6.9 and 7.5 pH units. Blood samples were drawn from the venous line and pHvi determined with the GEM 4000 Analyzer (Instrumentation Laboratory, Bedford, MA). The pH study was carried out at Preclinical Surgical Services (Winston-Salem, NC). The animals' care was in carried out in accordance with institutional guidelines at both facilities and approved by each site's IACUC.
2.4. Human evaluation
After confirmation of eligibility, explanation of potential risks and informed consent, subjects had resting blood pressure and skin color at the site of the sensor recorded. Skin color was assessed by trained personnel using the Fitzpatrick skin color scale with subjects in class I–IV considered light skin and subjects in class V and VI considered dark skin. While the subjects were lying in the supine position sensor sleeves were placed on the right and left calves and right and left deltoids. Two different SmO2 sensors were placed in the sleeves on the right and left calves, and two additional SmO2 sensors were placed in the sleeves on the right and left deltoids. After 15 min of supine rest SmO2 was recorded for 5 min. Sensors were swapped between the right and left deltoid and right and left calf and data were again collected for 5 min.
The subject then assumed the prone position and sensor sleeves were placed on the right and left thighs. The sensor pairs were assessed on the thigh in a manner similar to that described for the calf and deltoid. Average SmO2 over the 5 min of data collection was calculated for each sensor, location (calf, deltoid, thigh), and side (right and left). Fat thickness was determined at all sensor sites from ultrasound images of the skin, fat and muscle under the sensor (SonoSite 180 Plus, Bothell, WA). The thickness was determined from the average of three measurements at each sensor location.
2.5. Data analysis and statistics
For the swine studies calculated values of SmO2 and pHm were each matched in time with the venous blood samples from the isolated limb for analysis; the average of the three sensor readings recorded immediately prior to the time of the blood draw was matched with each venous blood determination. Accuracy was calculated as the mean absolute difference between blood and sensor measurements over the entire range of each parameter and also over a narrow range representative of the region used for clinical decision making. The 95% confidence interval of the mean (CI) is also presented for each case. Trending was assessed through calculation of the coefficient of determination (R2). The bias (mean difference between blood and sensor measurements) was also determined for SmO2 and pH.
For each human subject, SmO2 and fat measurements were averaged across sensors and right and left sides to provide a single value for calf, deltoid and thigh. Differences in SmO2 between anatomical sites and gender were assessed with repeated-measures ANOVA. Gender differences as function of location were analyzed with repeated-measures ANOVA. Statistics were performed with MedCalc Version 12.3.0.0 (MedCalc Software, Mariakerke, Belgium).
3. Results
A total of six pig limbs were used in the study. On average, the intact pigs weighed 43 kg. In previous studies skin and fat thickness was determined on the site of sensor placement for eight pigs of the same weight; the average skin thickness was 2 mm with an average fat thickness of 2 mm.
The average absolute difference between SmO2 and SviO2 determined over 50 conditions of SviO2 between 13% and 83% over three pig limbs was 3.8% (CI: 3.0%, 4.7%) and the coefficient of determination (R2) was 0.95 (figure 5). The accuracy in the clinically important region of SvO2 between 40% and 60% was 1.0% (CI: 0.1%, 1.9%). The bias calculated over the entire range was −2.2%.
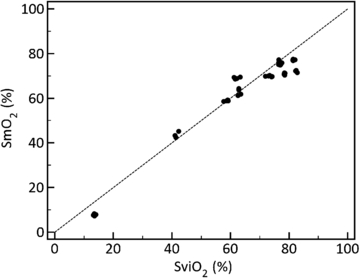
Figure 5. Comparison of venous blood from the isolated limb (SviO2) and muscle (SmO2) oxygen saturation collected from three isolated perfused swine limbs (50 unique samples). SmO2 accuracy was estimated at 3.8%, R2 = 0.95. Dashed line is line of equality.
Download figure:
Standard image High-resolution imageThe average absolute difference between pHm and pHvi determined over 69 conditions of pHvi between 6.90 and 7.50 pH units over three pig limbs was 0.045 pH units (CI: 0.038, 0.051) and the coefficient of determination (R2) was 0.92 (figure 6). Over the clinically important pHv range of 7.05 to 7.25 pH units the accuracy was 0.027 pH units (CI: 0.020, 0.033). The bias calculated over the entire range was −0.01 pH units.
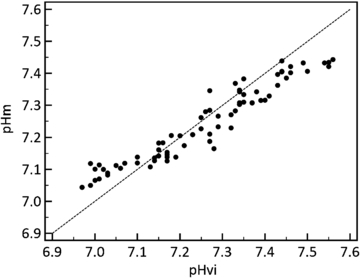
Figure 6. Comparison of venous (pHvi) and muscle (pHm) pH collected from 3 isolated perfused swine limbs (69 unique samples). pHm accuracy was estimated at 0.045 pH units, R2 = 0.92. Dashed line is line of equality.
Download figure:
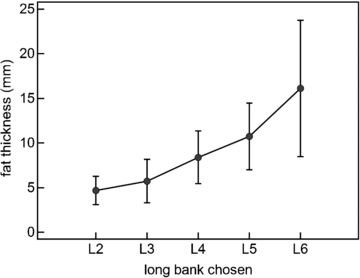
Standard image High-resolution imageThirty-three subjects were each evaluated on the right and left thigh, the right and left calf and the right and left deltoid. Eight different sensors were evaluated and four sensors were randomly selected for each subject's evaluation. Fat thickness under the sensor was determined from the average of three measurements from an ultrasound image of the area under the sensor. Figure 7 shows the average fat thickness for each of the long banks selected by the sensor software for these 33 subjects with both light and dark skin. Generally longer source–detector separations were required to acquire muscle spectra through thicker fat layers. The specific bank chosen was also influenced by the darkness of the skin pigment, the brightness of the LEDs for the particular sensor, as well as the sensitivity of the sensor's spectroscopic detector.
Figure 7. Source–detector separation selected by the sensor's algorithm increased as fat layer thickness increased. Mean ± SD.
Download figure:
Standard image High-resolution image
Table 1 shows SmO2 values calculated for the measurements on these 33 subjects separated by anatomical site and gender; there was no statistical difference in SmO2 by either site or gender. The average fat thickness for each site is also shown; women have thicker fat than men at all sites (p < 0.001). The average standard deviation for all SmO2 measurements made on each of the 33 subjects was 5.6%, representing measurement precision across the 6 anatomical locations and 4 different sensors.
Table 1. SmO2 and fat thickness for each anatomical site by gender.
| Calf | Deltoid | Thigh | ||||
|---|---|---|---|---|---|---|
| Female | Male | Female | Male | Female | Male | |
| Fat (mm) | 9.1 ± 2.5 | 5.1 ± 2.0 | 10.6 ± 5.8 | 7.7 ± 3.9 | 11.9 ± 4.5 | 5.3 ± 2.6 |
| SmO2 (%) | 65.7 ± 7.6 | 66.3 ± 5.5 | 68.0 ± 7.8 | 66.9 ± 6.4 | 65.9 ± 8.1 | 68.0 ± 5.9 |
Mean ± SD; N = 33 (17F/16M), 21 were darkly pigmented and 12 were lightly pigmented.
4. Discussion
4.1. Clinical applications
This study validated a wearable, spectroscopic sensor which noninvasively and continuously determines SmO2 and pHm. In an isolated perfused pig limb study this sensor was shown to have good accuracy and trending for both measurements over a wide range of physiological conditions and enhanced accuracy for a subset of conditions which are important in clinical decision making. In a prone or supine resting state, SmO2 was found to be equivalent across the calf, deltoid and thigh for human male and female subjects with both light and very dark skin. The sensor employs a unique multi-distance light source design with CW NIRS to correct for variations in fat thickness and skin pigment. Algorithms in the sensor automatically select the source–detector separation which provides the best optical signal for each patient. The results illustrated in figure 7 agree well with the Monte Carlo simulations performed during the initial phases of sensor design (Yang et al 2005b).
SmO2 determination has been shown to provide an early indication of central hypovolemia and compensated shock (Soller et al 2008b, 2012b, Ward et al 2010). Blood loss leads to vasoconstriction in the skeletal muscle and splanchnic circulation to shunt blood to the heart and brain, preserving blood pressure and heart rate (Berne and Levy 1997). Reduction of blood flow to the muscle leads to increased oxygen extraction from the blood and a reduction in SmO2. In our previous work carried out with earlier versions of the sensor technology, we demonstrated that resting SmO2 for healthy human subjects was 66% ±4% (Yang et al 2007), in agreement with the measurements obtained in this study. In a human laboratory model of compensated shock SmO2 decreased to between 40% and 50% before there was a drop in systolic blood pressure below 90 mm Hg (Soller et al 2012b). Measurement accuracy demonstrated in the range of 40%–60% is satisfactory to distinguish patients with normal levels of muscle oxygenation from those that are trending down because of reduced perfusion or trending up as a result of treatment aimed at improving tissue perfusion.
Blood and tissue pH decrease when there is insufficient oxygen to meet metabolic demand. Decreased pHm has been shown to be a predictor of liver injury in swine hemorrhagic shock (Soller et al 2003). Acidosis also significantly interferes with coagulation (Rossaint et al 2006). Thrombin generation is inhibited by a pH lower than 7.1 (Lier et al 2008), making it difficult for clots to form. Stored red blood cell concentrates (RBCCs) tend to become acidotic, lowering a patient's pH when they are transfused (Lier et al 2008). For clinical utility in addressing the complications associated with low pH, the noninvasive pHm sensor was shown to be sufficiently accurate to distinguish acidosis (pH less than 7.2) from normal pH (7.4).
In this study, sensor accuracy was demonstrated using an isolated perfused limb preparation to assure that the reference measurement, blood analysis to determine SviO2 and pHvi, was done on a sample that was representative of the measurement made by the spectroscopic sensor. If the study had been performed on an intact animal, blood sampling from a systemic vein would represent a mixture of blood coming from multiple muscles and organs. Blood flow throughout the experimental animal can be variable as a result of temperature variations in an experimental preparation and surgical procedures which can limit blood flow to certain regions. When comparing to SmO2 and pHm, analysis of systemic blood would result in an error in the reference measurement.
Similarly, in clinical use, the sensor measurements of SmO2 and pHm represent muscle oxygenation and pH strictly for the muscle under the sensor. Sensor accuracy could not be determined in a clinical setting for the same reason it could not be determined in an intact animal, analysis of systemic blood samples would not always represent the oxygen levels and pH in the muscle microcirculation. As noted earlier, muscle vasoconstriction is an early response to hypovolemia (Berne and Levy 1997) and microvascular imaging studies have demonstrated that sepsis results in a decrease in the proportion of perfused small vessels (De Backer et al 2013), also creating heterogeneity in blood flow. Monitoring of regional SmO2 and pHm could have clinical value by, for instance, taking advantage of the early response of the muscle microcirculation to a reduction in blood flow and the late response of the muscle to treatment which is aimed at reversing acidosis and improving tissue perfusion (Peitzman et al 1995).
4.2. Potential study limitations
It might be considered a limitation of this study that we had to use an isolated perfused limb to determine accuracy of the sensor measurements, rather than assess sensor performance in a clinical setting. Care was taken in the preparation and maintenance of the limb to assure that it remained metabolically active and with appropriate vascular responsiveness throughout the data collection. Metabolism was assessed by monitoring glucose consumption through regular blood sampling and the study was ended if glucose consumption was abnormal, an indication that the limb was no longer metabolically active. Continued response of SmO2 to small variations in blood pressure was used to assure that the muscle behaved as it would in an intact animal or patient. The advantage of using an isolated perfused limb for assessment of measurement accuracy is that it allowed us to do this evaluation over the entire physiological measurement range for each parameter.
It might also be considered a limitation that only three limbs were used for each (SmO2 and pHm) study. In each limb we were able to vary the parameter over a broad physiological range. A power analysis prior to the start of the study determined that 15 data points were needed to detect a difference of 3% between SmO2 and SviO2. A total of 50 points were collected and analyzed. For pH, the power analysis determined that 33 data points were required to determine an average difference of 0.05 pH units and a total of 69 points were collected across the 3 limbs. In both studies sufficient data were collected across three different animal limbs to assure that a statistically meaningful assessment of accuracy was performed.
4.3. Conclusions
We described a novel, noninvasive sensor with the capability to simultaneously and continuously determine SmO2 and pHm. The accuracy was evaluated in an isolated perfused limb model so equilibrium could be established between the venous output of the perfusion circuit and the venule measurement of the spectroscopic sensor. Accuracy was found to be acceptable to support clinically relevant decision making for the assessment of impaired tissue perfusion and acidosis. When evaluated on humans the sensor produced equivalent SmO2 results on resting subjects despite significant differences in fat thickness and skin pigment.
Acknowledgments
The authors would like to thank Steve Weisner, John Coates, Bruce Sargeant, Eric D'Ippolito and Ron DiMarco for their help in the design and fabrication of the sensor. The authors would also like to acknowledge Jeff Sites and Vince Mendenhall for their expert assistance in the conduct of the animal studies. This work was supported by the US Army Medical Research and Materiel Command under contract no. W81XWH-11-C-0001 and by the National Space Biomedical Research Institute under NASA Cooperative Agreement NCC 9-58. The views, opinions and/or findings contained in this paper are those of the author(s) and should not be construed as an official Department of the Army position, policy or decision unless so designated by other documentation. All authors are employees of Reflectance Medical Inc. and hold stock or stock options in the company. Dr Soller is an officer of the company.
Footnotes
- 4
At the time of manuscript submission the CareGuide™ 1100 Oximeter and the Mobile CareGuide™ 2100 Oximeter were cleared by the FDA for the measurement of SmO2 alone. The Multi-Paraeter Mobile CareGuide™ 3100, which simultaneously determines SmO2 and pHm, was pending at the FDA.