

Abstract
In preclinical studies, the absorbed dose calculation accuracy in small animals is fundamental to reliably investigate and understand observed biological effects. This work investigated the use of the split exponential track length estimator (seTLE), a new kerma based Monte Carlo dose calculation method for preclinical radiotherapy using a small animal precision micro irradiator, the X-RAD 225Cx.
Monte Carlo modelling of the irradiator with GATE/GEANT4 was extensively evaluated by comparing measurements and simulations for half-value layer, percent depth dose, off-axis profiles and output factors in water and water-equivalent material for seven circular fields, from 20 mm down to 1 mm in diameter. Simulated and measured dose distributions in cylinders of water obtained for a 360° arc were also compared using dose, distance-to-agreement and gamma-index maps.
Simulations and measurements agreed within 3% for all static beam configurations, with uncertainties estimated to 1% for the simulation and 3% for the measurements. Distance-to-agreement accuracy was better to 0.14 mm. For the arc irradiations, gamma-index maps of 2D dose distributions showed that the success rate was higher than 98%, except for the 0.1 cm collimator (92%).
Using the seTLE method, MC simulations compute 3D dose distributions within minutes for realistic beam configurations with a clinically acceptable accuracy for beam diameter as small as 1 mm.
Export citation and abstract BibTeX RIS
1. Introduction
Preclinical small animal radiotherapy studies mainly concern the development of novel radiation therapy protocols, for example by testing drugs that aim at protecting a specific organ from radiation effects or, on the contrary, sensitize it. In light of this, a small animal irradiator must reproduce as closely as possible the clinical practice to facilitate the treatment transfer from small animals to patients.
Technology in clinical radiation therapy has continued to advance, for example with the development of image-guide radiotherapy or intensity-modulated radiotherapy techniques, contrary to technology dedicated to preclinical irradiators. So far, preclinical studies in radiation therapy were carried out with machines that could not mimic clinical treatments: most of them consisted of a static radiation source that delivered a kilovoltage x-ray broad beam without integrated imaging, tumor targeting or accurate dose calculation. Consequently, over the past few years, several teams around the world have improved preclinical irradiators to reduce the technological gap between machines dedicated to patients and those designed for small animals (Verhaegen et al 2011). Cone beam computed tomography (CBCT) has been integrated to allow a better specimen positioning and a better tumor targeting. Beam dimensions have been scaled-down relative to the target sizes into small animals (rarely more than 1 cm) and multiple beam irradiations have been made possible. Once these technology issues have been overcome, the challenge was to estimate the radiation dose delivered to the specimen. Absorbed dose must be determined as accurately as possible given that many preclinical studies aim at identifying the relationship between the delivered dose and the biological effects observed in the animal. The accuracy level of dose calculation for preclinical studies should be comparable to the clinical practice accuracy defined in the AAPM Task Group 65 (Papanikolaou et al 2004). However, treatment planning for kilovoltage x-ray beam is usually limited to the determination of the dose rate at the surface (Hill et al 2014) and may introduce bias in biological studies (Noblet et al 2014). 3D dose distribution cannot be derived from this treatment planning method. The use of Monte Carlo simulations represents an interesting opportunity in this complex radiation transport problem. Monte Carlo (MC) based models of preclinical irradiators have been developed (Stojadinovic et al 2007, Tryggestad et al 2009, Zhou et al 2010, Granton et al 2012). Granton et al (2012) demonstrated the proof of concept of dose calculation for a small animal precision irradiator based on Monte Carlo method and on-board imaging. This investigation highlighted the challenges in MC modelling of a small animal irradiator combining medium energy and field sizes smaller than the focal spot size, as also demonstrated by Tryggestad et al (2009). The same team has developed a commercial treatment planning system, SmART-Plan, that offers a useful dose calculation tool. However, for various delivered plans, measured and simulated doses differed by 10% (van Hoof et al 2013). Moreover, Monte Carlo methods usually required substantial calculation time (i.e. days, weeks), incompatible with a clinical practice. Recently, Smekens et al (2014) developed a new kerma based dose scoring method, called split exponential track length estimator (seTLE) to speed up MC calculation for preclinical dosimetric calculations. They demonstrated that the seTLE method was able to improve MC efficiency of typical small animal treatment plans by one order of magnitude compared to the TLE dose scoring and three orders of magnitude compared to the MC dose scoring performed without variance reduction techniques (full MC).
In this paper, our aim was to validate this speed up method by comparing Monte Carlo simulations and radiochromic film measurements. A Monte Carlo model of the X-RAD 225Cx irradiator was developed with the MC code GATE. SeTLE simulations and Gafchromic EBT3 measurements were compared for half-value layers, output factors, percent depth dose and off-axis profiles. Finally, a gamma-index analysis was performed for typical arc-therapy treatments. Dose and distance-to-agreement criteria, adapted from clinical practice to preclinical environment according to the sizes of voxels, animals and beams, were used to compare measured and simulated dose distributions in a realistic small animal case.
2. Materials and methods
2.1. The X-RAD 225Cx preclinical irradiator
The X-RAD 225Cx (Precision XRay Inc.) is a new generation small animal irradiator originally developed at the Princess Margaret Hospital (Toronto, Canada) (Clarkson et al 2011). It consists of a dual focus x-ray tube (model: MXR225/22, Comet, Switzerland) and a digital imaging panel (model: XRD 0820 AN3 ES, Perkin-Elmer, Germany). Both are mounted face to face on a rotating arm (figure 1). Fluoroscopy or CBCT are typically performed at 40kVp and 2.5 mA using the small focal spot (1 mm in diameter). Irradiations are performed at 225kVp and 13 mA using the large focal spot (5 mm in diameter) with static beams or arcs. A set of removable collimators provides beam diameters from 2 cm down to 0.1 cm at the isocenter (table 1). Custom built cerrobend inserts can be introduced into a customizable collimator to obtain any field shapes up to 10 × 10cm2. Due to the collimation, heel effect is negligible. The specimen couch is computer-controlled so that X-Y-Z motion can be performed with an accuracy better than 0.1 mm.
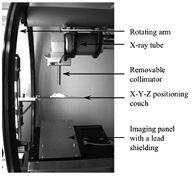
Figure 1. View from inside the X-RAD 225Cx.
Download figure:
Standard image High-resolution imageTable 1. Available field sizes and corresponding collimators.
| Field size (cm) | 10 × 10 | 2 | 1.5 | 1 | 0.8 | 0.5 | 0.25 | 0.1 | |
|---|---|---|---|---|---|---|---|---|---|
| Collimator | Name | F10×10 | F2 | F1.5 | F1 | F0.8 | F0.5 | F0.25 | F0.1 |
| Entrance aperture (cm) | 3 × 3 | 0.95 | 0.95 | 0.95 | 0.95 | 0.95 | 0.3 | 0.3 | |
| Exit aperture (cm) | 7.6 × 7.6 | 1.5 | 1.15 | 0.75 | 0.61 | 0.40 | 0.19 | 0.09 | |
2.2. Dose measurements
2.2.1. Reference dosimetry.
Calibration protocols for reference dosimetry of kilovoltage x-ray beams were detailed in a recent review by Hill et al (2014). A commonly used formalism is the protocol published in the Task Group 61 report of the American Association of Physicists in Medicine (Ma et al 2001). This protocol based on in-air kerma calibration proposes in-air and in-phantom calibration methods to derive a reference dose rate in water respectively at the surface of a water phantom and at a depth of 2 cm. Both protocols require several correction factors. The TRS 398 dosimetry protocol (Andreo et al 2000) published by the International Atomic Energy Agency (IAEA) is based on an in-water calibration and can be applied to kilovoltage x-ray beams. Up to recently, the use of this protocol was limited because only few standard laboratories had implemented absorbed dose to water calibration for low and medium energy x-ray beams. However, in the context of preclinical radiotherapy where the objective is to reproduce the clinical practice, this calibration protocol is adapted. The French national laboratory (Laboratoire National Henri Becquerel) has implemented this type of calibration protocol (Perichon et al 2013, Rapp et al 2013). Consequently, a cylindrical ionization chamber (F65-P, PTW-Freiburg GmbH, Germany) was calibrated in absorbed dose in water. This method enabled the determination of absorbed dose at a 2 cm reference depth in isocentric conditions (equation (1)).

Dwater,Q is the absorbed dose in water for a beam quality Q in reference conditions (isocentric conditions, field size 10 × 10 cm2, depth 2 cm in water). MQ is the chamber reading (corrected for temperature, pressure, ion recombination and polarity effect).  is the absorbed dose calibration coefficient obtained in water at the Henri Becquerel National Laboratory (France) with a beam of quality Q0 with a standard uncertainty of 0.9% (1σ).
  is a factor to take into account the beam quality Q.
  was linearly interpolated based on Half Value Layers (HVL) values between two standards beams, IEC 61267 RQR10 and CCRI 180 with a standard uncertainty of 1.5% (1σ). Limiting the correction factors to the single
  , the TRS 398 dosimetry protocol is more accurate. Absorbed dose in reference conditions was determined with an overall uncertainty of 1.7% (1σ). Reference measurements were performed in water in the 10 × 10 cm2 field.
2.2.2. Film measurements.
In the X-RAD 225Cx cabinet, the use of an ionisation chamber is not very convenient for point measurements with small beams and for 2D measurements whatever the field size. Radiochromic films are suitable for radiation dosimetry, including in kilovoltage x-ray beam range (Arjomandy et al 2010, Hill et al 2014). Consequently Gafchromic EBT3 films (International Specialty Products, Wayne, NJ, USA) were used to perform relative dosimetry. Films were first digitized with an Epson V700 scanner (Epson America Inc., Long Beach, CA, USA) at 48bit, just before and 24 h after their radiation exposure at the same position on the scanner bed. Film pixel size was set to 0.2 × 0.2 mm2, 0.127 × 0.127 mm2 and 0.1 × 0.1 mm2 respectively for F2 to F0.8, F0.5 to F0.25 and F0.1. Optical density values (OD) obtained before and after exposure were subtracted. Result was then converted into Gy values based on the triple channel analysis method (Micke et al 2011, van Hoof et al 2012). A 2 × 2 median filter was applied. Calibration curves for each channel were obtained by delivering known radiation dose (from 0 up to 20 Gy) to 24 films placed at the X-RAD 225Cx isocenter at a depth of 2 cm in a 30 × 30 × 13 cm3 water tank. This calibration procedure allows to measure 2D absorbed dose with radiochromic films.
2.2.3. Experimental uncertainties.
The overall accuracy of EBT3 film measurements was derived using the values proposed by van Battum et al (2008). Measurement uncertainties with EBT3 films are essentially due to scanner accuracy, intra batch film response variations, background variation in a single batch, and response dependence on energy and angular incidence of the incident beam. The mean film inhomogeneity was evaluated at 2.2% from standard deviation measurements in the center of calibration fields. All the films were from a single batch and were scanned using a limited centered area in the landscape mode, allowing to neglect the uncertainties corresponding to inter batch variations and scanner response dependence on the lateral position of the film. Dose calibration uncertainty was estimated to 2.1% (1σ) combining the TRS398 uncertainty of 1.7% and a fit accuracy of 1.2% for calibration process corresponding to the mean standard deviation of pixel values obtained for each channel in central area of each film used for calibration. Moreover, the positioning accuracy was estimated to 0.5 mm in depth leading to a variation of 0.2% in dose. An overall uncertainty of 3.2% (1σ) was obtained from the quadratic sum of previous uncertainties (table 2). This uncertainty is greater than reported values in the literature (1.8% for van Battum et al 2008 or 1.7% for Casanova Borca et al 2013) as it includes calibration and positioning uncertainties. Moreover, scan mode resolution was set to 72 dpi by van Battum et al and Casanova Borca et al whereas a minimum of 200 dpi was used in this work due to the small irradiation fields, leading to a greater standard deviation of pixel values.
Table 2. EBT3 measurement uncertainties estimated for a single batch.
| EBT3 measurement uncertainties | Variations for a single batch (1σ) |
|---|---|
| Scanner accuracy | 0.3% |
| Intra batch variations | 0.5% |
| Background | 0.5% |
| Energy dependence | 0.5% |
| Angular dependence | 0.5% |
| Film inhomogeneity | 2.2% |
| Dose calibration | 2.1% |
| Overall uncertainty | 3.2% |
Note: Scanner accuracy, intra batch variations, background, energy and angular dependence are proposed by van Battum et al (2008).
2.3. Monte Carlo simulations
2.3.1. GATE/GEANT4 X-RAD 225Cx simulations.
Monte Carlo (MC) simulations were performed with GATE v7, which is a Monte Carlo platform based on the GEANT4 toolkit specifically dedicated to medical physics applications (Jan et al 2004). It was originally designed for nuclear medicine and a recent release allows to simulate radiotherapy modalities (Jan et al 2011, Sarrut et al 2014). The proposed Monte Carlo model of the X-RAD 225Cx is described in figure 2. As MC method is time consuming, the X-RAD 225Cx model was optimized in order to save computation time. First, a photon source was chosen instead of simulating electron beam collision within the tungsten target in the x-ray tube. As stated by Hill et al (2014), the energy spectrum can be derived from an analytical calculation. The X-RAD 225Cx energy spectrum was computed with SpekCalc (Poludniowski et al 2009) with the following optimized parameters: beam angle 60°, beryllium thickness 0.8 mm and copper thickness 0.29 mm. The source was placed at the same position as the focal spot. Secondly, the beam angle was adapted at each collimator aperture (figure 2). As shown by Granton and Verhaegen (2013) the non-uniform spatial distribution of the focal spot influence the dose distribution for beam smaller than the focal spot size. In our case, the two smallest beams of 0.25 and 0.1 mm are affected. Using the focal spot image of the x-ray tube provided by the manufacturer (figure 3), a spatial-varying fluence source was created and applied for all beam sizes. For the largest beam, it allowed to take into account the real size and shape of the focal spot, and lead to better penumbra modelling.

Figure 2. Scheme of the X-RAD 225Cx model.
Download figure:
Standard image High-resolution image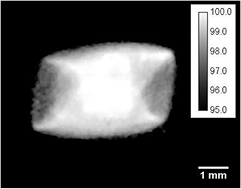
Figure 3. Focal spot image provided by the manufacturer and used in GATE simulation as a relative spatial varying intensity source. Calibration bar represents probability density of emission in percentage (black pixels are equal to zero).
Download figure:
Standard image High-resolution image2.3.2. seTLE method.
Despite the model optimisation, with standard full MC method, several days of computation on a single core were required to calculate 3D dose distributions with a good statistical uncertainty (<2%). To speed up simulation, the track length estimator (TLE) method is the state of the art variance reduction technique for low energy beams (<1 MeV). As described by Smekens et al, the split exponential track length estimator (seTLE) method is a kerma-based method combining MC splitting, ray casting and deterministic dose calculation. This method extends the splitting procedure to all photon sources, primary (x-ray generator) and secondary (interaction sites) with respectively Mp and Ms multiplicities. Inside the voxelised volume, the ray casting technique is used to perform the dose calculation during photon transportation between production/interaction sites by using attenuation and energy absorption coefficients (Smekens et al 2014). Primary and secondary multiplicities were fixed to 100 and 400 respectively for all the simulations, according to the sensitivity study made by Smekens et al. GEANT4 provides low-energy electromagnetic radiation physics models (Poon et al 2005). The emlivermore physics list, effective from 250 eV, was used for photon interactions (Photoelectric effect, Compton and Rayleigh scattering) with a cut in distance of 5 μm below which no secondary particles were generated. As a result of the use of seTLE method, the energy transferred to the electrons was assumed to be deposited locally. seTLE was used for all the simulations.
2.4. Monte Carlo dose calculation
To compute absorbed dose distributions, a factor C was calculated in order to convert Gy/particles into Gy mAs−1. This factor was the ratio between the calculated dose in water obtained in the field f, at the isocenter, at 2 cm depth and the Monte Carlo dose obtained in the same setup (equation (2)).

Where  is the reference dose measurement following equation (1),
  is the output factor for the field
  and
and  is the MC simulation result for the field
  in reference conditions.
2.5. EBT3 measurements and MC simulations comparison (beam commissioning)
Monte Carlo simulations were compared to measurements (table 3) for first and second half-value layer (HVL1,2), off-axis dose profiles (OAP), output factors (OF) and percent depth dose profiles (PDD). HVL measurement setup was adapted from the AAPM Task Group 61 recommendation (Ma et al 2001). Water equivalence of the RW3 solid material (PTW-Freiburg, Freiburg, Germany) at 225kVp was previously assessed for relative dosimetry (Chiavassa et al 2013).
Table 3. Studied parameters for the measurement and MC comparison.
| Parameter | Experimental setup | Monte Carlo setup |
|---|---|---|
| HVL | Detector PTW 31014 (PTW, Freiburg, Germany), in Air measurement, SDD 48 cm, Al layers at 24 cm from the source. | Air box with identical geometrical setup. 2 million primary particles. Statistical uncertainties <0.3%. Calculation grid: 1 × 1 × 1mm3 |
| OAP | EBT3 films placed at the isocenter, 2 cm depth in a 30 × 11 × 30 cm3 RW3 stack, profiles extracted in the anode/cathode direction. | RW3 box with identical geometrical setup. 8 million particles. Statistical uncertainties <1% at the isocenter,<2% in the effective field and <3% outside. Calculation grid: 0.2 × 0.2 × 0.2 mm3 for F2 to F0.5 and 0.1 × 0.1 × 0.1 mm3 for F0.25 and F0.1 |
| OF | EBT3 films placed at the isocenter, 2 cm depth in a 30 × 11 × 30 cm3 RW3 stack. | RW3 box with identical geometrical setup. 2 to 80 million particles. Statistical uncertainties <1%. Calculation grid: 1 × 1 × 1 mm3 for F2 to F0.8, 0.2 × 0.2 × 0.2 mm3 for F0.5 and 0.1 × 0.1 × 0.1 mm3 for F0.25 and F0.1 |
| PDD | EBT3 films inserted perpendicularly to the beam axis at different depths along the beam axis in a 30 × 11 × 30 cm3 RW3 stack. | RW3 box with identical geometrical setup. 2 · 105 to 3 · 105 particles. Statistical uncertainties were <1%. Calculation grid: 1 × 1 × 1 mm3 for F2 to F0.5 and 0.2 × 0.2 × 0.2 mm3 for F0.25 and F0.1 |
Note: Dimensions are expressed by x, y, z where y is the depth axis. SDD is the source to detector distance.
2.6. EBT3 measurements and MC simulations comparison (preclinical applications)
In our institution, typical small animal irradiations are performed with small beams and arc-therapy, that are, for example, well suited for targeting orthotopic tumors and sparing surrounding healthy tissues. An end-to-end test including the image guidance process was developed. A water-filled cylinder of 2.8 cm in diameter and 12 cm long was irradiated with a 360° arc for each collimator. EBT3 films of about 2.8 × 2.8 cm2 were placed within the cylinder in the coronal plane. Before each irradiation, CBCT images of the cylinder including the film, with voxel size of 0.2 × 0.2 × 0.2 mm3, were acquired at 40 kVp and 2.5 mA. Based on the CBCT images, the film centre was setup at the isocenter using the X-RAD 225Cx pilot program. The isocenter coordinates in the CBCT images were recorded to perform the corresponding simulation, using the same CBCT images. The 360° arc irradiation was then performed at 225 kVp and 13 mA. A total of eight EBT3 films were used. One was only imaged to be able to correct EBT3 response due to the CBCT acquisition and the remaining seven were successively scanned and irradiated respectively with the F2, F1.5, F1, F0.8, F0.5, F0.25 and F0.1 collimators. A specific Winston–Lutz correction map was used to compensate the mechanical flex of the system for each collimator except for F0.1. For this latter, the F0.25 correction map was used because no Winston–Lutz map could be acquired in the 1 mm diameter beam.
CBCT images were inserted into the simulation and materials (air, plastic, water) were assigned to all voxels by Hounsfield Unit thresholding. EBT3 films were considered as water given that they have been calibrated to obtain absorbed dose to water. The 360° arc was discretized with a 1° beam angle spacing. Dosels (dose scoring voxels) were fixed to 0.2 × 0.2 × 0.2 mm3 for F2, F1.5, F1 and F0.8, 0.127 × 0.127 × 0.127 mm3 for F0.5 and F0.25 and 0.1 × 0.1 × 0.1 mm3 for F0.1. Conversion factor defined in equation (2) was applied to reach Gy values.
A gamma analysis was performed with the RIT113 software (Radiological Image Technology, Inc.) to compare simulated and measured dose distributions (Low et al 1998). Typical gamma criteria in clinical environment are 3% for dose and 3 mm for distance to agreement (DTA). In our case, dose criterion was set to 4% given that measurement uncertainty was 3.2% and statistical uncertainty of Monte Carlo simulations was about 1%. Distance criterion was adapted from human to mouse according to image resolution (from 2 × 2 × 2 mm3 to 0.2 × 0.2 × 0.2 mm3) and beam size (cm to mm). It was set to 0.3 mm for field diameters from 2 cm down to 0.8 cm. For the three smallest fields (F0.5, F0.25 and F0.1), it was reduced to 0.2 mm.
3. Results
3.1. EBT3 measurements and MC simulations comparison (beam commissioning)
First and second half-value layer (HVL1,2) measurements were 11.5 mm Al and 14.4 mm Al respectively, corresponding to 0.92 mm Cu and 2.14 mm Cu. These values are consistent with those reported in a recent multi-institutional study (Lindsay et al 2014) for several X-RAD 225Cx units: (0.91–1.02 mm Cu) for HVL1 and (1.89–2.14 mm Cu) for HVL2. A good agreement was found between HVL1,2 measurements and seTLE simulations, with a difference of 0.3 mm Al and 0.9 mm Al respectively (table 4). For off-axis dose profiles, differences in effective (50–100%) and homogeneous (90–100%) field and penumbra (20–80%) dimensions (table 5 and figure 4) were systematically less than 0.14 mm between simulation and measurement results. As expected, because of secondary collimation, the heel effect had no impact on off-axis dose distributions. On the contrary, the influence of the non-uniform spatial distribution of the focal spot was clearly visible for the F0.25 field and to a lesser extent for the F0.1 field (figure 4(b)). The consideration of the focal spot spatial distribution in the model allowed to achieve a realistic dose distribution in these fields. Low dose simulation outside the beams differed from measurements by less than 3%. Simulated output factors showed a good agreement with measurements (table 6) with a maximal discrepancy of 2%. Measured and simulated percent depth dose profiles (figure 5) agreed within 3%. For static conditions, in homogeneous medium, deviations between simulation and measurement results were less than 3% and 0.14 mm.
Table 4. HVL values obtained by measurements and MC simulations.
| Measurement | GATE seTLE | |
|---|---|---|
| HVL1 mm Al (mm Cu) | 11.5 (0.92) | 11.2 (0.87) |
| HVL2 mm Al (mm Cu) | 14.4 (2.14) | 13.5 (1.87) |
Table 5. Simulated and measured effective field (50–100%), homogeneous field (90–100%) and penumbra (20–80%) dimensions for each field size in the anode/cathode direction.
| Collimator | Effective field (mm): dose > 50% | Homogeneous field (mm): dose > 90% | Penumbra (mm): 20% < dose < 80% | ||||||
|---|---|---|---|---|---|---|---|---|---|
| EBT3 | MC | Diff | EBT3 | MC | Diff | EBT3 | MC | Diff | |
| F2 | 19.54 | 19.58 | 0.04 | 18.49 | 18.47 | −0.02 | 0.68 | 0.70 | 0.02 |
| F1.5 | 14.97 | 15.00 | 0.03 | 13.85 | 14.00 | 0.05 | 0.65 | 0.66 | 0.01 |
| F1 | 9.78 | 9.72 | −0.06 | 8.85 | 8.79 | −0.06 | 0.62 | 0.62 | 0.00 |
| F0.8 | 7.95 | 7.99 | 0.04 | 7.09 | 7.09 | 0.00 | 0.63 | 0.61 | −0.02 |
| F0.5 | 4.94 | 5.07 | 0.13 | 4.11 | 4.22 | 0.11 | 0.61 | 0.57 | −0.04 |
| F0.25 | 2.47 | 2.51 | 0.04 | 1.77 | 1.71 | −0.06 | 0.49 | 0.51 | 0.02 |
| F0.1 | 1.20 | 1.20 | 0.00 | 0.43 | 0.49 | 0.06 | 0.53 | 0.50 | −0.03 |
Note: Differences correspond to simulated values (mm)—measured values (mm).
Table 6. Measured and simulated output factors relative to the F10×10 field at 2 cm depth in water.
| Collimator | F2 | F1.5 | F1 | F0.8 | F0.5 | F0.25 | F0.1 |
|---|---|---|---|---|---|---|---|
| EBT3 OF (%) | 68 | 66 | 62 | 60 | 57 | 45 | 35 |
| MC OF (%) | 68 | 65 | 61 | 61 | 57 | 47 | 36 |
| Relative error (%) | 0.0 | 1.5 | 1.6 | 1.7 | 0.0 | 2.2 | 2.8 |
Note: Reference dose rate at 2 cm depth in water in the F10×10 field size was evaluated at 4.06 Gy min−1. EBT3 uncertainty was 3.2% Statistical uncertainties were less than 0.3%.
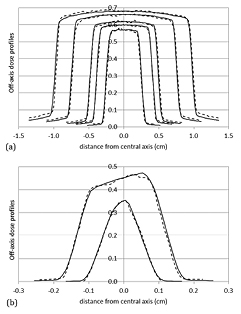
Figure 4. Measured (dotted lines) and simulated (solid lines) off-axis dose profiles for collimators from 2 cm to 0.5 cm (a) and for the two smallest collimators of 0.25 cm and 0.1 cm (b). All off-axis dose profiles were normalized at the central axis and weighted according to the measured output factors. EBT3 uncertainty was 3.2% and MC statistical uncertainties were less than 1% at the isocenter, less than 2% in the effective field and less than 3% outside.
Download figure:
Standard image High-resolution image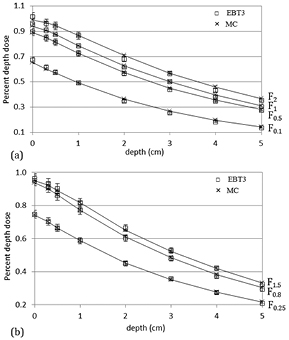
Figure 5. Measured and simulated PDD for F2, F1, F0.5 and F0.1 collimators (a), and F1.5, F0.8, and F0.25 collimators (b). PDD are weighted by OF. MC statistical uncertainties were lower than 1% and EBT3 uncertainty was 3.2%.
Download figure:
Standard image High-resolution image3.2. EBT3 measurements and MC simulations comparison (preclinical applications)
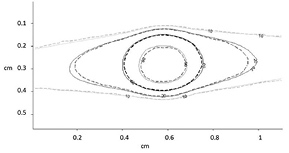
In preclinical conditions, an agreement within 2.5% was found between simulated and measured absorbed doses in the central homogeneous area (table 7). The overlay of simulated and calculated isodose lines showed a very good agreement (figure 6). This result was confirmed by the pass/fail gamma index analysis. The success rate was higher than 99% for F2 to F0.8 with 4% and 0.3 mm criteria. For F0.5, F0.25 and F0.1, the success rate was respectively 98.7%, 100.0% and 92.2%. In this latter case, the non-specific Winston–Lutz map used for the irradiation introduced some bias in the treatment delivery using this collimator.
Table 7. Measured and simulated absorbed dose in the central area (defined as 30% of the homogeneous area dimensions) of the film and success rate in gamma index pass/fail maps.
| Collimator | F2 | F1.5 | F1 | F0.8 | F0.5 | F0.25 | F0.1 |
|---|---|---|---|---|---|---|---|
| Gamma criteria (% dose and DTA) | 4% and 0.3 mm | 4% and 0.2 mm | |||||
| Success rate (%) | 99.5 | 99.7 | 99.1 | 100.0 | 98.7 | 100.0 | 92.2 |
| EBT3 dose (Gy) | 1.91 | 1.87 | 1.85 | 1.89 | 1.88 | 1.85 | 1.70 |
| MC dose (Gy) | 1.89 | 1.90 | 1.87 | 1.93 | 1.89 | 1.83 | 1.74 |
| Deviation (%) | −1.1% | 1.6% | 1.1% | 2.1% | 2.1% | 1.1% | 2.4% |
Note: Monte Carlo statistical uncertainty in the central area was lower than 1%. Measurement uncertainty was about 3.2%.
Figure 6. Overlay of isodose lines for the 360° arc irradiation with the 2.5 mm collimator (dotted lines: EBT3 measurement; solid lines: seTLE simulation).
Download figure:
Standard image High-resolution image
4. Discussion
Monte Carlo simulations are known to compute precise dose distributions for x-ray beams. However, full MC computations are very time consuming, and speed up techniques are required. The seTLE method, a kerma based method, was published recently and has been integrated into GATE. Smekens et al found that the seTLE technique accelerates dose simulation of a 360° arc irradiation with a 5° beam angle spacing by factors of 4.6 × 10³ and 2.1 × 10³ compared to the full MC method for 0.25 cm and 0.5 cm collimators respectively (Smekens et al 2014). Calculation speed up for arc irradiation decreases with collimator aperture and also depends slightly on beam angle spacing. The decrease in calculation time for a complete arc irradiation defined with a 5° beam angle spacing instead of 1° is only 11%. Considering an arc irradiation with 1° beam angle spacing and a 0.8 cm collimator, we found a speed up factor between seTLE and full MC method of 1.1 × 10³. 3D dose distributions with 2% statistical uncertainty were computed at the isocenter in a mouse brain within 104 min rather than 81.3 days on a single CPU core (2.3GHz Intel Core i7). Contrary to arc irradiations, we found that calculation speed up increases with collimator aperture for static beams. For example, the speed up factors between seTLE and full MC method are about 2.3 × 10³, 4.3 × 10³ and 5.8 × 10³ for 0.25 cm, 0.8 cm and 2 cm static beam respectively. On a single CPU core (2.3 GHz Intel Core i7), seTLE calculation times required to obtain 3D dose distributions with 2% statistical uncertainty at the isocenter in a mouse brain are 5.9 min, 19.7 min and 82.7 min for 0.25 cm, 0.8 cm and 2 cm static beams. Corresponding computation times are 9.6 d, 58 d and 336 d with the full MC method. Using seTLE method, calculation time needed to obtain 3D dose distribution with a clinically acceptable uncertainty of 2% is reduced to few minutes and becomes relevant for a routine use.
We have investigated the global accuracy level that can be reached for small animal radiotherapy in order to validate the use of a variance reduction technique such as seTLE. The AAPM Task Group 65 (Papanikolaou et al 2004) reported that the reduction of dose calculation uncertainty is a good way to achieve an acceptable global uncertainty. Global uncertainty excluding dose calculation is due to dose calibration, technical issues, patient data, patient setup and organ motion. Same consideration could be done for small animal considering a comparable technical level (IGRT, output stability...). In this study, TRS 398 dosimetry protocol was used to calculate absorbed dose in reference conditions at 2 cm depth in water. Contrary to commonly used in-air kerma based protocols, TRS 398 protocol is particularly appropriate for preclinical dosimetry as it is based on in-water calibration. In-air calibration based protocols have been originally implemented for clinical kilovoltage radiotherapy where absorbed dose is prescribed near the patient surface. They also require a backscatter factor that usually neglects the scattering conditions and only considers the beam quality and the field size. This factor introduces uncertainties, up to 15% (Noblet et al 2014). In preclinical kilovoltage radiotherapy, absorbed dose is usually prescribed in depth in the animal. As a consequence, a protocol based on in-water calibration is more suitable because it leads to a reduced uncertainty in reference dose calculation. To our knowledge, this is the first study to employ in-water calibration based TRS 398 protocol in a preclinical context.
The AAPM Task Group 65 proposed that the level of dose accuracy practically achievable would be in the order of 3% to 5% in phantom using megavoltage photons. Currently, clinical gamma index criteria typically applied are 3% to 5% in dose and 3 mm to 5 mm in distance (corresponding to about 1 or 2 pixels). In preclinical radiotherapy the same dose criterion should be considered but the distance criterion should be scaled down due to the animal size. Consequently, preclinical criteria could be 3% to 5% in dose and 0.3 mm to 0.5 mm in distance. Our gamma-index maps (4%, 0.3 mm–0.2 mm) obtained under realistic preclinical conditions showed that accuracy similar to clinical practice can be reached.
This study only focused on homogeneous medium. However, at medium energy range, tissue segmentation has a large impact on the accuracy of MC dose distributions as demonstrated by Bazalova and Graves (Bazalova and Graves 2011). Smekens et al showed that the seTLE method can manage efficiently heterogeneities (Smekens et al 2014). The kerma approximation introduced an underestimation of dose in water and an overestimation of dose in bone at the interface, and had no impact at the lung/water interface. This dosimetric impact depends on the mean incident x-ray energy and the volume resolution. With a 225 kVp beam and a 0.2 mm resolution, the impact is limited to 1 pixel on either side of the water/bone interface (Smekens et al 2014). These results suggest that GATE MC platform will allow to calculate correctly the 3D dose distribution in small animals when the material elemental composition is well known.
5. Conclusion
Small animal radiation therapy remains a challenging area: treatment technics are downsized from clinical practice and place higher demands on system precision and absorbed dose determination. Most of the time, the aim of preclinical studies in radiotherapy is to determine the relationship between the delivered dose and the biological effects observed in the animal. So an absorbed dose in small animals must be determined as accurately as possible. The proposed GATE Monte Carlo platform based on the seTLE (split exponential track length estimator) variance reduction technique was extensively validated by comparing simulation results with measurements in homogeneous media with a 225 kVp beam. The seTLE is able to improve the MC efficiency of typical small animal treatment plans by more than three orders of magnitude compared to full MC computations, providing accurate 3D dose calculation in few minutes on a single core. In addition, the accuracy level of dose calculation in typical preclinical ballistic was investigated comparatively to the accuracy level achieved in clinical practice. 3D dose distribution for realistic treatment plan can be obtained within 4% in dose and 0.3 to 0.2 mm in DTA using Monte Carlo simulations.
Acknowledgments
The authors would like to thank Anne-Marie Frelin from GANIL for the loan of the 0.1 cm collimator. Financial support was provided by a Nantes Metropole grant and a 'Physics, Mathematics and Engineering sciences applied to the Cancer Research' grant (MC SMART project) awarded by INSERM and INCa. This work was also performed in part within the LABEX PRIMES (ANR-11-LABX-0063/ANR- 11-IDEX-0007) and the Lyric INCa-DGOS-4664.