
Abstract
Accurate PET quantitation requires a matched attenuation map. Obtaining matched CT attenuation maps in the thorax is difficult due to the respiratory cycle which causes both motion and density changes. Unlike with motion, little attention has been given to the effects of density changes in the lung on PET quantitation. This work aims to explore the extent of the errors caused by pulmonary density attenuation map mismatch on dynamic and static parameter estimates. Dynamic XCAT phantoms were utilised using clinically relevant 18F-FDG and 18F-FMISO time activity curves for all organs within the thorax to estimate the expected parameter errors. The simulations were then validated with PET data from 5 patients suffering from idiopathic pulmonary fibrosis who underwent PET/Cine-CT. The PET data were reconstructed with three gates obtained from the Cine-CT and the average Cine-CT. The lung TACs clearly displayed differences between true and measured curves with error depending on global activity distribution at the time of measurement. The density errors from using a mismatched attenuation map were found to have a considerable impact on PET quantitative accuracy. Maximum errors due to density mismatch were found to be as high as 25% in the XCAT simulation. Differences in patient derived kinetic parameter estimates and static concentration between the extreme gates were found to be as high as 31% and 14%, respectively. Overall our results show that respiratory associated density errors in the attenuation map affect quantitation throughout the lung, not just regions near boundaries. The extent of this error is dependent on the activity distribution in the thorax and hence on the tracer and time of acquisition. Consequently there may be a significant impact on estimated kinetic parameters throughout the lung.
Export citation and abstract BibTeX RIS

Original content from this work may be used under the terms of the Creative Commons Attribution 3.0 licence. Any further distribution of this work must maintain attribution to the author(s) and the title of the work, journal citation and DOI.
1. Introduction
Quantitative PET images can only be obtained with accurate attenuation correction (AC) maps. These AC-maps are commonly derived from short CT acquisitions and are appropriate in regions where internal anatomical motion is unlikely (Beyer et al 2003, Osman et al 2003). However, in regions such as the thorax, these CT techniques only produce a 'snap shot' of the respiratory cycle and therefore determining a PET matched AC-map is difficult (Pepin et al 2014). Respiratory AC-map mismatches can be separated into two types, the 'motion' leading to location mismatches and the 'density' variations, due to lung fractional air volume (VA) change over the course of the breathing cycle. Mismatches due to motion have been widely explored in the literature (Nehmeh and Erdi 2008, Sun and Mok 2012) and although density variations due to the respiratory phase at the time of acquisition have long been acknowledged by the CT community (Shaker et al 2004, Gorbunova et al 2012), its effect on PET quantitation has been largely ignored.
Methods for correcting for PET/AC-map mismatch include acquiring a 'snap shot' CT at end expiration (breath hold) or while the patient performs shallow or free breathing (Goerres et al 2002, Yamaguchi et al 2009, Nyflot et al 2015). Both of these techniques have been shown to improve PET accuracy but issues still remain (Bacharach 2007, van der Vos et al 2014). Both methods involve some form of patient training and compliance can be difficult in many respiratory conditions (Sun and Mok 2012). These techniques also do not account for changes in density in the lung between the PET and CT images, only the locational mismatch. Another alternative is to use Cine-CT acquisitions, utilising the average of the acquisition to derive the AC-map (Pan et al 2005, Alessio et al 2007). This method is not widely used clinically due to the higher patient dose. However, Cine-CT does have the advantage that both location and density will be closely matched to the PET and therefore may be the best method for determination of an AC-map.
Previous work on AC-map mismatch has shown that the extent of PET quantitation errors in the region of the mismatch are not only dependent on the magnitude of the AC-map mismatch, but also on the tracer distribution surrounding the mismatched region (i.e. the activity in the thorax outside the lungs) (Thielemans et al 2008). It can therefore be theorised that the extent of the PET concentration error due to the mismatch will vary with the tracer used and time of acquisition, affecting both static and kinetic parameter estimate accuracy.
As errors due to AC-map mismatch have been shown to be mostly local, it is likely that the correction for lung density changes is only required when the lung itself is the anatomy of interest. A solid pulmonary tumour, for example, may be subject to motion due to breathing, but the tumour density is unlikely to vary throughout the course of the breathing cycle. However, lung PET/CT analysis is becoming more common with applications in chronic obstructive pulmonary disease (COPD), interstitial lung disease (ILD), infection and inflammation (Groves et al 2009, Inoue et al 2009, Win et al 2012b, Abdulla et al 2014). In the lung, the effect of mismatched PET and CT for accurate kinetic and static parameter estimates has not been previously investigated.
One condition in which both static and dynamic PET parameters have been studied in recent literature is the most severe form of ILD, Idiopathic Pulmonary Fibrosis (IPF). IPF is a fatal restrictive fibrotic disease characterised by increased lung scar tissue distorting the normal parenchyma architecture and resulting in regions of dense tissue with large air pockets (Meltzer and Noble 2008). In this patient group, the average lung density is higher than that of healthy lungs and variable across the organ. In IPF, density variations in PET images between patients and within a single patient lung have been considered post reconstruction in terms of 'air fraction correction' (AFC) (Lambrou et al 2011). AFC involves calculating the quantity of air within each lung voxel from the CT Hounsfield units (HU) and then correcting the PET image accordingly. AFC has been shown to improve PET image quantitation in the lungs of IPF patients (Win et al 2012a, 2014), however the correction method is based on deriving fractional air volumes from the CT, which if not matched, will provide an incorrect result.
AC and AFC are independent, non-related correction methods. However, both rely on the PET and CT matching with a too low density in the CT causing an undercorrection of the PET tracer concentration with AC, but an overcorrection for the AFC. It is therefore important to study the effect of attenuation mismatch on AC and AFC.
In this work, we will investigate the impact of PET/CT mismatch due to both respiratory motion and density changes, with consideration of two commonly used clinical tracers 18F-FDG and 18F-FMISO. While we concentrate on quantification in the lung, a constant high density region within the lung, representing a tumour, will also be considered to test the hypothesis that a solid lesion may be less affected by density AC-map mismatch. The extent of the errors associated with mismatched AC-maps on both AC and AFC PET quantitation within the lung and tumour will be determined for kinetic and static parameter estimates using simulations and patient data. Our investigation uses ungated non-time-of-flight (non-TOF) PET data only as this is supported by all current scanner software.
2. Methods
2.1. Patient acquisitions
5 patients, 2 males and 3 females aged  yr all with diagnosed IPF underwent 18F-FDG dynamic PET/Cine-CT in the local department using a GE Discovery VCT PET/CT scanner. All patients were imaged supine immediately post-injection using
  MBq 18F-FDG with the protocol outlined in table 1. Cine-CT imaging was acquired with a duration equivalent to the patient's complete breathing cycle plus one second. Patient scans were obtained from an ongoing study (NCT01725139) designed to explore a number of doses of a drug for engagement of pharmacology in subjects with IPF after short term dosing. All patient data used from this study were from baseline acquisitions (i.e. prior to patient dosing).
Table 1. IPF FDG patient acquisition protocol.
| Study section | Time post injection | Acquisition |
|---|---|---|
| Early | Cine-CT (1 PET bed) cine duration 4.5–6 s depending on respiratory rate | |
| 0 min | Patient injection (bolus administered over 1–3 s) | |
| 0 min | 20 min dynamic PET (1 bed):  s, s,  s, s,  s, s,  s, s,  s s |
|
| 20 min | Patient break (free to move) | |
| Late | 30 min | Cine-CT (1 PET bed) cine duration same as in previous acquisition |
| 35 min | 20 min dynamic PET (1 bed):  s s |
For use in simulations, the 18F-FMISO dynamic PET/static CT data from 1 male patient suffering from a singular nodular lung tumour was utilised. This acquisition was part of a study exploring hypoxia in oncology patients. The patient was imaged on the scanner described above immediately following injection of 330 MBq of 18F-FMISO. For the patient's comfort, the study was performed in three parts to allow for breaks. The frame timings for the first part (t = 0 min post injection) of the scan were  s,
s,  s,
s,  s,
s,  s and for the second (t = 100 min) and third (t = 200 min) parts, the frame times were both
  s.
s.
Institutional Review Board permission, MHRA approval and informed patient consent were obtained for all studies.
2.2. XCAT simulations
Thielemans et al (2008) suggest that the errors in PET tracer concentration are mostly local to the region with the AC-map mismatch and dependent on the activity distribution surrounding that region. It therefore seems to follow that the errors associated with PET/AC-map mismatch will be variable over time and different for each PET tracer utilised.
To test this theory and to gain further understanding into how the tracer kinetics affect measured uptake in the lung and whether density mismatch is a significant effect, 3 XCAT simulations were produced for each of the two tracers, 18F-FDG and 18F-FMISO. Healthy lungs were used for simulation so as to not limit the study to patients of any specific disease type, including those with cancer.
The first XCAT simulation contained mismatches due to motion and density (MD), the second with just motion (M) (i.e the density in the lung remains constant) and the third with density only (D) (i.e. the PET images are representative of a single respiratory gate and matched in terms of anatomy to the AC-maps). In both the MD and M cases, the PET is ungated.
To ensure that the simulations had the correct lung densities over the course of the breathing cycle, lung attenuation coefficients (μ-values) determined from Cine-CT data from patients with normal appearing lungs were used. The Cine-CT data were respiratory gated (see section 2.3) and the μ-values, extracted for the extreme gates (Hounsfield 1980), representing end expiration and end inspiration. The μ-values used for the lung in the end expiration and end inspiration AC-maps are 0.0231 and 0.0191 cm−1 respectively and the corresponding fractional air volumes (VA) (Lambrou et al 2011) 0.77 and 0.81 respectively.
The XCAT simulations were then created as follows:
Image generation
- (i)Determine 18F-FDG and 18F-FMISO TACs for every organ in the thorax:
- (a)FMISO—all organ TACs, except those of the lung, were obtained from the thorax of the cancer patient described in section 2.1. For the lung region, the TAC was derived from a 2-tissue irreversible compartment model fit with the input parameters defined by Wang et al (2009) as those for normoxic tissue. The reason for this is that FMISO is a tracer for investigating areas of hypoxia. A preliminary analysis of the patient data showed that hypoxic regions in the lungs of healthy patients are negligible as the kinetic parameters Ki and k3 tended to zero. Using normoxic tissue ensured that any determined errors are associated with the effect of the mismatched CT and not the ability of the optimisation algorithm to fit a zero value.
- (b)FDG—all organ TACs (including lung) were obtained from a single control patient undergoing PET/static CT imaging.
- (ii)Determine TACs for an FMISO and FDG tumour using the kinetic parameters defined in Sachpekidis et al (2015) (no appropriate in house data available for lung oncology patients) and applying a 2-tissue irreversible compartment model suitable for both 18F-FMISO and 18F-FDG when acquired over relatively short scan times (Sokoloff et al 1977).
- (iii)Create dynamic XCAT PET phantoms of the thorax with the inclusion of a 2 cm diameter high and constant density region within the lung representative of a tumour. For the MD and M cases, output 11 PET gates from the XCAT phantom, evenly spaced over the respiratory cycle (phase gated), where the breathing motion is defined by the XCAT default diaphragm and anterior-posterior motion curves. Then take an average of these 11 gates to obtain a motion averaged PET image. For D use the mid-inspiration gate only (MID).
- (iv)Create matched AC-maps with lung values representative of healthy patient densities. For the MD and M cases the matched AC-map is an average of 11 gates (AVE) and in the D case use the MID gate.
- (v)Create mismatched 'snap shot' AC-maps from the extreme gates representing end inspiration (INS) and end expiration (EXP) as well as a MID gate for the MD and M cases.
- (vi)Simulate a PET acquisition taking into account single scatter and attenuation from the matched AC-maps using the 'software for tomographic image reconstruction' (STIR) (Thielemans et al 2012).
- (vii)Reconstruct the PET data in STIR using OSEM (7 subsets, 40 iterations) both with the correct and mismatched AC-maps for attenuation and scatter correction.
Analysis—AC errors
- (i)Using masks that have been eroded away from edges determine lung, tumour and left ventricle TACs from each of the reconstructed PET images.
- (ii)Determine an input function (IF) from the left ventricle TAC by fitting a previously defined model (Feng et al 1994).
- (iii)Fit the 2-tissue irreversible compartment model (Sokoloff et al 1977) to each of the TACs and determine kinetic parameter estimates for each of the macro parameters K1 (the flow-extraction product), VB (blood volume), Ki2 (the influx rate constant determined from the 2-tissue irreversible compartment model) and the micro parameters k2 and k3 (Gunn et al 2002).
- (iv)Perform Patlak–Rutland analysis to the TACs (Patlak et al 1983) to determine KiP (the influx rate constant determined from Patlak–Rutland analysis).
- (v)Apply AFC to the reconstructed PET images as previously described (Lambrou et al 2011).
- (vi)Repeat steps (i)–(iv) above (note that the IF is not affected by the AFC).
This analysis results in 88 TACs to analyse (44 TACs without and 44 TACs with AFC). All TACs were reviewed visually and the percentage difference between the true and measured kinetic parameters were calculated. Lastly, the final time point alone was used to estimate the errors associated with acquisition of a static image.
2.3. Patient data
IPF patient 18F-FDG data acquired using the protocol outlined in table 1 were used to determine errors from mismatched PET and 'snap shot' CT. In this method it is assumed that the average Cine-CT is correctly matched to the ungated PET data. INS, EXP and MID CT gates were determined for the early and late study sections (see table 1) using PCA gating of the two Cine-CT acquisitions (Thielemans et al 2011).
The raw PET data were reconstructed using OSEM (7 subsets, 40 iterations, 6 mm FWHM filter) with each of the three gates and the average Cine-CT for AC using a GE proprietary software for off-line data processing of PET/CT data.
To obtain an input function, the average Cine-CTs for the early and late study sections were registered together using a non-rigid technique with the NiftyReg software (Ourselin et al 2001, Modat et al 2010). A manually drawn ROI over the heart and aorta was included in the registration to ensure accurate alignment of this region. The resulting deformation fields were applied to the reconstructed PET images. For each patient the IF was derived using a previously defined model (Feng et al 1994) by fitting data points obtained from a 2 cm spherical ROI placed within the ascending aorta (de Geus-Oei et al 2006). The size of the ROI was chosen to be much smaller than the diameter of the ascending aorta in order to minimise partial volume effects (van der Weerdt et al 2001).
Lung TACs were determined separately for the unregistered early and late study sections to ensure that no bias in the kinetic model could occur due to registration errors. A lung mask, eroded away from boundaries for each of the 4 reconstructions for each patient was used to determine the TACs.
The early study acquisition lasted for a period of 20 mins only and it is therefore not appropriate to apply a 2-tissue irreversible compartment model to these data. For this reason, a 1-tissue reversible compartment model was used to determine the parameters K1, VB and k2 for the early data. This was performed for each gated CT and the average Cine-CT reconstructed PET dynamics. Patlak–Rutland analysis was applied to the late images to allow calculation of KiP. Lastly, the final time point alone was used to estimate the errors associated with acquisition of a static image only. In each case, the percentage difference between the estimated parameters using the gates and the average Cine-CT was calculated.
The reconstructed PET images then underwent AFC using the appropriate average or gated Cine-CT from each study section and the above analysis repeated.
3. Results
In the following sections, EXP, MID and INS refer to the resulting PET data after reconstruction with the mismatched EXP, MID and INS attenuation maps.
3.1. XCAT simulations
The PET difference images (True−EXP) (figure 1) show that the error in the EXP image depends on both tracer and time frame, i.e. tracer distribution. The MD images show largest errors near the boundaries of the organs and the tumour. The D difference images show that using the wrong lung-density for AC causes errors in the lung tissue and in the heart, while the tumour and other surrounding regions are less affected. However, as the tracer concentration in the heart is an order of magnitude higher than in the lung, the relative error in the lung is much greater.
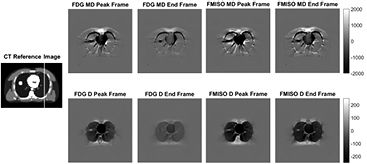
Figure 1. PET difference images (True—EXP) in Bq · ml−1 for the XCAT MD and D reconstructions for FDG and FMISO at two time frames. The true concentrations in the heart, lungs and tumour at the peak time frames are  ,
,  and
and  Bq · ml−1 respectively and for the end time frame
  ,
,  and
and  Bq · ml−1 respectively. A reference anatomical image is shown on the left which also displays the location of the profiles shown in figure 2.
Download figure:
Standard image High-resolution imageFigure 2 displays profiles across the left lung of the reconstructed FDG XCAT phantom images (figure 1) at time t = 30 s. For the D profiles, the true and mismatched AC-maps demonstrate that the errors are mostly local to the lung region as expected. Errors in the M phantom appear to be limited to the lung borders only.
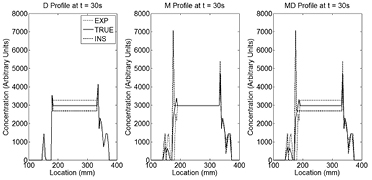
Figure 2. Profiles of the FDG XCAT D, M and MD reconstructed PET non-AFC images at time t = 30 s. PET tracer concentrations for the TRUE (solid black line), EXP (dotted line) and INS (dashed line) cases are shown. As can be seen, PET/CT mismatch errors are mostly local with the whole lung affected in the D case but only edges in the M case. The lung MD profiles are a combination of the M and D errors.
Download figure:
Standard image High-resolution imageLate time frame errors from each of the tracer simulations, both before and after AFC are shown in table 2.
Table 2. Percentage difference between measured and true PET tracer concentration results at the final time frames (representative of relative errors in SUV) of the motion and density (MD), motion only (M) and density only (D) XCAT simulations with and without AFC
| MD | M | D | |||||
|---|---|---|---|---|---|---|---|
| No AFC | AFC | No AFC | AFC | No AFC | AFC | ||
| EXP | 7.1 | −2.3 | −7.9 | −7.9 | 15.3 | 5.2 | |
| FDG | MID | 0.0 | 0.0 | 0.1 | 0.1 | ||
| INS | −10.9 | −1.7 | 3.8 | 3.8 | −14.5 | −5.6 | |
| EXP | 8.5 | −1.0 | −5.7 | −5.7 | −12.6 | 4.3 | |
| FMISO | MID | −0.2 | −0.2 | −0.1 | −0.1 | ||
| INS | −11.7 | −2.5 | 2.2 | 2.2 | −24.5 | −4.7 | |
The percentage difference between the True TAC and the INS and EXP TACs for each of the D, M and MD simulations for each tracer are shown in figure 3. It was found that the errors in the D and M simulations have opposite signs (i.e. the errors due to motion are inverted with respect to the density-related errors). The two tracer error curves were different in both shape and extent. In general, the EXP data was found to have greater errors than the INS data. The percentage differences between the MID and True TACs were found to be negligible.
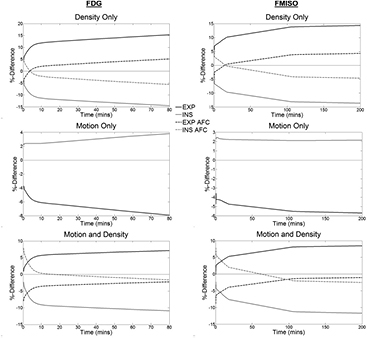
Figure 3. Percentage difference curves between the TRUE TACs and the INS (grey line) and EXP (black line) TACs in the D (top row), M (middle row) and MD (bottom row) reconstructions for both FDG (first column) and FMISO (second column). The graphs show the percentage differences before (solid lines) and after (dashed line) AFC. Note that for the motion only case, AFC is just a scaling factor and thus the curves for the non-AFC and AFC curves lie on top of each other.
Download figure:
Standard image High-resolution imageThe extent of the errors in the lung TACs derived from the AFC images (figure 3) were found to be lower than those without AFC in the MD and D cases. After AFC, for MD, the curves converge in the tail in the FDG case, while for FMISO, the EXP curve is lower in the peak than the INS curve, but higher in the tail. In the M case, the AFC acts as a scaling factor and therefore does not change the magnitude of the percentage difference curve. In all cases, there is a linear relationship between the percentage difference non-AFC and AFC curves and as such, the AFC does not change the temporal shape of the these curves.
The maximum errors for all lung derived MD kinetic parameters are shown in table 3. With the exception of k2, the FDG parameter errors were found to be lower than or equal to those of FMISO. The different methods of calculating Ki (2-tissue irreversible compartment model and Patlak–Rutland analysis) should yield the same result if there are no TAC errors. However as the shape of the TACs were incorrect, the two methods gave different results, with the Patlak–Rutland method proving more reliable. The parameter of most interest for FDG is the influx rate constant Ki (Schroeder et al 2011) which has a maximum error of −18% and for FMISO, the parameter of interest is k3 (Thorwarth et al 2005) with a maximum error of −40%.
Table 3. The true kinetic parameters (first two columns) and the maximum MD kinetic parameter percentage differences between the true and those derived from the INS, MID and EXP TACs, before and after AFC (final four columns). Note that the parameters k2 and k3 are not affected by AFC.
| True kinetic parameter | FDG | FMISO | ||||
|---|---|---|---|---|---|---|
| FDG | FMISO | No AFC | AFC | No AFC | AFC | |
| K1 | 0.06 ml · g−1 · s−1 | 0.15 ml · g−1 · s−1 | 3.9 | 14.7 | −4.1 | −6.5 |
| Vb | 0.24 | 0.10 | −3.3 | −7.2 | −3.0 | −7.1 |
| Ki2 |  s−1 s−1 |
 s−1 s−1 |
−18.0 | −9.5 | −44.0 | −38.2 |
| KiP |  s−1 s−1 |
 s−1 s−1 |
−12.9 | −3.8 | −16.6 | −7.9 |
| k2 | 1.01 s−1 | 0.20 s−1 | 31.2 | 31.2 | 2.7 | 2.7 |
| k3 |  s−1 s−1 |
 s−1 s−1 |
2.9 | 2.9 | −40.2 | −40.2 |
AFC reduced the sensitivity of the influx rate constant to mismatches in the AC-map. AFC does not affect the micro parameters (Holman et al 2015).
TACs and parameter estimates (dynamic and static) for the tumour region in the D simulation were not significantly different (max error for Ki2 of 1.4%). The MD and M cases had significant errors due to blurring of the high density region itself, suggesting that motion is the greatest component of the error.
3.2. Patient analysis
All 5 18F-FDG patient Cine-CTs were gated into 3 gates representing EXP, MID and INS. The EXP and INS patient mean whole lung fractional tissue volume ( ) were found to be
  and
and  respectively. This leads to a variation between extreme gates of
  .
.
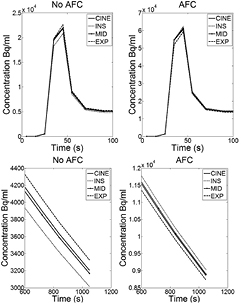
A patient example of the 1-tissue reversible compartment model fits of the early study TACs is shown in figure 4. As with the phantom simulations, the INS data are underestimated with respect to the average Cine-CT, with the reverse being true for the EXP data. The MID fit closely matches the average Cine-CT curve in all cases. In all patients, there was an observed difference in the shape of the curves between each of the gates.
Figure 4. An 18F-FDG patient example of the fitted curves for the average Cine-CT reconstruction and for each of the INS, MID and EXP gates using data from the early part of the study only. The plots show the peak (top row) and a zoomed in region between 600 and 1050s (bottom row) displayed both before (left column) and after (right column) AFC. Note that the INS is underestimated before correction and overestimated after, the reverse is true for the EXP reconstruction. Examination of the peak illustrates the errors that can arise when fitting the data using the incorrect μ-map.
Download figure:
Standard image High-resolution image
After application of the AFC, the INS data are overestimated with respect to the average Cine-CT (opposite to before AFC) again in agreement with the XCAT simulation results. AFC appeared to cause convergence in the tail of the gated curve fits for all patients.
Table 4 lists the average and range of percentage differences between the kinetic parameters derived from fitting the early TACs to the 1-tissue reversible compartment model.
Table 4. Mean (min,max) kinetic parameter percentage differences between those derived from the FDG patient PET data reconstructed with gated CT and the Cine-CT before and after AFC. Note that the parameter k2 is not affected by AFC.
| K1 | VB | k2 | |||
|---|---|---|---|---|---|
| No AFC | AFC | No AFC | AFC | No AFC | |
| EXP | 5.1 (3.1, 10.2) | −0.7 (−3.1, 3.1) | 1.7 (−1.5, 4.7) | −2.9 (−1.1,−5.0) | 1.0 (−2.4, 3.6) |
| MID | 0.9 (−1.1, 4.1) | 1.3 (0.3, 4.3) | −1.0 (0.4,−2.3) | 0.0 (0.7,−0.9) | 0.9 (−0.2, 2.7) |
| INS | −1.0 (2.1,−3.3) | 5.8 (3.4, 7.9) | −5.8 (−3.8,−7.6) | 0.7 (−1.7, 2.0) | 1.6 (−0.7, 2.9) |
Percentage differences between the Patlak–Rutland KiP from the late TACs for the average Cine-CT reconstructed data compared to each of the three gated-CTs are shown in table 5. The largest errors were found from the EXP curve. In all cases, the errors were found to be lower after AFC.
Table 5. Mean (min,max) Patlak KiP percentage differences between those derived from the patient FDG PET data reconstructed with gated CT and the Cine-CT before and after AFC. KiP values are the same order of magnitude as those found in table 3.
| KiP | ||
|---|---|---|
| No AFC | AFC | |
| EXP | 13.0 (2.5, 33.6) | 7.7 (−2.5, 28.0) |
| MID | −1.3 (1.5, −5.6) | −1.1 (1.2, −3.6) |
| INS | −8.1 (−3.9, −16.1) | −1.1 (3.7, −8.0) |
Table 6 displays the percentage differences for the concentrations found in the final time point (representing a clinical static study). In all patients, the INS concentration was found to be underestimated (by up to 9%) with the reverse being true for the EXP concentrations. As previously found (section 3.1), AFC appears to invert the signs and reduce the magnitude (by a factor of 3) of the errors found in the non-AFC results.
Table 6. Mean (min,max) percentage differences between the concentration in the final time frame representative of a clinical static acquisition. Percentage differences are those derived from the patient FDG PET data reconstructed with gated CT and the Cine-CT before and after AFC. Note the inversion of the sign before and after AFC.
| Final time frame concentration | ||
|---|---|---|
| No AFC | AFC | |
| EXP | 2.9 (1.0, 3.9) | −1.7 (−1.1, −2.2) |
| MID | −0.5 (0.6, −2.6) | −0.1 (−0.2, −0.6) |
| INS | −5.4 (−3.2, −8.7) | 1.5 (0.1, 2.7) |
The maximum percentage difference between the EXP and INS gate estimates of all the parameters are shown in table 7. The greatest errors were found for Ki.
Table 7. The maximum percentage difference between the EXP and INS parameters estimates from the FDG patient data. The errors are presented before and after AFC.
| Parameter | No AFC | AFC |
|---|---|---|
| K1 | 9.8% | −6.4% |
| VB | 12.4% | −5.9% |
| k2 | −5.1% | −5.1% |
| KiP | −30.8% | −23.6% |
| Final time point | 13.8% | −4.8% |
4. Discussion
Quantitative imaging in the thorax is known to be complex due to respiratory effects. While motion correction has been extensively reviewed in the literature, little attention has been given to density changes. In this paper, for the lung, it has been shown that not accounting for CT density changes within the lung can lead to significant errors in estimated parameters and that these errors are dependent on the tracer distribution at the time of imaging, the extent of the density variation and the volume change of the mismatched region.
The AFC attempts to account for density effects post reconstruction by removing the air component within each voxel. Without this correction, true activity concentration in the lung tissue will be underestimated. This method has been reviewed elsewhere and shown to improve quantitative accuracy (Lambrou et al 2011, Win et al 2012a, 2014, Holman et al 2015). Here it is the effect of the wrong AC-map on AFC that is of interest.
This work used XCAT phantoms to perform realistic simulations of dynamic and static patient data with different tracer distributions. Analysis of patient data confirmed the XCAT simulation results providing confidence in the conclusions drawn.
The effect of PET and CT mismatch on regions both within lung tissue (e.g. lung tumours) and outside the lung tissue (e.g. the heart) were investigated (figure 1). In these regions, simulations that included motion were excluded from analysis due to region edge delineation difficulties and partial volume effects. The density only simulations produced negligible relative errors in parameter estimates and therefore lung density mismatches are unlikely to affect these regions. Our results are in agreement with previous work which found that PET/AC-map mismatch errors are mostly local (Thielemans et al 2008). Density mismatches are therefore not considered a concern for studies involving solid lung tumours of any size. The remainder of this discussion is limited to effects within the lung tissue and away from lung boundaries.
With reference to table 2 and figure 3, PET and CT density mismatches were found to have larger absolute parameter estimate errors irrespective of the tracer used when compared to motion mismatches. Density only and motion only errors were also found to have opposite signs. This is because the effect of overestimating lung size is an overestimation of the attenuation due to increased path length, leading to an overestimation of the PET tracer concentration while an underestimation of density (large lungs at end inspiration where density is low) results in an underestimation of the attenuation and hence the PET tracer concentration.
The overall motion and density errors were found to be less than the motion only and density only errors alone due to the sign change discussed above (table 2). This implies that if a lung imaging study is corrected for motion alone (i.e. use of registration without density compensation) then the errors on the parameter estimates may be higher than they were before the correction.
The errors in the motion and density TACs were found to be within 13% (figure 3) but the extent of the error varied over time. It is therefore possible to obtain a TAC with a shape considerably different to the truth. The result is that large errors in estimated kinetic parameters are possible even with smaller changes in the TAC at any given time point (tables 3 and 5).
The AFC factor is derived from the CT and will be incorrect if the density is mismatched to the PET. The observed result after incorrect AFC is that the TAC is overestimated at early time points and underestimated at late time points if a CT map around end expiration is used (vice versa around end inspiration) (figures 3 and 4). The result is that the shape of the error curves vary depending on the tracer used, explaining the differences seen in the FDG and FMISO parameter estimate errors (table 3).
The only rate constant affected by the AFC has been shown to be K1 (and any parameter containing K1) (Holman et al 2015). It is therefore expected that this parameter may be more sensitive to the wrong values being used for the correction factor when the PET and CT are mismatched and this has been found to be true (tables 2–6 and figure 3). The errors in influx rate constant and end time frame concentration (representative of SUV) were found to reduce after AFC when compared to the non-AFC results. However, the extent of this reduction is dependent on μ, tracer and activity distribution within the thorax. Therefore, while AFC is clearly not a 'correction' for the effects of mismatch, the importance of applying the AFC in reducing errors and providing more stable results for these parameters is clear (Lambrou et al 2011, Win et al 2014).
The Patlak–Rutland influx rate constant is determined from the tail of the TACs only, and is less affected by early curve errors discussed above. This parameter should therefore be more accurate and stable than that from the compartment model as confirmed in table 3. Nevertheless, in patient data, KiP was still found to have a 28% difference to that of the average Cine-CT after AFC table 5.
For patient image analysis, average Cine-CT was used to represent true matched CT. This assumption requires acquisition of a 'typical' breathing cycle to match appropriately. However, comparison of the early and late Cine-CTs acquired in the same patient displayed small variations due to the short CT scan times (the fractional tissue volume change between the two average scans was  ). Nonetheless these variations in lung density between the Cine-CTs were considerably lower than those resulting from the use of 'snap-shot' CTs and therefore, Cine-CT is still considered one of the best solutions for matching the PET and CT, although further validation is required.
Another limitation to this work is the use of 3 CT gates only to derive the EXP, MID and INS gates in the patient data. This means that each gate is an average over a third of the breathing cycle and does not reflect the extreme change in μ-values that could occur in regular clinical practice. The patient results presented here may therefore be an underestimate of the possible errors associated with PET/CT mismatch. Comparison of the patient and XCAT simulations display the same trends in results and as the XCAT data simulate a larger density change over the breathing cycle, they may provide more representative errors.
The μ-value change over the breathing cycle could be considerable and is different between patient groups. For example, the IPF patients in this study had a relative change in lung density over the breathing cycle of 9%, but previous work Kauczor et al (2002) has found that for healthy lungs this difference is 40% on average. However in the work by Kauczor et al (2002) the density change is likely to be an overestimate when compared to free breathing as it is calculated from forced end expiration and forced end inspiration. Our own data suggests a 20% difference in density for free breathing.
The final limitation to this work is that only non-TOF PET was used for the analysis. If TOF PET were used, it would be expected that these errors would reduce as it has been shown that the TOF PET reconstruction is less sensitive than non-TOF to mismatches in the PET and CT acquisitions (Conti 2011). Further work is required to ascertain if density change leads to significant errors with TOF PET.
To reduce the errors due to PET and AC-map mismatch, it is recommended to use a Cine-CT to allow for density changes over the respiratory cycle, the Patlak–Rutland technique to determine Ki with the disadvantage that other parameters cannot be determined and to apply the AFC as it provides results which are more stable and have lower bias. As an alternative to Cine-CT it is possible to gate the PET and only reconstruct the gate that matches to the acquired CT or to train the patient such that a MID CT can be acquired. However, patient compliance is difficult to achieve (Sun and Mok 2012).
The errors determined in this study are significant when utilised for monitoring disease progression or for other clinical trials in which the patient is imaged multiple times. This is because the AC-maps for each study may not be acquired at the same part of the breathing cycle and may therefore increase test-retest error results. Accounting for CT density changes to ensure parameter stability is therefore essential in these types of studies.
Accounting for density PET/CT mismatch errors is also important for patient studies with regional lung density variations such as those with IPF. The kinetic parameter errors within these patients will vary across the lung, possibly limiting the extent of the analysis that can be performed due to the need for small ROIs and therefore a large noise component. This will be the subject of future work.
In gated PET studies, each gate is often reconstructed with a single CT acquisition however, the resulting mismatch in density between gated PET and CT will be larger than in the ungated PET case studied in this paper, resulting in larger errors. If gated PET is to be used, accounting for the density change over the breathing cycle is crucial for lung studies.
Finally, this study also has implications for PET/MR. In PET/MR, application of a true μ-map is impossible and instead AC-maps are derived from MR data (Wagenknecht et al 2013). These AC-map approximations may lead to significantly greater errors in lung PET quantitation than observed in this work.
5. Conclusion
Respiratory induced lung density changes between PET and CT acquisitions are an important contribution to the errors in lung tissue PET quantitation. The extent of these errors depends on the tracer used, the density variation in the patient's lung over the breathing cycle and the tracer distribution within the thorax at the time of measurement. While correcting for motion is vital, not accounting for density changes will give rise to errors in both static and kinetic parameter estimates. In some cases, correcting for motion alone can lead to larger errors than not correcting at all. Air Fraction Correction (AFC) has been shown to be less sensitive to density mismatches, although errors are still appreciable.
Acknowledgments
We acknowledge funding support from GlaxoSmithKline (STU100028576), General Electric Healthcare and the Engineering and Physical Sciences Research Council (EP/K0052781/1 and 13220093). Also, this project is supported by researchers at the National Institute for Health Research, University College London Hospitals Biomedical Research Centre. The authors would like to thank Ottavia Bertolli and Robert Shortman for all their advice and assistance with this study.