

Abstract
Change in PET-based textural features has shown promise in predicting cancer response to treatment. However, contouring tumour volumes on longitudinal scans is time-consuming. This study investigated the usefulness of contour propagation in texture analysis for the purpose of pathologic response prediction in esophageal cancer.
Forty-five esophageal cancer patients underwent PET/CT scans before and after chemo-radiotherapy. Patients were classified into responders and non-responders after the surgery. Physician-defined tumour ROIs on pre-treatment PET were propagated onto the post-treatment PET using rigid and ten deformable registration algorithms. PET images were converted into 256 discrete values. Co-occurrence, run-length, and size zone matrix textures were computed within all ROIs. The relative difference of each texture at different treatment time-points was used to predict the pathologic responders. Their predictive value was assessed using the area under the receiver-operating-characteristic curve (AUC). Propagated ROIs from different algorithms were compared using Dice similarity index (DSI).
Contours propagated by the fast-demons, fast-free-form and rigid algorithms did not fully capture the high FDG uptake regions of tumours. Fast-demons propagated ROIs had the least agreement with other contours (DSI = 58%). Moderate to substantial overlap were found in the ROIs propagated by all other algorithms (DSI = 69%–79%). Rigidly propagated ROIs with co-occurrence texture failed to significantly differentiate between responders and non-responders (AUC = 0.58, q-value = 0.33), while the differentiation was significant with other textures (AUC = 0.71‒0.73, p < 0.009). Among the deformable algorithms, fast-demons (AUC = 0.68‒0.70, q-value < 0.03) and fast-free-form (AUC = 0.69‒0.74, q-value < 0.04) were the least predictive. ROIs propagated by all other deformable algorithms with any texture significantly predicted pathologic responders (AUC = 0.72‒0.78, q-value < 0.01).
Propagated ROIs using deformable registration for all textures can lead to accurate prediction of pathologic response, potentially expediting the temporal texture analysis process. However, fast-demons, fast-free-form, and rigid algorithms should be applied with care due to their inferior performance compared to other algorithms.
Export citation and abstract BibTeX RIS
1. Introduction
Early prediction of cancer response to therapy can guide physicians to select an effective therapeutic strategy for individual patients, while avoiding complications associated with ineffective or unnecessary treatments. Malignant tumours often demonstrate substantial spatial heterogeneity in metabolism, vasculature, oxygenation, and gene expression (Maley et al 2006, Gerlinger et al 2012, Marusyk et al 2012, Fisher et al 2013). The spatial heterogeneity is commonly found in cancer patients and can hinder efficacy of cancer treatment leading to poor clinical prognosis (Marusyk et al 2012). Therefore, accurate assessment of intra-tumour heterogeneity and its evolution during treatment may provide crucial information for treatment response prediction.
Recently, studies have hypothesized that the intra-tumour heterogeneity may be reflected in the spatial variations in tumour 18F-fluorodoxyglucose (FDG) uptake captured on the positon emission tomography (PET) images (Henriksson et al 2007, Tixier et al 2011, Lambin et al 2012, Tixier et al 2012, Chicklore et al 2013, Leijenaar et al 2013, Cook et al 2014). In particular, intra-tumour heterogeneity can potentially be quantified with textural features extracted from FDG-PET images through complex mathematical models of the spatial relationship between multiple image voxels (El Naqa et al 2009, Tixier et al 2011, 2012, Davnall et al 2012, Cook et al 2014, Rahim et al 2014). The change in textural features during treatment have been used to assess the temporal evolution of intra-tumour heterogeneity and shown promise in predicting tumour response to therapy (Tan et al 2013, Yang et al 2013).
Accurate contouring of tumour volume is important for computing textural features and their change (Hatt et al 2013, Velazquez et al 2013, Orlhac et al 2014, Parmar et al 2014, Dong et al 2015). However, re-contouring of tumour volume on longitudinal images acquired over the course of therapy manually is very time-consuming. Propagation of tumour contour between the longitudinal PET/CT images using image registration of their CT counterparts may provide an automatic way to re-contour tumour volume for textural feature computation (Lu et al 2006, Thörnqvist et al 2010, Faggiano et al 2011, Hardcastle et al 2013, Tan et al 2013). For example, Tan et al (2013) rigidly registered the CT images acquired before and after preoperative chemo-radiotherapy in 20 esophageal cancer patients. The transformations resulting from the registration was then applied to their corresponding PET images to align the tumour region-of-interests (ROIs) for texture extraction. The relative difference of the textures at different treatment time points was calculated within the aligned ROIs to predict the pathologic response (Tan et al 2013). However, when images from different treatment time points are registered, rigid registration may be inadequate to account for tumour deformation, necessitating deformable image registration (Castadot et al 2008, Grégoire et al 2012, Yip et al 2014).
Deformable image registration is required to account for tumour growth or shrinkage occurring due to disease progression and treatment. Although deformable registration may improve the accuracy of contour propagation and treatment response prediction, the variations in driving forces and regularization between the associated algorithms can result in different solutions in image registration (Modersitzki 2004, Rogelj and Kovačič 2006, Damas et al 2011, Glocker et al 2011). Choosing an unreliable algorithm can introduce severe errors in the propagated contours, leading to inaccurate texture quantification and prediction of therapeutic response. Ideally, the most reliable registration algorithm for contour propagation would be identified by evaluating the performances of different algorithms against ground truth tumour contours. As ground truth is often unavailable in the case of real patients' tumour deformation, the impact of the image registration algorithms on the predictive value of textural features needs to be carefully studied. Using the pathologic response evaluated from surgical resection, we benchmarked the performance of various textural features in treatment response prediction computed from contours propagated by different registration algorithms.
In this study, contours of forty-five esophageal cancer tumours were propagated using one rigid and ten deformable registration algorithms, and then used to extract the textures from PET images. We compared the values of textural features calculated from different algorithm-based propagated contours in predicting the pathologic response to preoperative chemo-radiation.
2. Methods and materials
2.1. Patients
This retrospective study was conducted under Brigham and Women's Hospital and Dana-Farber Cancer Institute institutional review board (IRB) approved protocol. This study included forty-five patients (7 females and 38 males, median age = 65 yr) with esophageal cancer (1 tumour/patient) receiving [18F]FDG-PET/CT scans 1–2 weeks before and 2–4 weeks after the preoperative chemo-radiotherapy. While there were forty-four patients had adenocarcinoma, only one patient had squamous cell carcinoma. Table 1 shows the clinical tumour stage assessed before the initiation of treatment according to the TNM staging criteria established by the American Joint Committee on Cancer (7th edition).
Table 1. TNM classification before and after chemo-radiotherapy.
| No. of patients | |
|---|---|
| Pre-chemo-radiotherapy staging (cTNM) | |
| T-stage [T1/T2/T3] | 1/12/32 |
| N-stage [N0/N1/N2/N3] | 13/20/11/1 |
| M-stage [M0/M1] | 44/1 |
| Post-surgery pathologic staging (ypTNM) | |
| T-stage [T0/T1a/T1b/T2/T3] | 8/5/5/8/19 |
| N-stage [N0/N1/N2/N3] | 29/9/3/5 |
| M-stage [M0/M1] | 44/1 |
Patients were injected with 10.3–22.4 mCi of [18F]FDG and scanned about 65 min after the injection on a GE Discovery (GE Healthcare, Waukesha, WI) or a Siemen Biograph (Siemens AG, Erlangen, Germany) PET/CT system. The acquisition time was 3–5 min/bed position for a whole-body scan from the base of skull to the proximal femora. The acquired PET data was reconstructed using iterative reconstruction. Attenuation correction of PET images was performed using the CT images. The PET/CT scans acquired after chemo-radiotherapy are hereafter referred to as post-treatment PET/CT scans.
2.2. Pathologic response classification
Surgery was performed 3 to 12 weeks after preoperative chemo-radiotherapy. All surgical specimens were examined and staged (ypTNM) (table 1). The patients were then classified into responders (downstaging) and non-responders (upstaging or no change in stage) to preoperative chemo-radiation. Thirty and fifteen patients were identified as responders and non-responders respectively.
2.3. CT–CT registration
Tumour region-of-interests (ROIs) with average volume of 74 cm3 (range: 6–440 cm3) were manually defined by an experienced radiation oncologists using both the pre-treatment PET and CT images. All CT images were cropped using ROIs plus five voxels margin to include tumour and its surrounding tissues. The cropped pre-treatment CT were rigidly registered to the post-treatment CT with normalized mutual information. The rigidly registered CT images were then deformably registered using ten deformable registration algorithms. These algorithm were already implemented in a MATLAB-based (The Mathworks Inc. Natick MA) open source toolkit: DIRART (Urschler et al 2007, Yang et al 2011, Kirby et al 2013). The ten deformable algorithms included (1) Lucas–Kanade optical flow (LK) (Lucas and Kanade 1981), (2) Horn–Schunck optical flow (OF) (Horn and Schunck 1981), (3) Least mean square filtered optical flow (LMS) (Elad and Feuer 1996), (4) Iterative optical flow (IOF) (Barron et al 1994), (5) Fast iterative optical flow (FIOF) (Yang et al 2008), (6) Inverse consistency Horn–Schunck optical flow (IHS) (Barron et al 1994, Yang et al 2008), (7) fast demons (FD) (Thirion 1996, 1998). (8) fast demons with elastic regularization (FDE) (Modersitzki 2004), (9) Symmetric-demons (DD) (Thirion 1998, Rogelj and Kovačič 2006), and (10) fast free form (FFF) (Lu et al 2004).
A multi-resolution scheme was used in all algorithms to decrease the computational time as well as to prevent the deformation vector fields (DVF) from converging at local minima (Lu et al 2004, He et al 2005). The number of iterations and the multiresolution parameter for each deformable registration were optimized according to the maximum normalized mutual information and minimum root mean square difference.
2.4. Contour propagation
The workflow of the contour propagation generation and texture extraction procedures is shown in figure 1. The resulting DVF resulting from the CT registrations (figure 1, step 1) were applied to manually defined ROIs in order to propagate these ROIs from the pre-treatment to the post-treatment PET/CT images (figure 1, step 2). For each patient, eleven registration algorithms (i.e. one rigid and ten deformable algorithms) were generated.
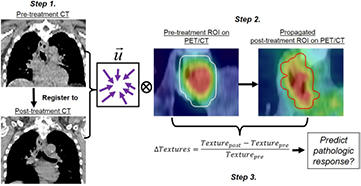
Figure 1. Propagated contour generation and pathologic response prediction. Step 1. Vector field ( ) obtained from pre- and post-treatment CT co-registration. Step 2. Vector field is applied to pre-treatment ROI to generate a propagated ROI that defines tumour volume on the post-treatment PET. Textures are calculated within all the ROIs Step 3. The relative difference of each texture at different treatment time-points was used to predict the pathologic response. Locations of the tumour indicated by the red arrows in Step 1.
Download figure:
Standard image High-resolution image2.5. Texture features
Numerous textural features can be extracted from PET images (El Naqa et al 2009, Chicklore et al 2013, Aerts et al 2014, Cook et al 2014, Rahim et al 2014). However, if we were to assess the predictive value of all of these textures, then at least some textures would be shown to be predictive of pathologic response merely based on random chance alone (Miller 1981). Therefore, only three textures, including Gray level co-occurrence matrix (GLCM) derived Entropy (Haralick et al 1973, Rahim et al 2014), Run length matrix (RLM) derived Short-run high gray run emphasis (Galloway 1975) and, size zone Matrix (SZM) derived Short-zone high gray emphasis, were included for the analysis (Thibault et al 2013). These three textures were chosen due to their demonstrated potential in predicting therapeutic response (Tixier et al 2011, Hatt et al 2013, Tan et al 2013, Yang et al 2013).
Prior to texture feature computation, all PET images (PET( )) were preprocessed using the following equation,

where minPET and maxPET are the maximum and minimum intensities of PET within the tumour region. The intensity range of the post-processed image ( ) was converted into 26 (64), 27 (128), and 28 (256) discrete values. The default resampling value was chosen to be 256. RLM and GLCM textures were computed with a single matrix that accounted for the run-length and co-occurrence properties spanning in the X, Y, and Z directions as well as the X–Y, X–Z, and Y–Z planes. No averaging step of multiple matrices was involved.
We calculated the pre-treatment and post-treatment metabolic tumour volumes within the pre-treatment manually defined and propagated ROIs respectively. Metabolic tumour volumes (MTV) were defined using the threshold-based region growing method (Cheng et al 2013, Fang et al 2014). To define the MTV, a seed point was defined within the registration-based propagated ROI, and then all the inter-connected voxels with SUV > 40% SUVmax created a mask. Finally, hole-filling was performed on the mask to create the metabolic tumour volume. The PET-based textures were computed within the MTV using MATLAB-based Chang-Gung Image Texture Analysis Toolbox (CGITA) (figure 1, step 3). We observed that the 40%˙SUVmax thresholded MTV encapsulated the majority of the tumor volume for all patients within the physician-defined ROI, and was sufficient for our study to investigate the effect of contour propagation in texture analysis. Five examples of heterogeneous tumours that are shown to be fully included in the thresholded volume can be found in the supplement (stacks.iop.org/PMB/61/906/mmedia).
2.6. Data analysis
2.6.1. Propagated contour comparisons.
For each tumour, the post-treatment tumour ROI propagated by the eleven different registration algorithms were compared. In total, 55 (11•(11-1)/2) algorithm pairs were compared. We investigated the agreement of the propagated contours generated with different registration algorithms using the average Dice similarity index (DSI),

The propagated contour Cj generated by the algorithm j was compared to the contours (Ci) generated by the other ten registration algorithms. The average DSI (DSIj) ranged from 0%–100% with 0% if there is no overlap between two propagated contours. DSI is equal to 100% if the contours have identical shapes and are located in the same position.
2.6.2. Pathologic response prediction.
The relative difference (ΔTexture) of each texture at different treatment time points was used to quantify the change in tumour texture values before and after the chemo-radiotherapy (figure 1, step 3). Particularly, the relative difference (ΔTexture) was defined as follow

where Texturepre and Texturepost are the textural features extracted from the PET images acquired before and after the chemo-radiotherapy respectively. ΔTexture indicates the temporal change in texture values during chemo-radiotherapy.
Univariate analysis was performed using R (version 3.1.1) using the pROC and survcomp package from Bioconductor (Gentleman et al 2004, Schröder et al 2011). We assessed the predictive value of the ΔTexture by evaluating their ability to differentiate patients to differentiate responders and non-responders. The performance was quantified using the area (AUC) under the receiver operating characteristic curve. AUC is interpreted as the probability of correctly classifying the patients into different response categories (i.e. responder and non-responder). AUC ranges from 0 to 1 with the value 1 indicates perfect classification. In this study, ΔTexture with AUC ⩾ 0.70 was considered to accurately differentiate between responders and non-responders (Terwee et al 2007, Arimond et al 2010, Tan et al 2013). The value of ΔMTV in predicting pathologic response was also assessed.
AUC < 0.50 indicates that the ΔTexture perform worse than random prediction (Hanley and McNeil 1983). Noether test was used to determine if AUC was significantly different from random (AUC = 0.50) with p < 0.05 for each quantitative measure (Noether 1967, Bamber 1975). For each tumour, we evaluated the predictive value of 33 textures (3 textures were computed within 11 different propagated contours). All the p-values were adjusted (q-values) using the Benjamini–Hochberg false discovery rate (FDR < 0.05) to correct for multiple testing (Benjamini and Hochberg 1995).
Furthermore, to assess the complementary value of MTV and textures in pathologic response prediction, Spearman's correlation coefficient was used to determine the relationship between MTV and the textures and their temporal change.
3. Results
All contour propagation and texture computation were performed using a personal computer with 16 GB of RAM and Core i7-4770 CPU at 3.40 GHz. The average computational time required for contour propagation and texture computation for each tumour was 15 ± 13 s and 4 ± 3 s respectively.
3.1. Propagated contour comparison
As observed in figure 2, contours propagated by the Fast-demons, Fast-free-form, and rigid algorithms were not aligned with the tumour metabolic volume. Fast-demons propagated contours had the least agreement with the other contours (DSI = 0.58), while substantial agreement was found with fast-free-form propagated contours (DSI = 75%). The rigid propagated contours moderately overlapped with contours propagated by the other algorithms with average DSI = 71% (figures 2 and 3). Despite only moderately overlapped with other contours (DSI = 69%), IHS algorithm propagated contours were observed to fully encompass tumour high FDG uptake regions (figure 2). Contours propagated by all other algorithms were observed to include tumour avid regions and had substantial agreement with other propagated contours with average DSI ⩾ 0.75 (figures 2 and 3).

Figure 2. Propagated contours (white contours) generated by five different registration algorithms. IHS = inverse consistency Horn–Schunck optical flow algorithm. The PET/CT images are displayed in SUV window = [0 4].
Download figure:
Standard image High-resolution image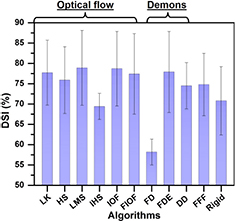
Figure 3. Average DSI of propagated contours comparisons. Results are organized as optical-flow related, demons related, fast-free-form (FFF), and rigid algorithms.
Download figure:
Standard image High-resolution imageThe average pre-treatment MTV of all forty-five patient ROI was 23 cm3. The average MTV defined among the rigid-registration-based propagated contours was also 23 cm3. Among the deformable-registration-based propagated contours, average MTV ranged from 13 to 18 cm3.
3.2. Pathologic response prediction
Regardless of the registration algorithm employed, the performance of ΔEntropy for differentiating responders from non-responders was poor (AUC < 0.70) for resampling values below 128 (figure 4). For ΔEntropy computed with 256 discrete values, rigid (AUC = 0.56, q-value = 0.33), fast-demons (AUC = 0.69, q-value = 0.03), and fast-free-form (AUC = 0.69, q-value = 0.04) algorithms performed poorer than all other algorithms (AUC = 0.71–0.76, q-value < 0.01) in responders differentiation (figure 1). The best performing algorithm for ΔEntropy was the Lucas–Kanade (LK) optical flow algorithm. The boxplots in figure 5 demonstrates visually that ΔEntropy, ΔShort run high gray run emaphasis, and ΔShort zone high gray emphasis computed using the propagated contours generated by the Lucas–Kanade optical flow algorithm outperformed the fast-demons and rigid algorithm in separating responders and non-responders.
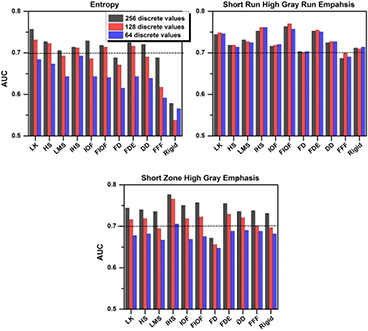
Figure 4. The predictive value (AUC) of ΔTextures computed with different algorithm propagated contours. AUC < 0.70 indicates poor performance in pathologic response prediction.
Download figure:
Standard image High-resolution image
Figure 5. ΔEntropy (top row), ΔShort run high gray run emphasis (middle row), and ΔShort zone high gray emphasis (bottom row) computed with contours propagated by Lucas–Kanade, Fast-demons, and rigid algorithms. Each dot in the boxplot represents ΔTexture for one tumour.
Download figure:
Standard image High-resolution image
The performance of ΔShort Run High Gray Run Emphasis in responder differentiation was not sensitive to the resampling values with AUC ~ 0.70 (q-value < 0.03) for all algorithms (figure 4). The best performing algorithms for ΔShort Run High Gray Run Emphasis were Fast iterative optical flow (FIOF) and Inverse consistency Horn–Schunck (IHS) (AUC = 0.76–0.77, q-value = 0.001), while the worst performing algorithms were fast-demons and fast-free-form (AUC = 0.68–0.71, q-value < 0.03).
Regardless of the registration algorithms used, the performances of ΔShort Zone High Gray Emphasis in differentiating responders from non-responders were poor (AUC < 0.70) for resampling values below 128 (figure 4). The worst performing algorithm was Fast-demons algorithms with AUC = 0.65–0.69 (q-value = 0.03–0.09). For ΔShort Zone High Gray Emphasis computed with 256 discrete values, all other algorithms, including rigid, led to significantly separation of responders and non-responders with AUC = 0.73–0.78 (q-value < 0.006). The best performing algorithm was IHS (AUC = 0.78, q-value = 0.0005).
Regardless of the registration algorithm employed, ΔMTV performed poorly in predicting pathologic response with an AUC < 0.68 (q-value > 0.36). Short run high gray run emphasis and Short zone high gray emphasis were poorly correlated with the tumour volume with |R| = 0.03–0.25 and 0.00–0.49, respectively. The correlation between Entropy and tumour volume increased from 0.69 to 0.98 as the resampling values increased. Despite the correlations between ΔMTV and ΔTextures increased with resampling values, the correlations only ranged from poor to moderate (|R| < 0.79).
4. Discussion
Change in PET-based textural features over the course of therapy has shown promise for prediction of therapeutic response. However, re-contouring of tumour region-of-interest (ROIs) on longitudinal PET images is required for computation of textural features and their evolution. The tumour ROIs can be propagated between the pre- and post-treatment PET/CT images using image registration of their CT counterparts. For each tumour, the average computation time for contour propagation and texture computation performed on a personal computer was less than 30 s. We showed that contour propagation may greatly expedite the process of temporal texture analysis.
For all textural features, propagated tumour contours using deformable registration, except fast-demons and fast-free-form algorithms, can lead to accurate prediction of pathologic response. Contours propagated by fast-demons algorithm not only had the least agreement with other contours, but also performed poorly in pathologic response prediction (AUC < 0.70 for all ΔTextures). Rigid registration algorithm failed to account for tumour deformation, leading to misalignment of rigidly propagated contours and tumour metabolic volume observed in figure 2. Fast-demon and fast-free-form generated contours were observed to misalign with tumour high FDG regions (figure 2). ΔEntropy and ΔShort run high gray emphasis computed with rigidly and fast-free-form-based contours also performed poorly in pathologic response prediction with AUC ranging from 0.58 to 0.70. Propagated contours by all other deformable algorithms were observed to better align with the tumour metabolic regions, leading to ΔTextures with greater predictive values in pathologic response. Particularly, textures computed within these contours significantly separated responders and non-responders (AUC > 0.70, q-value < 0.01). Among the deformable registration algorithms, inverse consistency Horn–Schunck (IHS) outperformed all other algorithms in pathologic response prediction with AUC > 0.75 (q-value < 0.002) for run length and size zone matrix textures. Therefore, IHS is recommended for contour propagation to reduce physician workload in tumour re-contouring. However, rigid, demons, and fast-free-form algorithms should not be used due to their inferior performance compared to other algorithms.
The predictive value of Short run high gray run emphasis was robust to registration-based propagated contours and resampling schemes, while Entropy and Short zone high gray emphasis were not. Substantial variation was observed in the predictive values of ΔEntropy and ΔShort zone high gray emphasis between different resampling values (figure 4). Orlhac et al (2014) computed 31 textures with resampling values ranging from 8 to 128 on 188 PET images consisting of metastatic colorectal, lung, and breast cancer lesions (Orlhac et al 2014). They showed that the textures, especially Entropy and Short zone high gray emphasis, computed with less than 32 values are unreliable. While our study also showed that Entropy and Short zone high gray emphasis were the most sensitive to resampling schemes, we found that the computation of predictive textural features requires a resampling scheme with at least 128 discrete values instead of 32 (figure 4). Although tumour contours resulting from different algorithms were different in shape and location, the ability of ΔShort run high gray run emphasis in predicting pathologic response remained nearly 0.70 or above for all resampling values. Therefore, contour propagation with IHS algorithm combined with Short run high gray run emphasis may provide the most robust and accurate prediction of which patients may or may not benefit from preoperative chemo-radiation.
Studies have shown that intratumoural heterogeneity for small tumour volumes may not be accurately quantified (Brooks and Grigsby 2014, Hatt et al 2015). Using probability theory, Brooks and Grigsby (2014) extracted GLCM-Entropy from PET images in 70 cervical cancer tumour and found that GLCM-Entropy computed for tumours <45 cm3 were strongly correlated to tumour size, and therefore may not accurately measure intratumoural heterogeneity (Brooks and Grigsby 2014). However, their conclusion was based on theoretical analysis, one texture, and a single tumour type. Hatt et al (2015) computed four prognostic textural features on 555 PET images acquired from multiple cancer centres consisting of breast, cervical, NSCLC, esophageal, and head-and-neck tumours (Hatt et al 2015). They found that textures have no added value for outcome prediction for tumours <10 cm3. However, instead of excluding tumours with volumes <10 cm3 in future texture studies, they recommended that the correlation of textures and tumour volume should be always reported to highlight if the measures provide independent or redundant information (Hatt et al 2015).
In this study, the average pre-treatment and post-treatment tumour volumes were 23 cm3 and >13 cm3, respectively. The correlation between Entropy and tumour volume was observed to increase from 0.69 to 0.98 as the resampling value increased from 64 to 256. Our results are consistent with the results found in the study by Hatt et al (2015) (Hatt et al 2015). In particular, Hatt et al (2015) found that the Spearman correlation coefficient between Entropy and tumour volume increased from 0.60 to nearly 1.00 when the resampling value increased from 64 to 256. On the other hand, Short run high gray run emphasis and Short zone high gray emphasis were poorly correlated with tumour volumes with R < 0.50 for all resampling values. However, ΔTextures and ΔMTV were only moderately correlated, suggesting that the ΔTextures may provide added predictive value compared to the tumour size. This may explain why ΔTextures generally outperformed ΔMTV in pathologic response prediction (figure 4).
Accurate contouring of tumour volume may not be needed for pathologic response prediction. The applications of image registration included contour propagation (Lu et al 2006, Hardcastle et al 2013), dose deformation (Stella et al 2006, Veiga et al 2014), and treatment response assessment (Bradshaw et al 2014, Yip et al 2014). Deformable registration algorithms vary in their driving forces and regularization, and therefore differ in their solutions (Modersitzki 2004, Rogelj and Kovačič 2006, Damas et al 2011, Glocker et al 2011). Choosing an unreliable algorithm can lead to inaccurate image registration, introducing severe errors in its applications. Due to a lack of absolute ground truth contours, assessment of the absolute performance of registration accuracy was not the primary goal of our study. In this study, we employed the registration-based propagated contour to define the tumour ROIs for texture computation and pathologic response prediction. We observed that while contours propagated by two different algorithms may disagree, they can both lead to significant differentiation between responders and non-responders. For example, although the overlapping volume of IHS and symmetric-demons (DD) propagated contours was only 64% (figure 2), ΔTextures calculated within both contours accurately predicted pathologic response with AUC ⩾ 0.72 (q-value < 0.01, figure 4). Our results suggest that as long as the propagated contours align with the tumour metabolic regions, the variability in the shape and size of the tumour ROIs generated by different deformable registration algorithms has no substantial impact on the predictive value of textures.
Our study investigated whether different contour shapes and volumes resulting from propagation with different algorithms can affect the predictive value of textural features. The novelty of our study is that pathologic response acquired from surgical resection was used as the benchmark for the predictive value of textures. We demonstrated that ΔShort run high gray run emphasis remained predictive of pathologic response for all resampling values and all registration-algorithm-based propagated contours (figure 4). In this study, only three textural features and eleven algorithms were employed. Including additional textures that characterize large groups of image voxels (e.g. long run and large zone (Galloway 1975, Thibault et al 2013)) and other commonly used registration algorithms (e.g. b-spline and finite element method (Crouch et al 2007, Yin et al 2009, 2011, Hualiang et al 2012)) may improve the accuracy of pathologic response prediction. Our run-length matrix textures were computed based on a single matrix that accounted for 9 directions compared to 13 directions in some PET textures studies, such as (Hatt et al 2015, Leijenaar et al 2015). The impact of additional textures and different texture implementation methods on pathologic response need to be further studied in a larger patient dataset.
The performance of the registration algorithms may be specific to disease sites (Zhong et al 2010, Kirby et al 2013, Nie et al 2013). For example, Nie et al (2013) simulated soft-tissue deformation in patients with spine, head-and-neck, and prostate cancers (Nie et al 2013). They found that while a free-form deformable algorithm can accurately register bladder deformation in the prostate, it performed poorly in the spine region. Most deformable registration algorithms employed are mainly driven by well-defined edges of the tumor and its surrounding anatomy ( ) on pre-treatment CT images (Horn and Schunck 1981, Thirion 1996, Lu et al 2004, Modersitzki 2004). In our study, esophageal tumors were located in the mediastinum wall and had poor image contrast (ill-defined edges) with surrounding organs (e.g. esophagus, heat, aorta, and trachea) on CT images. Therefore, registration algorithms may fail to differentiate the esophageal tumor, esophagus and surrounding anatomy, leading to inaccurate registration. On the other hand, the Inverse-consistency Horn–Schunck (IHS) optical flow algorithm registers both the pre- and post-treatment CT images symmetrically and incrementally towards each other until they match (Yang et al 2008). Therefore, the IHS algorithm may be less sensitive to poor tumor-background organ contrast compared to asymmetric algorithms, such as fast-demons and fast-free-form algorithms. Furthermore, registration algorithms regularize the deformation vector field (
 ) to ensure spatial continuity and differentiability of
  (Modersitzki 2004). However, different registration algorithms apply different schemes for regularizing DVF. These approaches can be categorized as constraining the magnitude of the Laplacian of DVF (
 ) or its derivative (e.g. Fast free form algorithms), applying a Gaussian filter to DVF at each iteration (e.g. Demons algorithms), constraining deformation of tumor tissue as incompressible elastic material (e.g. Demons algorithms with elastic constraint), dividing the entire image into small regions and assumes that the DVF is nearly uniform within each region (e.g. Lucas–Kanade optical flow algorithm) (Horn and Schunck 1981, Lucas and Kanade 1981, Thirion 1996, Lu et al 2004, Modersitzki 2004). We found that the textures extracted from the contours propagated by most algorithms were generally predictive (figure 4). As this study is specific to esophageal cancer, certain registration algorithms with particular regularization schemes may be more appropriate for particular cancer types. The potential application of contour propagation in texture analysis for treatment response prediction in other cancer types is beyond the scope of this work.
Furthermore, registration accuracy may also depend on factors such as resampling schemes, iteration number, multiresolution parameters and the free parameters of the algorithms (Derek et al 2001, Zitová and Flusser 2003, Modersitzki 2004, Zhong et al 2010). For example, Zhong et al (2010) simulated anatomical deformation of the lung and prostate in patients' CT images (Zhong et al 2010). They found that about 300 iterations was required for a demons algorithm to reduce registration error to 1.4 mm in lung cancer patients, while over 1500 iterations was needed to reach registration accuracy of 2.0 mm in prostate cancer patients. Therefore, optimizing these parameters for a specific disease or individual patient may improve the registration results. However, for our study, the registration algorithms and their chosen parameters for this analysis were not meant to be exhaustive. Our results were sufficient to show that contour propagation with robust features, such as ΔShort run high gray run emphasis, can potentially reduce the physician workflow in tumour contouring and treatment response assessment. However, the fast-demons, and fast-free-form algorithms should be used with care as the accuracy of quantification textural features and their predictive values may be sensitive to various parameters.
There are two limitations of our study. First, we defined the MTV on thresholded PET images with SUV > 40% ·SUVmax. Other groups have observed that defining the MTV using a fixed threshold may fail to fully encapsulate the extent of tumour heterogeneity (Hatt et al 2011, Dong et al 2015). Hatt et al (2011) and Dong et al (2015) both suggested that a MTV segmented by advanced algorithms (e.g. fuzzy locally adaptive Bayesian (FLAB) or adaptive thresholding) may better capture the extent of tumour heterogeneity. Despite this limitation in our study, many ΔTextures‒registration combinations were found to significantly predict pathological response (figure 4). Comparing and optimizing PET segmentation methods (e.g. fixed percentage threshold versus fixed number threshold versus adaptive thresholding versus FLAB) and their effect on texture analysis would be an interesting topic of future investigations.
Second, some textures can be unstable between imaging scans acquired even within one week of each other (Tixier et al 2012, Leijenaar et al 2013). For example, Tixier et al (2012) found that the value of Short zone high gray emphasis (High intensity small-area emphasis) could vary as much as 60% between double baseline PET scans (Tixier et al 2012). However, in our study, the median difference in Short zone high gray emphasis between the pre- and post-treatment scans ranged from −19% to 5% and 8% to 21% for responders and nonresponders, respectively (supplement–table S1 and S2) (stacks.iop.org/PMB/61/906/mmedia). While changes in texture during treatment were only moderate, ΔShort zone high gray emphasis was observed to significantly differentiate responders from nonresponders (figures 4 and 5). The predictive value of ΔTextures was dependent on the relative difference between the responders and nonresponders (figure 5). As long as the instability in the textures was consistent for every tumor, the relative difference remained nearly unchanged and thus, the predictive value of ΔTextures preserved. However, the impact of variations in textures between double baseline PET images on the ability of the texture to predict treatment outcomes remains unclear and needs to be carefully studied.
5. Conclusions
For each tumour, the average computation time of contour propagation and texture computation performed on a personal computer was less than 30 s. Propagated tumour region-of-interests using deformable registration for all textures can lead to accurate prediction (AUC > 0.70, q-value < 0.01) of pathologic response in esophageal cancer, potentially expediting the temporal texture analysis process. However, rigid, fast-demons, and fast-free-form algorithms should be used with care due to their inferior performance compared to other algorithms. All other algorithms may potentially be used for contour propagation for the accurate prediction of treatment response.
Acknowledgments
This work is in part supported by the Kaye scholar grant from the Brigham and Women's Hospital. The authors would like to acknowledge the support from the National Institute of Health (U01CA190234 and U24CA194354).