
Abstract
Recently, there has been an increased interest in imaging different pulmonary disorders using PET techniques. Previous work has shown, for static PET/CT, that air content in the lung influences reconstructed image values and that it is vital to correct for this 'tissue fraction effect' (TFE). In this paper, we extend this work to include the blood component and also investigate the TFE in dynamic imaging. CT imaging and PET kinetic modelling are used to determine fractional air and blood voxel volumes in six patients with idiopathic pulmonary fibrosis. These values are used to illustrate best and worst case scenarios when interpreting images without correcting for the TFE. In addition, the fractional volumes were used to determine correction factors for the SUV and the kinetic parameters. These were then applied to the patient images. The kinetic parameters K1 and Ki along with the static parameter SUV were all found to be affected by the TFE with both air and blood providing a significant contribution to the errors. Without corrections, errors range from 34–80% in the best case and 29–96% in the worst case. In the patient data, without correcting for the TFE, regions of high density (fibrosis) appeared to have a higher uptake than lower density (normal appearing tissue), however this was reversed after air and blood correction. The proposed correction methods are vital for quantitative and relative accuracy. Without these corrections, images may be misinterpreted.
Export citation and abstract BibTeX RIS

Content from this work may be used under the terms of the Creative Commons Attribution 3.0 licence. Any further distribution of this work must maintain attribution to the author(s) and the title of the work, journal citation and DOI.
1. Introduction
Recently whole lung PET/CT imaging has become a popular methodology for studying a variety of inflammatory, infectious, obstructive and fibrotic pulmonary diseases (Groves et al 2009, Inoue et al 2009, Win et al 2012, Abdulla et al 2014). Imaging the lung is known to be difficult due to respiratory motion and this has been extensively explored within the literature (Nehmeh and Erdi 2008, Sun and Mok 2012). However little attention has been given to the tissue fraction effect (TFE).
The TFE, a component of the partial volume effect, is the result of the finite size of an image voxel. In the lung, the average size of an alveolus is approximately 0.008 mm3 (Ochs et al 2004), 6000 times smaller than the typical PET voxel. Consequently, a single voxel will contain air and multiple tissue components including blood and parenchyma. The resulting voxel value will then be an average of the tracer concentrations within that voxel and not the signal from the parenchyma alone as required.
The importance of correcting for the air component in the lung in PET/CT SUV studies has already been presented for patients with idiopathic pulmonary fibrosis (IPF) (Lambrou et al 2011, Win et al 2012, 2014). This fatal restrictive fibrotic disease is characterized by an increase in lung scar tissue which distorts the normal parenchyma architecture resulting in regions of dense tissue with large air pockets (Meltzer and Noble 2008). In this patient group an increase in 18F-FDG uptake was seen in regions of fibrosis in comparison to normal appearing lung regions (Groves et al 2009). As there is a greater tissue component in the fibrotic regions, consideration was given to the TFE. By taking into account the lung air content, it was shown that the uptake distribution actually appeared uniform throughout the lung (Lambrou et al 2011, Win et al 2012, 2014). Correcting for the air component therefore alters image interpretation.
Another contribution to the TFE, the blood, has not been explored yet in the literature. Blood is a large component of the lung voxel (∼20%) (Wollmer et al 1984) and adds to the PET signal. It therefore affects voxel concentration and must be accounted for. There are many published methods for determining blood volume within the lung including indicator dilution (Dock et al 1961), radiocardiographic techniques (Lewis et al 1970), cardiovascular magnetic resonance (Ugander et al 2009, Kanski et al 2013) and dual energy CT acquisitions (Fuld et al 2013). Unfortunately, these techniques are either invasive, use contrast agents not suitable for all patients and/or result in whole lung blood volume estimates and not regional or local values. An alternative method, which is utilised in this paper, is to use dynamic PET acquisitions to estimate blood volume at a voxel level (Gunn et al 2002).
As PET/CT imaging of whole lung diseases is still poorly understood, dynamic analysis is also being used to explore tracer and drug kinetics (Jones et al 1998, Chen and Schuster 2006, Schroeder et al 2008, De Prost et al 2010, Schroeder et al 2011, Dittrich et al 2012). However, to date the influence of the TFE on the kinetic parameters has not been studied.
In this paper we develop methods for correcting for the TFE in both static SUV studies and kinetic analysis. We investigate the possible parameter estimate errors if the air and blood components of the TFE are not accounted for. Finally, we apply these corrections to patient data to determine the significance of correcting for air and blood.
2. Theory
2.1. Air fraction correction in static imaging
Lung voxel air fraction correction (AFC) was first discussed by Lambrou et al (2011). In their paper, Lambrou et al assume that a lung voxel contains only two components, air and tissue, where tissue is the combination of both parenchyma (the non-blood cellular and extra cellular components that make up the lung) and blood. Under this assumption, the Hounsfield Units (HU) within a CT voxel can be considered as

where  ,
,  and
and  are the HU of the lung voxel (CT voxel value), air and tissue respectively and
  and
and  are the fractional air and tissue volumes in the voxel respectively, where
  . Therefore, once the CT has been filtered to the resolution of the PET image and downsampled, the PET voxel fractional air volume can be determined from simple rearrangement of equation (1):

The PET concentration can then be corrected using equation (3):

Where  is the measured (non-corrected) tracer concentration and
  is the tracer concentration in tissue after AFC. Once the AFC has been applied, the corrected voxel values are those that would have been present without the air component (i.e. just blood and parenchyma). However, to obtain an accurate parenchyma fraction, as is required, a further correction for blood is needed.
2.2. Blood fraction correction in static imaging
Equation (1) can be expanded to include the blood component as follows:

where HUb and HUpa represent the HU of blood and parenchyma respectively (which are approximately equivalent (Hounsfield 1980)) and  and
and  are the fractional blood and parenchyma volumes in the voxel respectively.
Image concentration can be corrected for the parenchyma fraction as before with  (where
  ) replacing
  in equation (3). However, the significant amount of blood in the lung voxel also makes it vital to correct for any PET signal that may originate from blood. Therefore the complete correction for the concentration becomes:

where  is the blood concentration, determined from an aorta or ventricle region of interest (ROI). In this paper we demonstrate that equation (5) is far more appropriate than equation (3) for comparing between patients and between patients and controls. The difficulty is that the static PET/CT does not provide information on
  , unlike
  which can easily be calculated from the CT image. However,
  can be estimated directly from kinetic analysis if it is included in the model fit (section 3.4).
2.3. Correcting kinetic parameters for the TFE
Standard kinetic modelling methods are formulated assuming that the voxel or ROI contains only parenchyma and blood, i.e.  . The voxel concentration can then be assumed to be:

where  ,
,  and
and  are the activity concentrations in the voxel (or ROI), blood and parenchyma respectively. Equation (6) allows the simultaneous fit of
  and the kinetic parameters of the chosen model for
  (Tsoumpas and Thielemans 2009). Now, consider the lung case where air is present such that
  but
but  , then the appropriate air and blood corrected (ABC) model would be:

where  is the tracer concentration in air.
  will be zero unless the tracer has been administered using the inhalation method.
To correctly determine the kinetic parameters, one of three methods can be utilised: (1) use a model that follows general equation (6) and then correct the estimated parameters affected by the TFE by multiplication of  , (2) directly fit a kinetic model to the measured data using equation (7), (3) precorrect the dynamic images for
  (as in section 2.1) and then fit the data as follows:

where  and
and

which is the blood volume as a fraction of the tissue.
To determine which of the estimated kinetic parameters will change after the corrections to equation (6) have been applied, consider the corrected general equation for a compartment model (Gunn et al 2002):

where, n is the number of compartments in the model,  is the clearance from compartment i,
  the applied weighting and
  the concentration in the plasma. From this equation it can be seen that it is the
  parameters that will be affected by the TFE. As
  , the delivery of the tracer to the tissue, it is only K1 and any parameter containing K1 (e.g. the influx rate constant (Ki)) that will require corrections.
As Ki is affected by the TFE, all of the above theory is also applicable to Patlak analysis (Patlak et al 1983) where the corrected curve equation would be:
where D is the intercept of the tissue fraction corrected Patlak curve. Unfortunately, as is the case with static image analysis, equation (11) requires knowledge of  , a parameter not normally determined during Patlak analysis. However,
  can be determined from the early part of the time activity curve (TAC), see section 3.4.
3. Methods
3.1. Patient data acquisition
Six patients, three males and three females aged  yrs all with diagnosed IPF underwent 18F-FDG dynamic PET/CT using a GE Discovery VCT PET/CT scanner (Teras et al 2007). All patients were imaged supine immediately post-injection using
  MBq 18F-FDG with the protocol outlined in table 1. Cine-CT imaging was acquired with a duration equivalent to the patients complete breathing cycle plus one second. Five of the six patient scans were obtained from an ongoing study (NCT01725139) designed to explore a number of doses of GSK2126458 for engagement of pharmacology in subjects with IPF after short term dosing. The remaining patient's scan was part of an ongoing study (MREC 06/Q0505/22) designed to explore the prognostic value of PET/CT in patients with interstitial lung disease. Institutional Review Board permission and informed patient consent were obtained for both studies and MHRA approval was obtained for study NCT1725139.
Table 1. Patient acquisition protocol.
| Time post injection | Acquisition |
|---|---|
| Cine CT (1 PET bed) cine duration 4.5–6 s depending on respiratory rate | |
| 0 min | Patient injection |
| 0 min | 20 min dynamic PET (1 bed)  s, s,  s, s,  s, s,  s, s,  s s |
| 20 min | Patient break (free to move) |
| 30 min | Cine CT (1 PET bed) cine duration same as in previous acquisition |
| 35 min | 20 min dynamic PET (1 bed)  s s |
3.2. Simulations—kinetic analysis
To investigate the errors associated with not accounting for air and blood within a voxel, four simulated TACs were created based on real patient parameters. These TACs were constructed to represent best and worst case scenarios for investigating the difference between normal and fibrotic regions. A best case scenario is where the difference in the fraction of parenchyma in the fibrotic and normal appearing tissue is as low as possible. This would give rise to similar PET voxel signals in both cases and would occur when the normal appearing regions have the lowest possible blood and air fractions (greatest possible parenchyma fraction) and the fibrotic regions have the highest air and blood fractions. Conversely, the worst case scenario is where the difference in the fibrotic and normal appearing tissue parenchyma fractions is high. Under these circumstances, the average PET voxel values in each region would appear to have the greatest contrast.
To achieve realistic values for the four TAC simulations, we used results obtained from patient analysis (section 3.4).  and
and  were calculated for all six patients to determine the highest and lowest air and blood fractions in the fibrotic and normal appearing regions (see table 2). An example patient derived input function (IF) was also determined. Additionally a set of kinetic parameters (K1, k2 and k3) from a single patient were estimated for the whole lung TAC using the recommended FDG kinetic model, the 2 tissue irreversible compartment model (2-ICM) (Sokoloff et al 1977).
Table 2. Patient derived air, blood and parenchyma fractions in fibrotic and normal appearing regions for the best and worst case scenarios.
Air fraction  |
Blood fraction  |
Parenchyma fraction  |
|
|---|---|---|---|
| Best case 'Fibrotic' | 0.43 | 0.18 | 0.39 |
| Best case 'Normal' | 0.66 | 0.14 | 0.20 |
| Worst case 'Fibrotic' | 0.37 | 0.15 | 0.48 |
| Worst case 'Normal' | 0.75 | 0.19 | 0.06 |
Having estimated a patient's whole lung kinetic parameters, the four simulated noise free TACs were created where only the air and blood fractions were varied using:

where TrueCurve is the simulated parenchyma response using the 2-ICM with the known patient derived kinetic parameters.
For each TAC the kinetic parameters were estimated using the 2-ICM and with Patlak analysis. The percentage difference between the true and estimated parameters with no corrections (NC), blood fraction correction (BFC) only and AFC only were determined in order to calculate the errors caused by not applying the full ABC correction method. The percentage difference between parameters determined in the normal and fibrotic regions were also calculated in each case as may be considered when only relative and not absolute comparison is required.
3.3. Simulations—SUV
The standardised uptake value (SUV) is the most common parameter used in the clinical setting (Thie 2004). It is a measure of concentration normalised to the injected activity (A) and the patients weight (W):

Errors in SUV associated with not accounting for air and blood within a voxel were investigated. As in section 3.2, best and worst cases were created. In addition, two patient representations were determined (based on the data from the six patients), each with different blood tracer concentrations. This is because SUV, unlike the kinetic parameters, is affected by the concentration in blood as well as the  , introducing a further source of error specific to comparisons between patients and between patients and controls.
For the simulations, the final time point of the TrueCurve derived in section 3.2 was used to represent the true whole lung parenchyma concentration (and hence SUV) in a static image. The best and worst case concentrations for the fibrotic and normal appearing regions were achieved by applying the simple re-arrangement of equation (5) and using the  and
and  values in table 2. For the concentration in blood, the mean and standard deviation of the aorta concentrations at the final time point for all six patients was determined. The two
  values used were the mean ±1 standard deviation.
To determine the maximum and minimum errors that may be expected if the full ABC correction is not applied, the percentage differences between the NC, BFC and AFC and the true parenchyma concentration, between the values determined from the different blood concentrations and between fibrotic and normal appearing tissues were calculated.
3.4. Patient analysis
PET images were reconstructed using FBP with an average of the Cine-CT acquisition for attenuation correction. The average Cine-CT was used to minimise any CT-PET mismatch due to respiratory motion (Pan et al 2005). As the patients were allowed to move between the two study sections, the two average Cine-CT images were registered using a non-rigid technique with the NiftyReg software (Ourselin et al 2001, Modat et al 2010) and the transformation fields applied to the appropriate PET images. The PET images then underwent AFC with the correction factors derived from the average Cine-CT as described in section 2.1. The concentration of activity in blood at each time point was determined using a 3D ROI drawn manually on the aorta. The aorta was identified on fused PET and CT (using early PET frames). A previously defined model (Sari et al 2014) was then used to fit these data points to produce an input function (IF).
 was determined on a voxel basis using the first minute of the initial dynamic acquisition. High voxel TAC noise rendered full compartment modelling impractical with poor fit stability even after image smoothing.
  was therefore considered as the scaling factor between the TAC and the IF allowing a model fitting
  and time delay (between the TAC and IF) to be used. With image smoothing using a Gaussian filter with a 12 mm FWHM, this method resulted in fast processing with high stability. To calculate
  , the same method was adopted with AFC applied to the images prior to smoothing to ensure correct match between PET and CT.
For each patient, the average cine-CT was used to segment the lungs using a thresholding technique to create a whole lung mask (WLMask). The fractional parenchyma volume maps were reviewed and any voxels with a value of <5% were removed from the WLMask to ensure voxels containing mostly air (e.g. bullae) or mostly blood (i.e. blood vessels) were not analysed. Regions within this WLMask were then further segmented to separate regions of higher density (HDMask) representative of fibrosis and lower density (LDMask) representative of normal appearing tissue. For each patient, SUV and voxel based Patlak analysis were applied to the regions within each of the HD and LD masks. AFC and ABC were applied to the patients as described in section 2 and the masks were used to compare average regional results before and after corrections. In all cases, kinetic analysis was performed using in-house validated software.
4. Results
4.1. Simulations—kinetic analysis
Table 3 displays the results of ignoring the TFE for the worst and best case scenarios. The 'True' values represent the correct parameters after ABC (i.e. with no air or blood present). The results confirm that the only parameters affected by the TFE are K1 and Ki both in the case of 2-ICM and Patlak analysis. The TFE causes the affected kinetic parameters to be underestimated and this error reduces with BFC and AFC. It can also be seen that the determined  is not affected by the presence of air (table 2).
Table 3. Determined kinetic parameters with no corrections applied.
| K1 | K2 | K3 | Ki2 |  |
 |
|
|---|---|---|---|---|---|---|
| True | 0.17 | 0.51 | 0.0203 | 0.0065 | 0.0065 | |
| Best case | ||||||
| Fibrosis | 0.07 | 0.51 | 0.0203 | 0.0025 | 0.0025 | 0.18 |
| Normal | 0.03 | 0.51 | 0.0203 | 0.0013 | 0.0013 | 0.14 |
| Worst case | ||||||
| Fibrosis | 0.08 | 0.51 | 0.0203 | 0.0031 | 0.0031 | 0.15 |
| Normal | 0.01 | 0.51 | 0.0203 | 0.0003 | 0.0003 | 0.19 |
*See table 2 for the true  for each case.
Ki2 = influx rate determined from the 2-ICM.
for each case.
Ki2 = influx rate determined from the 2-ICM.
 = influx rate determined from Patlak analysis.
Note these two methods should (and do) produce the same result.
= influx rate determined from Patlak analysis.
Note these two methods should (and do) produce the same result.
Table 4 lists the percentage differences between the true and calculated Ki after each correction. The TFE causes the affected kinetic parameters to be underestimated by 96–52% without any corrections and this error reduces with both BFC and AFC.
Table 4. Percentage difference between the true and measured Ki before and after blood or air corrections.
| NC | BFC | AFC | |
|---|---|---|---|
| Best case | |||
| Fibrosis | −61% | −52% | −32% |
| Normal | −80% | −77% | −41% |
| Worst case | |||
| Fibrosis | −52% | −44% | −24% |
| Normal | −96% | −95% | −83% |


Table 5 is a comparison between the normal and fibrotic regions in each case. As the TACs were all determined from the same parameters, then the true Ki should be identical in all cases. As can be seen, not correcting for the presence of air and blood results in a significant error with Ki appearing between 49% and 92% different.
Table 5. Percentage difference between Ki in the two regions (normal/fibrotic) in each case before and after blood or air corrections.
| NC | BFC | AFC | |
|---|---|---|---|
| Best case | −49% | −51% | −14% |
| Worst case | −92% | −91% | −77% |
4.2. Simulations—SUV
The average whole lung parenchyma concentration in a static image, as determined from the simulated ABC TAC, was found to be 3.4 kBq ml−1. The mean blood concentration for the six patients was found to be  kBq ml−1 therefore the blood concentrations used to represent two patients were
  = 5.1 kBq ml−1 and
  kBq ml−1.
Table 6 lists the concentrations and their percentage differences (in brackets) from the true result in each case, with and without corrections. As can be seen, if the correction for blood fraction is applied without correcting for air, then the parameter estimate accuracy is decreased in comparison to no correction at all. As with the kinetic parameters, all concentrations are underestimated with an error range of 81% to 29% when no corrections have been applied. After AFC this error still ranges from −4% to 41%. AFC without BFC can also be seen to overestimate the concentration when  is greater than the concentration in the parenchyma. Complete correction is only obtained after ABC.
Table 6. Determined average parenchyma static concentrations before and after corrections for each region and case and their percentage difference to the true concentration, 3.4 kBq ml−1.
| NC | BFC | AFC | ||||
|---|---|---|---|---|---|---|
 |
 |
 |
 |
 |
 |
|
| Best Case | ||||||
| Fibrosis | 2248 | 1827 | 1328 | 1328 | 3944 | 3206 |
| (−34%) | (−46%) | (−61%) | (−61%) | (−16%) | (−6%) | |
| Normal | 1397 | 1070 | 681 | 681 | 4108 | 3146 |
| (−59%) | (−69%) | (−80%) | (−80%) | (−21%) | (−8%) | |
| Worst Case | ||||||
| Fibrosis | 2401 | 2050 | 1634 | 1634 | 3811 | 3255 |
| (−29%) | (−40%) | (−52%) | (−52%) | (12%) | (−4%) | |
| Normal | 1108 | 664 | 136 | 136 | 4816 | 2886 |
| (−67%) | (−81%) | (−96%) | (−96%) | (41%) | (−15%) | |
Note:  and
and  are the blood concentrations and are equal to 5.1 kBq ml−1 and 2.8 kBq ml−1 respectively.
The percentage difference between the two patient simulations was found to range between 17% and 67% without any corrections. As the only variation is the blood concentration, BFC alone causes the concentrations in both patients to be equal in each case (although underestimated by up to 96% due to the presence of air).
Table 7 is the percentage difference between the normal and fibrotic regions for a relative comparison. In the best case situation, after AFC, the concentrations are within 5% and therefore could be considered as approximately equivalent, however, this is not true for the worst case scenario where the difference is still as high as 26%.
Table 7. Percentage difference between measured concentrations in the two regions (normal/fibrotic) in each case before and after corrections.
| NC | BFC | AFC | ||||
|---|---|---|---|---|---|---|
 |
 |
 |
 |
 |
 |
|
| Best Case | −38% | −41% | −49% | −49% | 4% | −2% |
| Worst Case | −54% | −68% | −92% | −92% | 26% | −11% |
4.3. Patient analysis
Figure 1 displays the fibrotic (HD) and normal appearing (LD) Patlak derived influx rate constant ( ) for the NC, AFC and ABC cases for all six patients. It can be seen that in all patients the HD regions have a higher
  than that of the LD region in the NC case (p = 0.01). After AFC, the regions become comparable with a p value of 0.35 and after ABC, the LD regions are significantly increased with respect to the HD regions (p = 0.01). Figure 2 is the SUV equivalent to figure 1 where it can be seen that the trend is similar to the
  case with the HD regions appearing significantly higher than the LD regions in the NC case (p = 0.0001), approximately equivalent after AFC (p = 0.092) and significantly lower in the ABC case (p = 0.0001).
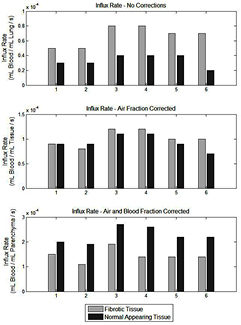
Figure 1. Bar graphs displaying the difference in Ki in fibrotic (light grey bars) and normal (dark grey bars) appearing regions determined from the mean of the HDMask and LDMask (with >5% fractional parenchyma volume threshold) over the Ki Patlak parametric images for all analysed patients. In the top chart, no corrections have been applied, the middle chart displays the values following AFC and the bottom chart is after ABC. Note that the influx rate appears higher in fibrotic regions when compared to the normal appearing regions without corrections but lower after correction.
Download figure:
Standard image High-resolution image
Figure 2. Bar graphs displaying the difference in SUV in fibrotic (light grey bars) and normal appearing regions (dark grey bars) determined from the mean of the HDMask and LDMask (with >5% fractional parenchyma volume threshold) over the final dynamic PET frame for all analysed patients. In the top chart, no corrections have been applied, the middle chart displays the values following AFC and the bottom chart is after ABC. Note that the SUV appears higher in fibrotic regions when compared to the normal appearing regions without corrections but lower after correction.
Download figure:
Standard image High-resolution imageFigure 3 displays an example parametric  image for each correction method. In the top left (a) the CT image can be seen displaying obvious regions of fibrosis (white arrows) and a region of normal appearing tissue (black arrow). In the top right (b) is the parametric image with no corrections displaying an apparent high influx rate in regions of fibrosis in comparison to those of normal appearance. In the bottom left (c) is the AFC image where the influx rate appears more uniform throughout the lung and after ABC (d) the regions of fibrosis appear to have a lower influx rate than those of normal appearance. Figure 4 displays the SUV results in the same layout as figure 3.
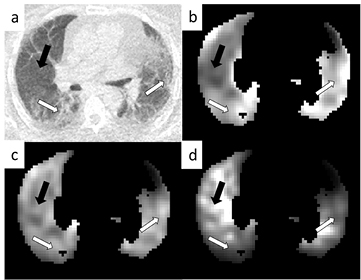
Figure 3. Patlak Ki parametric images from an example patient. Image (a) is the CT displaying regions of obvious fibrosis (white arrows) and a region of normal appearing tissue (black arrow). Image (b) is the uncorrected parametric image, image (c) is the same image after AFC and image (d) after ABC. All images have been normalised such that they can be shown on the same arbitrary grey scale. All images are shown after whole lung masking with >5% fractional parenchyma volume thresholding.
Download figure:
Standard image High-resolution image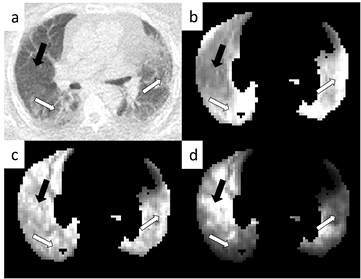
Figure 4. Example SUV images from a single patient. Image (a) is the CT as in figure 3(a). Image (b) is the uncorrected SUV image (grey scale 0–1.5 SUV), image (c) is the same image after AFC (grey scale 0–3.5 SUV) and image (d) after ABC (grey scale 0–12 SUV). All images are shown after whole lung masking with >5% fractional parenchyma volume thresholding.
Download figure:
Standard image High-resolution image
5. Discussion
Air and blood are significant components of the lung and have a considerable effect on the measured PET voxel tracer concentration. The result of not accounting for these components is a significant underestimation of the parenchyma signal. Moreover, the extent of this error is dependent on the highly variable voxel blood and air fractions throughout the lung.
Fractional air volume in static imaging has been previously discussed (Lambrou et al 2011) where it was shown, in agreement with the results found here, that SUV within the IPF lung appears more uniform after AFC. Lambrou et al were the first to note that the air component can lead to inaccurate parameter estimates and misinterpretation of results in SUV imaging and this is especially true when comparing between different lung density regions in a single patient, between patients and/or between patients and controls. Here this methodology has been expanded to include blood correction in both static and dynamic analysis.
Table 6 highlights the need for correcting for air fraction in static imaging where the error after AFC can be seen to reduce from 81% to 41% in the worst case and 29% to 4% in the best case. However, AFC may over or under correct the concentration depending on whether the  is greater or lower than
  respectively. This indicates that for static imaging, using AFC alone is not sufficient for comparison between patients.
Kinahan and Fletcher (2010) found SUV test-retest variability to be as high as ±20%, therefore here we consider this as the upper limit of acceptable error. When comparing different regions in a single patient with high  (table 6), it can be seen that after AFC, only in the fibrotic regions are the results below this limit. When considering relative change between the different density regions (table 7), only in the best case scenario can the HD and LD regions be considered comparable. AFC alone is therefore not enough for accurate image interpretation within a single patient and ABC is vital.
ABC is important as the blood volume as a fraction of tissue can be as high as 75% in normal appearing regions and 32% in the presence of fibrosis. This high blood volume is also the cause of the change in SUV error when two different blood concentrations are applied with no other alterations to the two static simulations (tables 6 and 7). As blood concentration would not be the only difference between patients, these results are best case limits.
 cannot be ascertained for static imaging using current clinical protocols and therefore ABC cannot be applied. However
  can be determined from a one minute dynamic acquisition immediately after injection. The addition of this short dynamic to the imaging protocol could reduce the error in the calculated concentration by 81%, significantly improving image interpretation (table 6).
The characterisation of systematic errors associated with not performing ABC was achieved with use of noise free TACs. In this work we have not compared this bias with the random errors due to noise in the data. An investigation into error propagation due to noise in the correction factors is left for future work.
Although AFC is only required for the lung, BFC can be applied throughout the body. BFC is not commonly utilised in areas such as the brain or oncology ether due to the necessity of dynamic imaging to obtain  or because
  is regularly considered negligible. However, BFC is vital in regions in which the blood volume is high, variable across the ROI, or where uptake within the blood is high with respect to that of the tissue of interest, all of which are true in the lung case.
In this paper we have used a voxel-wise method for correcting for the TFE. This method is limited by the accuracy of the PET/CT registration and resolution matching, a difficult problem in the lung. In addition, in voxels that contain low parenchyma fractions, such as in airways, bullae and blood vessels, the corrected values will be sensitive to noise and errors in the estimated  and
and  . We have addressed these problems by using averaged Cine-CT data to match the PET as closely as possible, and by excluding voxels with
  % from the analysis. Alternatively, a method using average correction factors for a ROI could be used. This is advantageous for regions with uniform PET tracer delivery and uptake kinetics. However, the time for the PET tracer to reach different parts of the lung is known to be variable. Moreover, it is possible that in the IPF lung, kinetic parameters may vary between different voxels. Therefore, a voxel-wise analysis was judged more appropriate. For the patient data, we have presented results using Patlak analysis as compartmental modelling was unstable at the voxel level due to noise.
Patient data were reconstructed using FBP techniques. This analytical method was used to avoid issues with quantification when using iterative reconstruction methods, e.g. due to variable convergence rates and bias in regions of low radiotracer concentration such as the lung.
The tissue fraction correction methodology described in this work was applied to patients with IPF. However, it is applicable to imaging of all pulmonary diseases and any organ in which air or large fractional blood volumes are present. ABC removes bias due to variations in the quantity and uptake of the air and blood components, ensuring that the measured PET signal originates from the parenchyma only. However, it is noted that parenchyma may be heterogeneous, especially when comparing between the normal appearing and fibrotic regions of the lung. Therefore, the use of further corrections may need to be investigated.
Application of the tissue fraction correction to the IPF patients displays an inversion of initial results. Without correction, it appears that the fibrotic regions have a higher uptake (SUV) and influx rate ( ) than that of the normal appearing regions in the IPF lung. After AFC, both regions appear equivalent in SUV and
  , but after ABC, it is the normal appearing regions that have increased parameter estimates and this is consistent between all patients. The interpretation of these results would therefore differ depending on which (if any) correction method was used.
The observation of increased tracer uptake in the normal appearing regions with respect to that of the fibrotic regions is a relative result. Further work is therefore required to determine how the different regions may compare to those of a control lung. Win et al (2014) compared normal regions in IPF patients to controls and found, after AFC only, that the normal IPF regions have an increased uptake with respect to the controls. However, here it has been shown that a 67% difference can be found in two patient groups with the same parenchyma concentration but with different blood concentrations. Therefore, the results of Win et al need confirmation by taking the blood component of the TFE into account.
6. Conclusion
Methods for correcting for the air and blood components in a lung voxel have been described for SUV and dynamic analysis. These methods are an extension of previously published work which used CT to account for differences in air fraction in static imaging. We have used a short dynamic scan to determine blood fraction and demonstrated that in the lung, the combination of air and blood fraction correction is essential for obtaining accurate parameter estimates in both dynamic and static imaging. Application of these corrections in patients with IPF has been shown to change the interpretation of results and to be vital for comparisons between different density regions in a single patient, between patients and/or between patients and controls.
Acknowledgments
We acknowledge funding support from GlaxoSmithKline (STU100028576) and the Engineering and Physical Sciences Research Council (EP/K0052781/1). Also, this project is supported by researchers at the National Institute for Health Research, University College London Hospitals Biomedical Research Centre.