
Abstract
The Trans-PET® BioCaliburn® LH is a commercial positron emission tomography (PET) system for animal imaging. The system offers a large transaxial field-of-view (FOV) of 13.0 cm to allow imaging of multiple rodents or larger animals. This paper evaluates and reports the performance characteristics of this system. Methods: in this paper, the system was evaluated for its spatial resolutions, sensitivity, scatter fraction, count rate performance and image quality in accordance with the National Electrical Manufacturers Association (NEMA) NU-4 2008 specification with modifications. Phantoms and animals not specified in the NEMA specification were also scanned to provide further demonstration of its imaging capability. Results: the spatial resolution is 1.0 mm at the center. When using a 350–650 keV energy window and a 5 ns coincidence time window, the sensitivity at the center is 2.04%. The noise equivalent count-rate curve reaches a peak value of 62 kcps at 28 MBq for the mouse-sized phantom and a peak value of 25 kcps at 31 MBq for the rat-sized phantom. The scatter fractions are 8.4% and 17.7% for the mouse- and rat-sized phantoms, respectively. The uniformity and recovery coefficients measured by using the NEMA image-quality phantom both indicate good imaging performance, even though the reconstruction algorithm provided by the vendor does not implement all desired corrections. The Derenzo-phantom images show that the system can resolve 1.0 mm diameter rods. Animal studies demonstrate the capabilities of the system in dynamic imaging and to image multiple rodents. Conclusion: the Trans-PET® BioCaliburn® LH system offers high spatial resolution, a large transaixal FOV and adequate sensitivity. It produces animal images of good quality and supports dynamic imaging. The system is an attractive imaging technology for preclinical research.
Export citation and abstract BibTeX RIS

Content from this work may be used under the terms of the Creative Commons Attribution 3.0 licence. Any further distribution of this work must maintain attribution to the author(s) and the title of the work, journal citation and DOI.
1. Introduction
Small-animal positron emission tomography (PET) imaging has been recognized as a powerful method for disease research, treatment evaluation and drug development (Glunde et al 2007, Chatziioannou 2002). To date, many research and commercial small-animal systems that have considerably different designs and imaging performance properties have been developed. They include the microPET (Tai et al 2003), the eXplore VISTA (GE Healthcare) (Wang et al 2006), the MOSAIC (Philips Medical System, Inc.) (Huisman et al 2007), the Inveon preclinical PET (Siemens Medical Solutions, Inc.) (Kemp et al 2009), the LabPET (Gamma Medica-Ideas Inc.) (Bergeron et al 2009), the ClearPET (Raytest CmbH) (Cañadas et al 2011), the NanoPET/CT (Bioscan Inc., manufactured by Mediso Ltd.) (Szanda et al 2011), to name but a few.
The Trans-PET® BioCaliburn® systems are commercial small-animal PET systems, recently introduced by the Raycan Technology Co., Ltd (Suzhou, China). These systems employ the basic detector modules (BDMs) developed by the Huazhong University of Science and Technology (HUST) (Xie et al 2013). The BDMs are based on the MVT (multi-voltage threshold) digital data-acquisition (DAQ) technique, pioneered by HUST and the University of Chicago, to generate a small but sufficient number of digital samples of the short scintillation pulses (Xie et al 2005, Xie et al 2009, Kim et al 2009). By processing these pulse samples, event information needed for PET imaging is derived. Readers who are interested in the design of the BDM and the theory and implementation of the MVT are referred to Xie et al (2005, 2009, 2013) and Kim et al (2009). Various PET scanners can be built with various structures from any number of BDMs with different performance, resulting in significant flexibility, scalability and upgradability. Following this idea, the Trans-PET® BioCaliburn® systems have three models: LH, SH and SH2. Among them, the LH employs twelve (12) BDMs and offers the largest transaxial field-of-view (TFOV) of 13.0 cm that can accommodate multiple rodents at the same time. For users who are only interested in rodent imaging, the SH offers a smaller TFOV of 6.5 cm by employing six (6) BDMs. Because of its smaller diameter, the SH has a slightly higher sensitivity than the LH. The axial field-of-view (AFOV) of the LH and SH is 5.3 cm. In contrast, the SH2 also employs twelve (12) BDMs (same as the LH) to offer a 6.5 cm diameter TFOV (same as the SH) and a 10.6 cm AFOV, which is twice that of the LH and SH models. Therefore, the SH2 has the highest sensitivity among the three models and requires fewer bed positions to image a long subject.
In this paper, we describe the Trans-PET® BioCaliburn® LH system and report its imaging performance properties measured by following the National Electrical Manufacturers Association (NEMA) NU-4 standard (NEMA 2008) with some modifications.
2. Method
2.1. PET System
Table 1 lists key design parameters of the Trans-PET® BioCaliburn® LH system. It contains 12 BDMs that are arranged on a 19.2 cm diameter ring (figure 1). Each BDM contains a 2 × 2 array of lutetium yttrium oxyorthosilicate (LYSO)/position-sensitive photomultiplier tube (PSPMT) blocks and each of the LYSO/PSPMT blocks is made of a 13 × 13 array of LYSO crystals coupled to a Hamamatsu R8900-00-C12 PSPMT via a tapered light guide. An individual LYSO crystal is 1.89 × 1.89 mm2 in cross section and 13 mm in length. Individual crystals are polished and covered by BaSO4 reflectors. The tapered light guide is constructed from common glass and comprises 13 × 13 elements, each of which is polished, wrapped in BaSO4 reflectors and individually coupled to one LYSO crystal element. For each PSPMT, the readout circuit generates X+, X−, Y+, Y− signals plus a fast signal derived from the last dynode. The last dynode signal is sampled by the MVT DAQ with four amplitude thresholds and the resulting samples are processed to yield the event timing by using the method described in Xie et al (2013). The X+, X−, Y+, Y− amplitude signals are shaped and then digitized by using a free-running Analog-to-Digital Converter (ADC) for the energy and position information. The resulting event data, containing time, energy and position, are formed into 128-bit single events information frames (SEIFs) and sent to a personal computer (PC) via a 1000 Mbps Ethernet interface and a Gigabit router. The SEIFs generated by the system are stored in the PC. The measured energy resolution and timing resolution of the system is 13% and 1.5 ns (Xie et al 2013). The energy window and coincidence time window are then applied to this singles list-mode data post-acquisition, to generate the coincidence list-mode data.

Figure 1. The Trans-PET® BioCaliburn® LH system (a) consists of 12 BDMs (b).
Download figure:
Standard image High-resolution imageTable 1. Trans-PET ® BioCaliburn ® LH specifications.
| Category | Characteristics | |
|---|---|---|
| Crystal | Crystal material | LYSO |
| Block | Crystal size (mm3) | 1.89 × 1.89 × 13.00 |
| Crystal pitch (mm2) | 2.03 × 2.03 | |
| Crystal array | 13 × 13 | |
| BDM | LYSO/PSPMT block | 2 × 2 |
| LYSO Dimension (mm3) | 53.0 × 53.0 × 13.0 | |
| Scanner | Number of BDMs | 12 |
| Number of crystal elements | 8112 | |
| Bore diameter (cm) | 19.2 | |
| TFOV (cm) | 13.0 | |
| AFOV (cm) | 5.3 |
For image reconstruction, the vendor currently only provides a 3D ordered-subset expectation maximization (OSEM) algorithm, which incorporates the Monte-Carlo simulation generated system response matrix (SRM) of the system (Kao et al 2009, Liu et al 2014), with no corrections for attenuation, scatter and random. This algorithm produces images consisting of 0.5 × 0.5 × 0.5 mm3 voxels. The number of subsets and iterations can be specified by the user. Unless mentioned otherwise, images in this paper are obtained by using 24 subsets and 2 iterations with no smoothing. In the system, the component-based normalization method combined with the Maximum-Likelihood estimation method proposed by Hogg et al (2001) is employed to obtain the normalization factors, by using an 18F-FDG planar source with a size of 120 × 90 mm2 and collecting data at three rotational positions of the source with an angular interval of 60 degrees, the first of which is on the x-z plane of the scanner. The acquisition time at each rotational position is 30 min.
2.2. Spatial resolution
The NEMA standard calls for the use of point sources for spatial resolution measurements. We do not have the required point sources and therefore modified the measurement procedure to use line sources instead. These line sources were made by filling 0.5 mm-diameter capillary tubes with ∼1850 kBq (50 μCi) 18F-FDG solution and the activity-filled length was about 7.0 cm. For measuring the radial and tangential resolutions, we aligned the length of the source with the scanner's axis and placed it at the center of the scanner's TFOV. We moved the position of the line source radially in 5 mm step to 65 mm away from the center. For measuring the axial resolution, we oriented the length of two line sources perpendicular to the scanner's axis and placed them at the center and one fourth of the AFOV. The acquisition time at each source position was 5 min. A 350–650 keV energy window and a 5 ns coincidence time window were employed for energy qualification and coincidence filtering. Images were reconstructed into a 280 × 280 × 104 matrix using 3D OSEM, with a pixel size of 0.5 × 0.5 mm2 and a slice thickness of 0.5 mm. Per the NEMA specification, we calculated the full width at half maximum (FWHM) value of the intensity profile through the center of the line source on the reconstructed image. The resulting FWHMs were reported without correcting for the source dimension, positron range, or annihilation noncolinearity.
2.3. Sensitivity
The sensitivity of the system was measured by using a point-like 18F-FDG source rather than a 22 Na point source as specified in the NEMA standard. The diameter of the source was less than 2 mm and its activity was about 1,998 kBq (54 μCi). The source was positioned at the center of the field-of-view (FOV) and scanned for 30 min. Since the Trans-PET® BioCaliburn® LH stores singles data, we could apply various energy and coincidence time windows without repeating the acquisition. We considered five energy-window settings, including 450–550 keV, 400–550 keV, 350–650 keV, 300–700 keV and 250–750 keV. However, we considered only the use of a 5 ns coincidence time window. To correct for possible nonzero background events, the background was measured by acquiring data in the absence of source for 30 min. The sensitivity was calculated by (1),

where CA(Cbkg) is the total number of events measured with the source present (not present) and Ccal is the accumulated activity of the source during the scan time. The decay of 18 F was considered when the total number was calculated. The factor 0.967 is the branching ratio of the β + decay of 18 F.
The axial sensitivity profile was also assessed by using the point-like 18F-FDG source, by translating it along the axis of the scanner at 5 mm step. An energy window of 350–650 keV was used. The coincidence time window was again 5 ns.
2.4. Scatter fraction and count-rate measurement
The scatter fraction and count-rate performance were measured by using two differently-sized home-made cylindrical polyethylene phantoms to simulate the geometries of a mouse and a rat (the density of the polyethylene is 0.96 g ml−1). The designs of these cylinders and the density of the material, conform to the NEMA NU-4 specifications. An 18F-FDG line source with the same length as each phantom was threaded through the holes in the phantoms. Each phantom was placed at the center of the FOV and the initial activity in the phantom was higher than 55.5 MBq (1.5 mCi) at the start of acquisition. Single events were collected for each phantom until the count rate was less than two times the background rate. Background events due to the natural radioactivity of the LYSO crystals were also measured for the same duration with the mouse- or rat-sized phantoms placed at the center of the FOV, with no activity in the line source. Then, two energy windows, including 350–650 keV and 250–750 keV and a 5 ns coincidence time window were applied to obtain coincidence list-mode data from the stored singles list-mode data. The coincidence list-mode data were sorted into sinograms and then the oblique sinograms were rebinned into direct sinograms by using the single-slice rebinning (SSRB) algorithm. Again, no correction for randoms or scatters were applied. After rebinning, all pixels in each sinogram located farther than 8 mm from the edge of the phantom were set to zero. For each sinogram, its projections were shifted so that the pixel containing the maximum value was aligned with the central pixel. After alignment, a sum projection was produced by adding all the angular projections of the sinogram. From the sum projection, the linear interpolation was employed to find the pixel intensities at ± 7 mm from the central pixel of the projection and then a straight line connecting these two points was drawn. Counts below this line were assumed to be the sum of the randoms, scatters and background events. Counts above this line were regarded as the true events.
The scatter fraction was determined from the final acquisition of the scan when the activity in the phantom was below the background and hence random events were negligible. Then the random and scatter event counts at each acquisition could be estimated by using the derived scatter fraction after subtracting the background counts. The noise-equivalent count rates (NECRs) were calculated according to the formula given in the NEMA NU-4 standard.
2.5. NEMA image-quality phantom study
The home-made NEMA NU-4 mouse image-quality phantom is composed of 3 main parts (NEMA 2008). The first part, which is the middle section of the phantom, is a uniform region chamber (diameter, 30 mm; length, 15 mm) for measuring the signal-to-noise ratio of the system. The second part, which is the bottom section of the phantom, attaches to the main fillable region and contains two smaller cold-region chambers (outer diameter, 10 mm; length, 15 mm; wall thickness, 1 mm). One of these chambers was filled with nonradioactive water and the other with air. The third part, which is the top section of the phantom, is a solid polymethylmethacrylate region (diameter, 30 mm; length, 20 mm) containing five drilled-through rods. These rods are located at 7 mm from the center and have diameters of 1, 2, 3, 4 and 5 mm. The image-quality phantom was filled with 5402 kBq (146 μCi) 18F-FDG, placed at the center of the FOV with its long axis along the axial direction of the system and scanned by using a 350–650 keV energy window and 5 ns coincidence time window for 15 min.
The uniformity of the reconstructed image was assessed by drawing a 22.5 mm-diameter by 10 mm-length cylindrical volume of interest (VOI) inside the part one of the phantom, with its long axis aligned with the axis of the phantom. The average concentration, maximum and minimum values in this VOI and percentage standard deviation (SD) were calculated to estimate the noise performance as a measure of uniformity.
The recovery coefficients (RCs) were calculated as follows, in accordance with the NEMA standard. The 10 mm central portion of the length of the rods in the third part of the phantom was averaged to reduce noise. Circular regions of interests (ROIs) were drawn in this image around individual rod, with the diameters of the ROIs twice the physical diameters of the rods. The pixel coordinates of the locations having the maximum ROI values in each of these ROIs were used to create line profiles along the rods in the axial direction. The pixel values in this profile and the uniform region were then used to calculate the mean and standard deviation of the RC value for each rod.
Predefined VOIs were drawn in the water- and air-filled cold-region chambers in the second part of the phantom as specified by the NEMA standard for obtaining the mean activity concentration in these cold regions. The ratio of the resulting mean activity concentration of a cold region to that of the hot homogenous volume (obtained above in calculating the uniformity) gives the spill-over ratio (SOR).
2.6. Image studies
- (a)Derenzo phantom imaging: The home-made Derenzo like phantom made of acryli was imaged for demonstrating the system's resolving capability. This phantom has a diameter of 3.5 cm and a thickness of 0.8 cm and it contains six groups of hollow channels with diameters of 0.7, 1.0, 1.2, 1.6, 2.0 and 2.4 mm (figure 6(a)). The center-to-center spacing between adjacent channels in the same group is twice the channel diameter. The phantom was filled with 6,068 kBq (164 μCi) 18F-FDG and placed at the center of the scanner with its base sitting on the central coronal plane. To inspect the resolution uniformity, the phantom was placed at three radial positions, including 0.0 cm, 2.5 cm and 4.5 cm. And at each position it was scanned for 15 min by using an energy window of 350–650 keV and a coincidence time window of 5 ns.
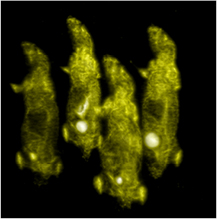
- (b)Animal study: All animal experiments were approved by the Animal Research Committee of the Tongji Medical College of HUST and were performed according to the guidelines of the Division of Laboratory Animal Medicine at the Tongji Medical College. Two experiments were performed. In the first experiment, we placed a 35 g mouse at the center of the FOV, positioned the long axis of the mouse along the transverse direction of the system, starting immediately after a bolus injection of 17 020 kBq (460 μCi) 18F-FDG via the tail vein. Again, an energy window of 350–650 keV and a coincidence time window of 5 ns were used. No respiratory or cardiac gating was employed. The 40 min coincidence list-mode data was divided into a sequence of static frames, including four 30 s frames, followed by three 60 s frames and then followed by five 120 s frames and five 300 s frames. The large FOV of the system allows imaging of multiple rodents to increase the throughput. To examine this capability, in the second experiment we placed four mice (∼ 25 g for each mouse) in the scanner which occupied almost the entire FOV. The scan was started at 70 min after a bolus injection of ∼10 360 kBq (280μCi) 18F-FDG for each mouse. Two bed positions were used and the subjects were scanned for 10 min at each position.
3. Results
3.1. Spatial resolution
The FWHMs obtained for the radial, tangential and axial directions are summarized in figure 2. In terms of the FWHM, the radial, tangential and axial resolutions at the center of the AFOV are 0.95 mm, 1.05 mm and 1.01 mm, respectively. The radial (tangential) resolution degrades with the radial distance and becomes 0.96 mm (1.13 mm) at 15 mm away from the center, 1.30 mm (1.28 mm) at 30 mm and 1.75 mm (1.69 mm) at 65 mm. The axial resolution, on the other hand, shows no significant change with the radial distance and becomes 0.99 mm at 15 mm away from the center, 1.00 mm at 30 mm and 1.13 mm at 65 mm. At 1/4 AFOV, the resolution properties are essentially identical to those observed at the center of the AFOV. It is noted that the Trans-PET® BioCaliburn® LH system has a 2.03 mm crystal pitch and traditionally one would expect an image resolution substantially worse than the ∼1.01 mm intrinsic spatial resolution predicted by the empirical rule based on the pitch (Moses and Derenzo 1993). Our results however show resolutions comparable with the predicted. This is because the 3D OSEM reconstruction algorithm provided by the vendor incorporates the SRM. The capability to greatly enhance the spatial resolution by modeling the SRM has been demonstrated and reported in the literature, for example Kao et al (2009), Liu et al (2014), Alessio et al (2010), Panin et al (2006a) and Panin et al (2006b). The degradation of the spatial resolution with the radial distance, which is commonly observed for PET systems due to the depth-of-interaction blurring, is also corrected for by the algorithm. The Trans-PET® BioCaliburn® LH exhibits good resolution uniformity over the imaging FOV.
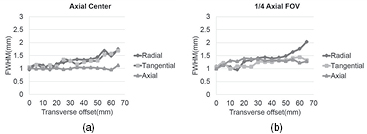
Figure 2. Spatial resolution at the center of the AFOV (a) and at 1/4 AFOV from the center (b)
Download figure:
Standard image High-resolution image3.2. Sensitivity
The absolute sensitivity measured at the center of the scanner is 1.04%, 1.27%, 2.04%, 2.37% and 2.43% when using 450–550 keV, 400–550 keV, 350–650 keV, 300–700 keV and 250–750 keV energy windows. The measured axial sensitivity profile of the system, shown in figure 3, has the expected triangular shape with the peak at the center of the system.
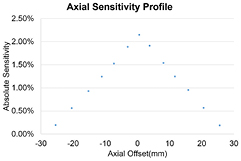
Figure 3. The sensitivity profile as a function of axial position. The energy window was 350–650 keV.
Download figure:
Standard image High-resolution image3.3. Scatter fraction and count-rate measurement
Figure 4 shows the count-rate curves as a function of the total activity in the phantom, obtained by using a 250–750 keV or 350–650 keV energy window and a 5 ns coincidence time window. When the 250–750 keV energy window is used, the peak values and locations of the NECRs are 110 kcps at 38 MBq and 40 kcps at 34 MBq for the mouse- and rat-sized phantoms, respectively. Also, the scatter fractions are 11.3% and 19.3% . When using the 350–650 keV energy window, the peak values and locations of the NECRs are 62 kcps at 28 MBq and 25 kcps at 31 MBq and the scatter fractions are 8.4% and 17.7%, for the mouse- and rat-sized phantoms, respectively.

Figure 4. Count-rate curves for mouse- and rat- sized phantoms.
Download figure:
Standard image High-resolution image3.4. NEMA image-quality phantom study
Figure 5 shows the average of transverse slices of the images obtained for the home-made NEMA image-quality phantom through its three parts. The darker appearance of the images toward the center can be attributed to the attenuation effect, which is not corrected for by the current reconstruction method. The uniformity derived from the image is 9.94% . The RC curve is shown in figure 5(d). As expected, the RC decreases with the diameters of the rods, dropping from ∼0.89 for the 5 mm-diameter rod, to ∼0.76 for the 3 mm-diameter rod, to ∼0.16 for the 1 mm-diameter rod. The RC value shows a sharp decrease for rod diameter below 2 mm. The RC does not approach 1.0 even for the largest of the rods, because the system does not implement all desired corrections including attenuaion correction. The SORs of the water-filled cylinder and air-filled cylinder are 0.092 and 0.177, respectively.
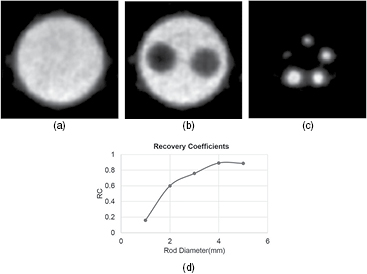
Figure 5. The average of transverse slices of the reconstruction images of the NEMA image-quality phantom through the uniform region (a), the two-chamber region (b) and the 5-rod region (c). The image of the uniform section shown in (a) appears darker toward the center due to the attenuation effect. In (b), although the scatter correction is not applied, the cold air and water regions are distinguishable. In (c), all five rods are visible. The RC curve is shown in (d).
Download figure:
Standard image High-resolution image3.5. Derenzo phantom imaging
Figure 6 shows a photo of the home-made Derenzo like phantom and its reconstruction images from data taken at three radial positions, the base of which is on the central coronal plane. The numbers shown in figure 6(a) are the diameters of the rods in each group. As shown, when the phantom is placed at the center of the scanner the 1.0 mm diameter rods can be clearly resolved, which is consistent with the measured 1.0 mm axial resolutions in FWHM at the center of the scanner. In comparison, at 2.5 cm radially away from the center, the resolution of the image is slightly degraded. At 4.5 cm radially away from the center, the resolution of the image degrades further and not every 1.2 mm diameter rods are clearly resolved. Again, these observations are consistent with the resolutions measured at these radial positions.

Figure 6. The home-made Derenzo like phantom (a) and the reconstructed images from data acquired by placing the phantom at three radial positions, the base of which is on the central coronal plane, including 0.0 cm (b), 2.5 cm (c) and 4.5 cm (d).
Download figure:
Standard image High-resolution image3.6. Animal study
Figure 7(a) shows the 40 min dynamic image sequence, rendered by using the maximum intensity projection (MIP), obtained without respiratory and cardiac gating for the 35 g mouse injected with 18F-FDG. Subjectively, the mouse images have adequate resolution and statistics for resolving major organs. To demonstrate the resolution property further, figures 7(b)–(d) shows the reconstructed image of the 16th frame of the sequence in three orthogonal views. While no gating is applied, the heart ventricle is resolved.

Figure 7. A dynamic image sequence of the 35 g mouse after 17 020 kBq 18F-FDG injection acquired by the Trans-PET® BioCaliburn® LH system, using MIP rending (a). The sequence corresponds to 40 min imaging and the images are arranged in temporal order, increasing from left to right and top to bottom. Major organs of the mouse are well resolved in the image sequence. The transaxial (b), sagittal (c) and coronal (d) views of the 16th frame of the dynamic image are shown. The heart ventricle is resolved.
Download figure:
Standard image High-resolution imageFigure 8 shows the reconstruction image of the data acquired for 10 min for four mice in the scanner. These mice occupy approximately 10 cm diameter of the scanner's TFOV. Subjectively, no image artifacts or deterioration of image quality across the mice are observed.
Figure 8. Reconstruction image from 10 min data acquired for four mice placed in the scanner, after ∼10 360 kBq 18F-FDG injection for each mouse.
Download figure:
Standard image High-resolution image
4. Conclusion
To date, many research and commercial small-animal PET systems have been developed, which have shown considerably different designs and imaging performance properties. The Trans-PET® BioCaliburn® systems are different from most small-animal systems reported in the literature in several aspects. First, they are the first commercial small-animal PET systems that employ the MVT DAQ technique. Having digital samples, it is possible to introduce novel digital algorithms to enhance detection without requiring hardware modifications. For example, it is possible to reduce pile-up and enhance the count-rate performance (Wang et al 2012, Deng et al 2013). Second, instead of the coincidence list-mode data the systems store the singles list-mode data and perform the coincidence filtering post acquisition. With this approach, one can change the coincidence time window post acquisition and novel coincidence filtering methods may be considered. The disadvantage of this approach is the need for large bandwidth for data transmission and more storage, which will limit the NECR performance property. Third, Trans-PET® BioCaliburn® LH system has a TFOV of 13.0 cm that is sufficiently large to accommodate multiple rodents and potentially even a larger animal. In comparison, most currently available commercial pre-clinical PET systems have a TFOV of about 5–13 cm (Wang et al 2006, Huisman et al 2007, Kemp et al 2009, Bergeron et al 2009, Ca nadas et al 2011, Szanda et al 2011).
In this paper, we evaluate the performance properties of the Trans-PET® BioCaliburn® LH system. The spatial resolution of the system is 1.0 mm at the center, which approaches the ∼1.01 mm intrinsic spatial resolution predicted by the empirical rule based on the pitch, making it possible to resolve small structures, and remains below 2.0 mm over the central 6.5 cm region. The superior resolution of the system with respect to the crystal size used is due to the incorporation of the system's SRM by the 3D OSEM reconstruction algorithm provided by the vendor. The absolute sensitivity of the system at the center is 2.04% when using an energy window of 350–650 keV and a time window of 5 ns. It increases to 2.43% when using a wider 250–750 keV energy window. It is observed that the use of the 5 ns coincidence time window and 350–650 keV energy window can yield a good NECR for the typical range of radioactivity used in FDG-PET imaging of mice, yielding a peak NECR value of 62 kcps at 28 MBq total radioactivity. On the other hand, the NECR curve yielding a peak value of 25 kcps at 31 MBq total radioactivity, is appropriate for the typical range of radioactivity used in FDG-PET imaging of rats. As is the case with block detector designs, at high count rates, the BDM and the system, can be subject to more pile-ups and in-block scatter and result in degraded performance. However, based on NECR measurements obtained for the mouse- and rat-sized phantoms, we observe that the count-rate performance of the system is adequate for preclinical imaging that employs no more than ∼30 MBq (∼ 810 μCi) of activity. As demonstrated in our previous work (Wang et al 2012, Deng et al 2013), the count-rate performance of the BDM can be improved by applying novel digital algorithms to analyze pile-up events. We will consider inclusion of such algorithms in the future work.
In comparison with most currently available commercial pre-clinical PET systems, it can be seen that the system has an average sensitivity and the peak NECR rate is lower than that of, for example, the Inveon (Kemp et al 2009). However, for all imaging studies we have undertaken so far, the sensitivity and count-rate performance of the system have been adequate. The image-quality phantom studies demonstrate good performance of uniformity and recovery coefficients, even though the current reconstruction algorithm does not implement all corrections. Also, because of the large transaxial FOV and good resolution, the system can image multiple rodents at the same time to improve its utilization efficiency, or can scan the body of a mouse in 1 bed position when the long axis of which is positioned along the transverse direction in its FOV, or have the potential, which we will evaluate in future work, to image larger animals such as rabbits and monkeys. Overall, the Trans-PET® BioCaliburn® LH is a versatile imaging device, which can provide high spatial resolution and resolution uniformity over a large FOV while remaining adequate in terms of sensitivity and count rate performance. Both the AFOV and the overall system sensitivity can be improved by extending the design to multiple rings of BDMs. Also, the system is observed to behave in a reliable, stable and easy-to-maintain fashion throughout more than 300 studies that we have conducted so far. In our future work, we will evaluate the quantitative accuracy of the system for in vivo imaging studies and compare its performance properties to other commercial preclinical systems.
Acknowledgments
The authors would like to thank Shuguo Gu, Jingjing Liu, Daoming Xi, Lu Wan for their assistance and valuable discussions, the Raycan Technology Co., Ltd (Suzhou, China) for providing the Trans-PET® BioCaliburn® LH system and valuable technical assistance and the PET Center of the Union Hospital, the Tongji Medical College of HUST, for their generous supply of radioisotopes and support of other resources. This work was supported in part by the National Major Scientific Instruments and Equipments Development Project #2013YQ030923, in part by the Major International (Regional) Joint Research Project of the Natural Science Foundation of China (NSFC) #61210003, in part by the Program for the International Science and Technology Cooperation Program of China #2014DFR10670 and #2012DFG31970, in part by the Foundation for Key Program of Ministry of Education of China #313023, in part by the National Key Technology Research and Development Program of China #2012BAI13B06, in part by the United Fund of NSFC and the People's Government of Guangdong Province #U1201256 and in part by the Science and Technology Plan Project of Wuhan, China #201231234461.