

Abstract
Emissions of gases and particles from the combustion of fossil fuels and biofuels in Africa are expected to increase significantly in the near future due to the rapid growth of African cities and megacities. There is currently no regional emissions inventory that provides estimates of anthropogenic combustion for the African continent. This work provides a quantification of the evolution of African combustion emissions from 2005 to 2030, using a bottom-up method. This inventory predicts very large increases in black carbon, organic carbon, CO, NOx, SO2 and non-methane hydrocarbon emissions if no emission regulations are implemented. This paper discusses the effectiveness of scenarios involving certain fuels, specific to Africa in each activity sector and each region (western, eastern, northern and southern Africa), to reduce the emissions. The estimated trends in African emissions are consistent with emissions provided by global inventories, but they display a larger range of values.
African combustion emissions contributed significantly to global emissions in 2005. This contribution will increase more significantly by 2030: organic carbon emissions will for example make up 50% of the global emissions in 2030. Furthermore, we show that the magnitude of African anthropogenic emissions could be similar to African biomass burning emissions around 2030.
Export citation and abstract BibTeX RIS

Content from this work may be used under the terms of the Creative Commons Attribution 3.0 licence. Any further distribution of this work must maintain attribution to the author(s) and the title of the work, journal citation and DOI.
Corrections were made to this article on 21 March 2014. The second affiliation was corrected.
Introduction
Previous studies have demonstrated the importance of emissions from biomass burning on the atmospheric composition in Africa (Goldammer 1990, Lacaux et al 1995, Liousse et al 1996, Delmas et al 1999, Thompson et al 2001, Swap et al 2003, Haywood et al 2008, Liousse et al 2010). Recent studies provide growing evidence that emissions from anthropogenic combustion are having an increasing impact on the distribution of several chemical compounds. Nevertheless, emission regulations are still weak (Liousse and Galy-Lacaux 2010, Doumbia et al 2012). Observations performed during the AMMA (African Monsoon Multidisciplinary Analyses) campaign (Mari et al 2010, Marticorena et al 2010, Liousse et al 2010, Malavelle et al 2011) have shown that anthropogenic combustion emissions, mainly linked to traffic and the use of biofuels in western Africa, have a significant impact on urban air quality. Emissions from two-wheeled vehicles running on mixtures of smuggled gasoline from Nigeria and motor oil are also a large source of pollutants in cities of sub-Saharan Africa such as Bamako (Mali) or Cotonou (Benin). Surprisingly high particulate emissions factors for such two-wheeled vehicles were measured during AMMA (Guinot et al 2014) and resulted in the development of a specific emission inventory for traffic emissions Assamoi and Liousse (2010). Elevated levels of atmospheric pollutants were also observed during the POLCA program (Liousse and Galy-Lacaux 2010) in Dakar (Senegal) and Bamako: the unexpectedly high aerosol and gas concentrations due to traffic and biofuel emissions in these cities have a demonstrated impact on human health through inflammatory diseases (Doumbia et al 2012, Val et al 2013).
Only global inventories have been published so far, and these have been used for air quality and climate change modeling in Africa (Bond et al 2004, Streets et al 2004, Junker and Liousse 2008, Klimont et al 2009, Lamarque et al 2010, Granier et al 2011, Smith et al 2011, Klimont et al 2013). These works used detailed emissions available at the regional scale for North America, Europe and Asia, but not for Africa, for which there is a general lack of detailed anthropogenic inventories at the continental and regional scales.
Previous works have also shown that aerosol optical depths simulated with models using these inventories did not agree with satellite observations (Liousse et al 2010, Malavelle et al 2011). Moreover, discrepancies have been found between global and regional databases providing fuel consumption data, for example on for diesel fuel consumption for different countries/categories, where significant differences exist between the UNSTAT database United Nation Energy Statistics database (2004) and the Africaclean database (Zhu et al 2013).
African emissions are predicted to increase considerably ion the future. Future projections indicate an increase in the population density of developing countries, which will be much higher in Africa than in other parts of the world. The population of Africa could represent 40% of the world's population in 2100 (UN 2007). In addition, there is an explosive increase in the urban population in Africa, which could double from 2000 to 2030 (CIESIN 2005, 2012) A rapid development of mining, oil and industrial activities is also expected across the whole continent. New megacities are expected along the Gulf of Guinea with associated increases in traffic, energy and domestic emissions (Zhu et al 2013).
This paper discusses the first development of an inventory of African combustion emissions, which focuses on the emissions of particles, i.e. black carbon (BC) and organic carbon (OC), and gaseous compounds, namely carbon monoxide (CO), nitrogen oxides (NOx), sulfur dioxide (SO2) and non-methane hydrocarbons (NMHC). The inventory provides emissions for 2005, and three scenarios are considered for the 2005–2030 period. The inventory considers emissions that are specific to Africa, such as charcoal making and emissions from two-wheeled vehicles as described in Assamoi and Liousse (2010). The methodology used to develop the inventory is discussed in section 1 including choices of fuel consumption database and emission factors (EFs). Section 2 discusses the major results of this work.
1. Methodology
Fossil fuel and biofuel emissions of the different species were calculated for Africa using a bottom-up approach, based on the method discussed in Junker and Liousse (2008), by combining fuel consumption (in kg of fuel) and emission factors (in g of species/kg of fuel). Consumptions for 25 fuel categories were derived from many databases. Twelve EFs have been chosen for each type of fuel, depending on fuel use (traffic (T)/domestic (D)/industrial (I)/power plant (PPLT)) and on three technological categories (1, basic; 2, intermediate; 3, advanced). These technological categories refer to the level of country development. Category 1 corresponds to developing countries, category 2 to semi-developed countries and category 3 to industrialized countries. The group of developed countries is composed of the members of the Organisation for Economic Co-operation and Development (OECD) in 1984. The African countries are mainly listed as semi-developed and developing countries. The distinction between such countries is based on the gross national product per capita. Finally, emissions obtained for each country were spatially distributed using population density data given by CIESIN (2005) for the year 2005 with a spatial resolution of 0.25° by 0.25°.
1.1. Fuel consumption data
1.1.1. Consumption data in 2005
Data on the consumption of fossil fuels by traffic, domestic and industrial activities were obtained from questionnaires which were sent to local authorities in each African country. About 50% of the countries responded (questionnaires were sent to 26 countries and 11 were returned). When no data were received, we used fuel consumption data from the UNSTAT database United Nation Energy Statistics database (2004). These figures are based on fuel production, import and export data provided to UNSTAT by national statistical offices. The Assamoi and Liousse (2010) inventory was used to represent the emissions from two-wheeled vehicles with mixtures of smuggled gasoline from Nigeria and motor oil. Data on fossil fuel and biofuel consumption by power plants were obtained from the International Energy Agency database (IEA 2005, www.iea.org/stats/). In west Africa, data on the consumption of fuelwood and charcoal for domestic purposes were calculated following Brocard (1996) and Liousse et al (1996), using an average value of the biofuel consumption per inhabitant for the 2005 population data whereas the UNSTAT database was used for the other African regions. The UNSTAT database was also used for consumption of biofuel in the traffic and industrial sectors. Note that charcoal-making emissions were calculated following Liousse et al (1996).
1.1.2. Consumption data in 2030
Data on the consumption of fossil fuels and biofuels in 2030, especially ratios between 2030 and 2002 fuel consumption data, were obtained from the POLES (prospective outlook on long-term energy systems) model (Criqui 2001). The POLES model is a world simulation model for the energy sector. It works on a year-by-year recursive simulation basis with a partial equilibrium framework, together with endogenous international energy prices and lagged adjustments for supply and demand by world region. This model produces:
- detailed long-term (2030) world energy outlooks for demand, supply and price projections by region;
- CO2 emission marginal abatement cost curves by region and emission trading systems analyses, under different market configurations and trading rules;
- technology improvement scenarios and analyses of the impact of technological progress in the context of CO2 abatement policies.
The POLES model provides actual and forecast fuel consumption by sector for the years 2002 and 2030 for 24 countries and 14 regions. In Africa, three regions are considered: North African fuel producers, North African non-fuel producers and sub-Saharan African regions. POLES differentiates between 21 different fuel types for two main future scenarios, the 'reference' scenario (REF), and the 'carbon constraint case' scenario (CCC).
Reference scenario. The REF scenario is assumed to reflect the state of the world in a 'business and technical change as usual' perspective, only driven by fundamental economics.
carbon constraint case (CCC and CCC**) scenarios. The CCC scenario is defined through the introduction of carbon penalties differentiated within the main world regions and time horizons. The carbon emissions are determined so that they reflect regional differences following the implementation of the Kyoto targets for 2010, in order to achieve a global reduction of about 10 GtC (i.e. 37 Gt of CO2) by 2030, when compared with the reference case (European Commission Directorate General for Research, 2003).
The CCC* scenario is obtained from the CCC scenario by adding African-specific regulations implemented to obtain a strong reduction of emissions resulting from incomplete combustion. These regulations target vehicles and animal waste. First, two-stroke vehicles are assumed to be replaced by more efficient four-stroke vehicles, resulting in a decrease in the EFs for CO, OC, BC and NMHC and an EF increase for CO2 and NOx. Second, the combustion of animal waste is assumed to be replaced by the combustion of vegetal waste, which has lower EFs for CO, OC and NMHC, but higher EFs for BC, CO2 and NOx. Finally, in the CCC* scenario, South Africa was ranked as a semi-developed country rather than in the sub-Saharan group and fuel consumption in South Africa was therefore expected to decrease. In the group of semi-developed countries the ratio between 2030 and 2002 fuel consumptions is lower than in the developing country group.
1.1.3. African emissions from 2005 to 2030
The consumption data for the three inventories (REF, CCC and CCC*) for the year 2030 were derived from the 2005 African data described in section 1.1.1 and from the ratios between 2030 and 2002 fuel consumption data for the different sectors given by the POLES model. Briefly, our 'country and sector specific' fuel consumptions for the year 2005 were multiplied by the corresponding 'region and sector specific' ratios given by the POLES model. Such a combination implies a few assumptions. For example, 21 fuel types are included in POLES, while we consider 25 types in the regional dataset. For the missing fuel categories in POLES, data for similar fuel types (solid/liquid, activity, etc) were selected. The present year for POLES is 2002 against 2005 in our regional inventory. In those calculations, no evolutions were considered between the 2002 and 2005 fuel consumption data.
1.2. Emission factors
Table 1 displays the values of the EFs selected for the different species and the different combinations of fuel/sector and usage/technology categories.
Table 1. Emission factors for BC, OC, CO, NOx, SO2 and NMHC for motor gasoline (MO), diesel (DL), two-wheeled vehicles (TW), hard coal (CL), fuelwood (FW), charcoal making (CHM) and animal waste (AW) combustions. Key: 3, for developed countries; 2, for semi-developed countries; 1, for developing countries; T, traffic sector; D, domestic sector; I, industrial sector; PPLT, power plant sector.
| Fuel/country | Sectors | BC | OC | CO | NOx | SO2 | NMHC |
|---|---|---|---|---|---|---|---|
| MO | gC/kg (dm) | gC/kg (dm) | gCO/kg (dm) | gNO2/kg (dm) | gSO2/kg (dm) | gNMHC/kg (dm) | |
| 1/2 | T | 0.15 | 0.73 | 300.00 | 19.50 | 2.36 | 34.00 |
| 3 | T | 0.03 | 0.07 | 150 |
9.76 |
0.47 |
17 |
| 1/2 | D | 0.15 | 0.73 | 116.00 | 9.10 | 2.80 | 16.80 |
| 3 | D | 0.03 | 0.07 | 58 |
4.55 |
2.80 |
8.41 |
| 1/2 | I | 0.15 | 0.73 | 116.00 | 9.10 | 2.80 | 16.80 |
| 3 | I | 0.03 | 0.07 | 58 |
4.55 |
2.80 |
8.41 |
| 1/2 | PPLT | 0.02 | 0.07 | 1.40 | 14.00 | 11.00 | 0.08 |
| 3 | PPLT | 0.003 | 0.007 | 0.70 |
7 |
11 |
0.04 |
| DL | |||||||
| 1 | T | 5.00 | 2.50 | 37.00 | 34.40 | 0.72 | 10.85 |
| 2 | T | 2.00 | 1.00 | 14.80 | 13.76 | 0.29 | 4.34 |
| 3 | T | 1.00 | 0.50 | 7.40 |
6.88 |
0.14 |
2.17 |
| 1 | D | 0.35 | 0.25 | 1.20 | 16.50 | 28.50 | 0.65 |
| 2 | D | 0.09 | 0.07 | 0.31 | 4.30 | 28.50 | 0.17 |
| 3 | D | 0.07 | 0.05 | 0.24 |
3.30 |
28.50 |
0.13 |
| 1 | I | 1.00 | 0.75 | 13.32 | 16.65 | 23.40 | 4.00 |
| 2 | I | 0.28 | 0.21 | 5.80 | 7.25 | 23.40 | 1.74 |
| 3 | I | 0.20 | 0.15 | 4 |
5 |
23.40 |
1.20 |
| 1 | PPLT | 0.10 | 0.08 | 4.00 | 26.50 | 23.40 | 0.20 |
| 2 | PPLT | 0.03 | 0.02 | 1.12 | 7.42 | 23.40 | 0.06 |
| 3 | PPLT | 0.02 | 0.02 | 0.80 |
5.30 |
23.40 |
0.04 |
| TW | |||||||
| 1/2 | T | 2.31 | 30.56 | 558.00 | 2.20 | 0.01 | 312.00 |
| 3 | T | 0.28 | 7.36 | 279 |
1.09 |
0.01 |
156 |
| CL | |||||||
| 1/2 | D | 2.28 | 4.77 | 73.80 | 3.31 | 14.00 | 2.79 |
| 3 | D | 1.39 | 2.92 | 45 |
2.02 |
14 |
1.70 |
| 1 | I | 1.10 | 1.10 | 30.34 | 54.35 | 19.00 | 0.37 |
| 2 | I | 0.30 | 0.30 | 8.20 | 14.69 | 19.00 | 0.10 |
| 3 | I | 0.15 | 0.15 | 4.10 |
7.34 |
19 |
0.05 |
| 1/2 | PPLT | 0.08 | 0.08 | 0.61 | 9.79 | 9.50 | 0.04 |
| 3 | PPLT | 0.04 | 0.04 | 0.30 |
4.83 |
9.50 |
0.02 |
| FW | |||||||
| 1 | D | 0.90 | 2.70 | 75.60 | 1.33 | 0.20 | 8.76 |
| 2/3 | D | 0.75 | 2.25 | 63 |
1.10 |
0.20 |
7.30 |
| 1 | I | 0.72 | 2.16 | 8.16 | 3.67 | 0.75 | 1.50 |
| 2/3 | I | 0.60 | 1.80 | 6.80 |
3.06 |
0.75 |
1.25 |
| 1 | PPLT | 0.10 | 0.31 | 9.22 | 5.39 | 0.32 | 0.26 |
| 2/3 | PPLT | 0.09 | 0.26 | 7.70 |
4.50 |
0.32 |
0.22 |
| CHM | |||||||
| 1/2/3 | D | 0.51 | 4.76 | 69 |
0.07 |
0.01 |
12 |
| AW | |||||||
| 1/2/3 | D | 1.00 | 12.50 | 69.00 | 0.07 | 0.01 | 12.00 |
| 1/2/3 | I | 1.00 | 12.50 | 69.00 | 0.07 | 0.01 | 12.00 |
| 1/2/3 | PPLT | 0.14 | 1.79 | 9.80 | 0.01 | 0.001 | 1.70 |
awww.aeat.co.Uk/netcen/airqual/naei/annreport/annrep96/app2_1.htm#SECT3.3. bwww.ipcc-nggip.iges.or.jp/public/gl/guidelin/ch1ref4.pdf. cwww.transport.govt.nz/business/multimodal/environment/vehicle/hapinz/28.php. dAndreae and Merlet (2001). ewww.epa.gov/ttn/chief/ap42/ch01/index.html.
BC and OC. The values of the EFs for BC and OC from motor gasoline and diesel oil were taken from developing country data of Junker and Liousse (2008). Note that traffic sector values reflect the fact that the total number of African vehicles includes a high proportion of old cars. Data on hard coal in the domestic sector, brown coal, fuelwood, vegetal waste and charcoal burning are also taken from Junker and Liousse (2008). EFs from hard coal in the industrial sector were set to 0.15 g kg−1, 0.30 g kg−1 and 1.1 g kg−1, respectively, for developed, semi-developed and developing countries, according to recent literature (e.g. Lamarque et al 2010). EFs for two-wheeled vehicles are taken from Assamoi and Liousse (2010), based on both the literature and new measurements performed during the AMMA campaign in Cotonou (Guinot et al 2014). EFs for charcoal making and animal waste are taken from previous publications (Lacaux et al 1994, Brocard 1996, Liousse et al 1996, Venkataraman and Uma Maheswara Rao 2001, Keene et al 2006, Christian et al 2007, Habib et al 2008, Akagi et al 2011). The BC and OC EFs from coal in the power plant sector in developed countries are taken directly from Bond et al (2004), whereas the EFs from diesel, motor gasoline, biofuel and brown coal were estimated from our EF values in the industrial sector and the ratios of power plant to industrial sectors given in Bond et al (2004) (e.g. a ratio of 10 for liquid fuels, 7 for biofuel, 2.3 for brown coal). In semi-developed countries, EFs were obtained by scaling values typical for developed countries with the ratios between the semi-developed and the developed country EFs of the industrial sector. The same method was applied for developing countries.
CO, NOx, SO2 and NMHC. EF for CO, NOx, SO2 and NMHC species for developed countries were obtained from several publications. Animal waste EFs have been assumed to be similar to the EF from charcoal making for the domestic sector. This assumption has been confirmed by a literature survey Zhang et al (1999), Bhattacharya et al (2000), Venkataraman and Uma Maheswara Rao (2001), Pennise et al (2001), Habib et al (2004), Keene et al (2006), Christian et al (2007, 2010), Akagi et al (2011). CO, NOx and NMHC EFs for semi-developed and developing countries have been estimated from the values used for developed countries by applying the same methodology as for BC particles. SO2 EFs were generally kept constant between developed, semi-developed and developing countries, except for motor gasoline and diesel used in the traffic sectors, due to different sulfur contents in fuels in different countries.
The projected EFs for all fuels in the three scenarios REF, CCC and CCC** have been defined as follows:
- For the REF scenario, EFs are assumed equal to present values.
- For the CCC scenario, EFs in semi-developed countries are equal to present EFs in developed countries. EFs in developing countries are equal to present values of semi-developed countries.
- For the CCC* scenario, EFs are the same as in the CCC scenario, except for * animal waste—EFs are replaced by fuelwood/vegetal waste EFs; * two-wheeled vehicles are substituted by vehicles with four wheels—EF for BC, OC, CO, NOx,SO2 and NMHC are taken as 0.6, 3.8, 266, 4.03, 0.01 and 28.5 g/kg (dm), following http://naei.defra.gov.uk/.
2. Results
2.1. African emissions: a considerable increase in the absence of regulations
Figures 1(a) and (b) and table 2 display the African emissions of BC, OC, CO, NOx, SO2 and NMHC obtained for 2005 and for the three 2030 scenarios discussed in the previous section. A considerable increase is observed between 2005 and 2030 for BC and OC emissions. BC emissions increase by factors of about 4, 3 and 2 from 2005 to 2030 for the REF, CCC and CCC* scenarios, respectively. OC emissions increase by a factor of 3 between 2005 and 2030 for the REF and CCC scenarios and by a factor of 1.5 for the CCC* scenario. We can note that CCC scenario has an impact on reducing BC emissions whereas no impact is noticed on OC emissions. These changes in BC and OC between the REF and the CCC scenario are closely linked to the choice of EFs in the different scenarios. Predominant emissions in the BC class are related to use of diesel fuels, animal waste, fuelwood, charcoal making and coal. There is a general increase in 2030 emissions for the REF scenario for all these fuels. The mitigation options proposed in the CCC and CCC* scenarios by decreasing EF values have an important impact on BC emissions from the use of diesel and coal, which drive the total BC decrease.
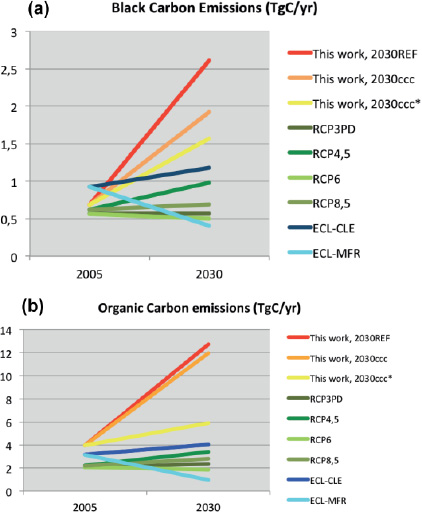
Figure 1. ((a), (b)) African anthropogenic combustion emissions of BC and OC in 2005 and 2030.
Download figure:
Standard image High-resolution imageTable 2. African anthropogenic combustion emissions of CO, NOx, SO2 and NMHC in 2005 and 2030. (Note: Emissions of NOx are in TgNO2/year.)
| Tg species/year | CO 2005 | CO 2030 | NOx 2005 | NOx 2030 | SO2 2005 | SO2 2030 | NMHC 2005 | NMHC 2030 |
|---|---|---|---|---|---|---|---|---|
| This work, ref | 58.6 | 189.4 | 5.8 | 32.6 | 4.0 | 26.0 | 8.6 | 29.3 |
| This work, 2030 CCC | 166.8 | 17.6 | 25.8 | 26.4 | ||||
| This work, 2030 CCC* | 145.1 | 11.3 | 11.8 | 19.1 | ||||
| RCP 3PD | 86.6 | 96.1 | 4.0 | 4.1 | 6.5 | 6.1 | 15.1 | 17.2 |
| RCP 4.5 | 97.6 | 151.8 | 4.2 | 6.5 | 7.0 | 10.9 | 16.2 | 24.1 |
| RCP 6 | 81.6 | 62.4 | 3.7 | 3.1 | 5.9 | 4.8 | 15.6 | 15.6 |
| RCP 8.5 | 94.8 | 129.4 | 4.1 | 6.0 | 6.4 | 7.2 | 17.0 | 23.1 |
| ECL–CLE | 75.9 | 87.9 | 3.3 | 3.8 | 5.4 | 3.5 | 21.4 | 25.1 |
| ECL–MFR | 27.8 | 1.0 | 1.6 |
OC emissions are mostly impacted by animal waste, charcoal making, fuelwood and two-wheeled vehicle fuels. As noticed in figures 1(a) and (b), the REF and CCC scenarios provide rather similar emissions, since the EFs for these fuels considered in the inventories are not changed between the two scenarios. However, the assumption of replacing two-wheeled by four-wheeled vehicles and animal waste by vegetal waste (which reduce the corresponding EFs) has a significant impact on OC emissions in the CCC* scenario. A sensitivity test has been conducted to quantify the impact of eliminating charcoal making. In this case, BC and OC emissions in the CCC* scenario would decrease by 19 and 50%, respectively. The OC emission trend from 2005 to 2030 would then be reversed. These calculations emphasize the important role of the choice of the EFs and of type of energy source for mitigating BC and OC emissions in Africa.
The same features are observed for the emissions of the gaseous compounds (table 2). CO and NMHC emissions increase by a factor of about 3 between 2005 and 2030, while emissions of NOx and SO2 increase by a factor of about 6. Reductions in the CCC scenario compared with the REF scenario are negligible in the case of SO2 emissions and of the order of 10% for CO and NMHC, as well as for OC emissions. NOx emissions decrease by about 46%, as well as BC emissions. Decreases in the CCC* scenario compared with the REF scenario are of the order of 20, 35, 55 and 65% for CO, NMHC, SO2 and NOx, respectively. These variations also emphasize the important role of EF mitigation.
The evolution of the BC/OC ratio between the 2030 REF (BC/OC = 21%), the 2030 CCC (BC/OC = 16%) and the 2030 CCC* scenarios (BC/OC = 27%) have noticeable consequences. In the 2030 CCC* scenario, i.e. the 'perfect' scenario leading to an OC emission decrease, the relative abundance of BC in the combustion aerosol mixture would increase. Therefore, better air quality could be expected with the CCC* scenario, but the absorption properties of the new aerosol mixture could be increased due to a relative increase of BC. This needs to be quantified.
2.2. Regional features
Figure 2 shows the regional distributions of OC emissions in Africa for the two extreme scenarios, i.e. REF and CCC*. Emissions are maximum in western Africa (45 and 39% of the total African emissions for REF and CCC* scenarios, respectively) with very high values obtained for Nigeria. In eastern Africa, emissions represent 24% and 29% of the total African emissions for REF and CCC* scenarios, respectively, with maximum values for Ethiopia and Kenya, whereas in South Africa the corresponding figures are 26% and 22%. Northern Africa contributes 5% and 9% to the total African emissions for REF and CCC* scenarios, respectively. BC, CO and NHMC emissions are also maximum in western Africa. They present very high values in southern Africa, eastern Africa and northern Africa in the REF scenario, and in eastern Africa, southern Africa and northern Africa in the CCC* scenario. Regional distributions of NOx and SO2 emissions are distributions for the different countries. They are maximum in southern Africa, and also very large in western Africa, northern Africa and eastern Africa for the REF and the CCC* scenarios. As previously described, these regional variations result from the choice of the EF values, combined with regional specificities for different sectors and fuels. Western Africa has large emissions in the domestic and traffic sectors for BC, OC, CO, NOx and NMHC species. In southern Africa, domestic and traffic sectors are predominant for BC, OC, CO and NMHC, whereas power plant and industrial sectors provide large SO2 and NOx emissions. The domestic sector is important in eastern African for all species. The traffic sector dominates in northern Africa, except for SO2, with are larger emissions from the power plant sector, and OC from the domestic sector. The importance of the emissions among the different countries provides information on how emissions could be mitigated for different species and regions. In western and eastern Africa, action on biofuels would be the most efficient way to decrease domestic emissions of BC, OC, CO and NMHC, not to mention the decrease in the use of two-wheeled vehicles. In southern Africa, action on coal would be the most efficient way to decrease industrial and power plant emissions. Regulations on the use of diesel fuels would be useful in all regions to decrease traffic emissions.
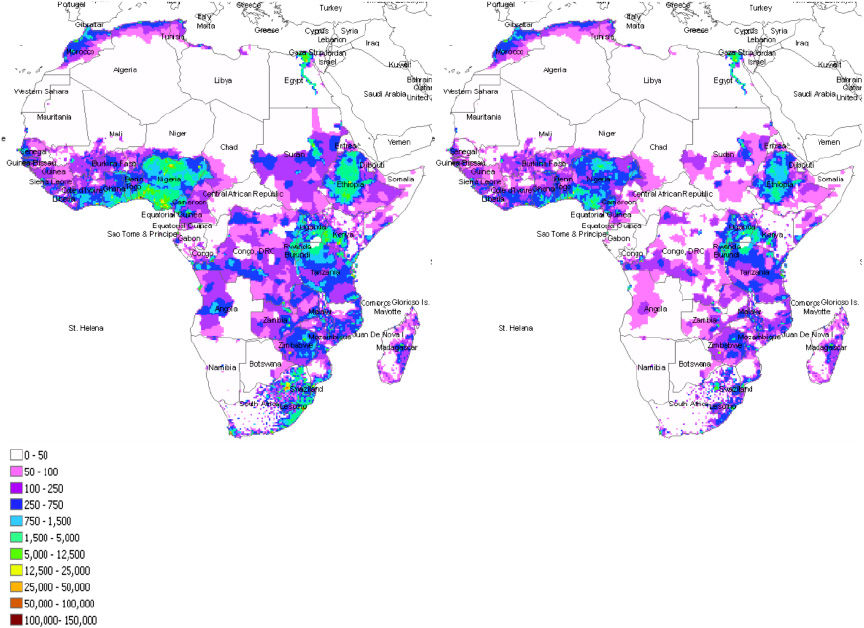
Figure 2. Spatial distribution of anthropogenic combustion emissions of OC in tons of C/year in Africa in the 2030 REF (left) and 2030 CCC* (right) scenarios.
Download figure:
Standard image High-resolution image2.3. Comparison with other global inventories
A detailed comparison has been made between emissions provided by this regional inventory and African emissions provided by the most recent global inventories for the years 2005 and 2030. To our knowledge, no other regional African inventories are currently available. The comparisons discussed in this section focus only on Africa. In figures 1(a) and (b), the total BC and OC emissions from the four representative concentration pathways (RCP) scenarios (3PD, 4.5, 6 and 8.5) and from the ECLIPSE (CLE and MFR) dataset (www.eccad.sedoo.fr) are added to the emissions discussed previously.
- The RCP projections of future emissions (van Vuuren et al 2011a) are based on the outcomes of four independent modeling teams (NIES/AIM, IIASA/MESSAGE, PNNL/MiniCAM, and PBL/IMAGE). Each of them (RCP 3PD, van Vuuren et al 2007; RCP 4.5, Clarke et al 2007; RCP 6, Fujino et al 2006; RCP 8.5, Riahi et al 2007) applied a set of algorithms to ensure consistency with the 2000 ACCMIP historical emission inventory (Lamarque et al 2010).
- ECLIPSE V4a is the global emission dataset developed with the GAINS model for the period 2005–2030 by the International Institute for Applied Systems Analysis (IIASA) (Höglund-Isaksson 2012, Klimont et al 2013, 2014a, 2014b). The emission calculation for 2005 includes respective information on activity data, environmental legislation, production and abatement technology characteristics, etc. ECLIPSE provides two scenarios for the year 2030: (1) the baseline scenario emissions (CLE scenario) as the current legislation case (CLE) where existing legislation is implemented but there are no assumptions made as to how such legislation can develop further in the coming decades; (2) the MFR (maximum feasible reduction) scenario where best available technology is applied to all source sectors.
First, a comparison of available data on consumption of oil and coal fuels from 2000 to 2030 at global scale has been done between the POLES model (Criqui 2001) and RCP inventories (van Vuuren et al 2011b). There is a similar order of increases for the best scenarios (1.3–1.7 for coal and 1 for oil) and the worst scenarios (2.5–3 for coal and 1–2 for oil) for each database.
In 2005, POLES BC emissions shown in figure 1 are similar to those from the RCP inventories. BC emissions from the ECLIPSE dataset are 30% higher. As shown in figure 3, which displays a detailed comparison of BC emissions sector by sector, this difference is due to higher domestic BC emissions in the ECLIPSE CLE inventory. In 2030, RCPs and ECLIPSE show lower BC emissions in the future than in our scenarios. The smallest difference (25%) is obtained between the CCC* scenario and ECLIPSE CLE scenario. Domestic and traffic BC emissions are higher in our inventories than in the others.
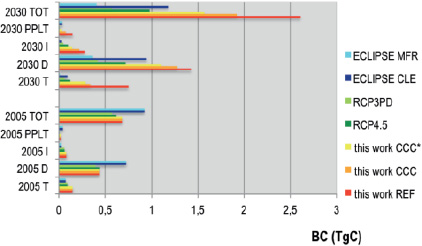
Figure 3. African anthropogenic combustion emissions of BC by sector of usage (T, traffic; D, domestic; I, industrial; PPLT, powerplant) in 2005 and 2030.
Download figure:
Standard image High-resolution imageEstimates of OC emissions disagree among the datasets in 2005. The highest value (4 TgC) is obtained in our inventory, whereas RCP shows the lowest value (2 TgC), and ECLIPSE CLE (3 TgC) lies in the middle. The difference is mainly due to the relative importance of domestic OC emissions, which are higher in our inventory than in the others. In 2030, there is a very large difference (a factor of 2–10) between our REF and CCC inventories and the rest of the estimates including the CCC* inventory. Such differences are mainly due to domestic and industrial emissions. The CCC* inventory, which assumes the replacement of all 'dirty ' biofuels by cleaner fuels, for example, has the best agreement with the other scenarios. The slope of our CCC* scenario is roughly the same as that from the RCP 4.5 scenario.
The same differences are observed for the emissions of gaseous compounds, as shown in table 2, which gives African emissions for all the datasets considered. In 2005, our estimates for the emissions of CO, SO2 and NMHC species are 30–50% lower than estimates from RCPs and ECLIPSE but are about 30% higher for NOx. In 2030, our estimates are generally higher than the others, and are very close to the RCP 4.5 scenario, except for NMHC for which all estimates are similar.
This comparison shows that there are marked differences between our inventory and African emissions provided by global inventories, though the values are of the same order in some cases. Differences result from the regional specificities for Africa that we introduced in our study. Our study also demonstrates the importance of a good knowledge of the EFs: there is therefore an urgent need for accurate measurements of the EFs in each country, specifically for biofuel emissions, since only a few measurements are available for Africa.
2.4. African combustion emissions: the worldwide importance
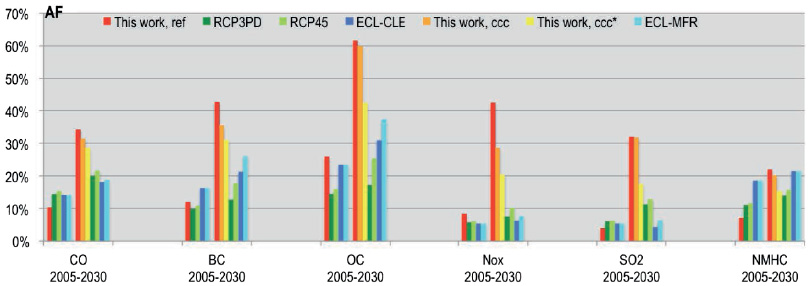
Figure 4 shows the relative contribution of African combustion emissions to global combustion emissions, for particle and gas emissions for the years 2005 and 2030. As detailed in the legend, this contribution was estimated through a comparison between the regional emissions for Africa, and global totals from the RCPs and ECLIPSE inventories.
Figure 4. African relative contribution (AF) to the global total combustion emissions (GE). AF was calculated as follows: AF = AFE/GE where AFE is the total of our African emission inventory and GE is combustion emissions at global scale, GE = (GE − AFE(RCP, ECL)) + AFE where AFE (RCP, ECL) and GE are, respectively, the average of African combustion emissions and the average of combustion emissions at global scale in the RCP and ECL inventories.
Download figure:
Standard image High-resolution image
In 2005, the contribution from Africa to the total global emissions amounted to about 5% for SO2 and NOx, to 20% for OC, and of the order of 10% for CO, BC and NMHC. In 2030, the African contribution significantly increases for all species, for all the inventories. The highest increase is clearly observed for our regional African inventory. For example, in 2030, African OC will represent 54% on average of the global anthropogenic combustion emissions, and NMHC, CO, BC, NOx and SO2 will contribute to 20–30% of the total. The ECLIPSE MFR scenario also displays high contributions (close to our CCC* scenario) for BC (25%) and OC (37%). For NMHC, the regional and global inventories are similar. It is also important to mention that African emission contributions are sensitive to the different scenarios: the relative contribution of African OC decreases from 60% to 40% between the REF and the CCC* scenarios.
We have also compared the African anthropogenic combustion inventories with biomass burning emissions in Africa. In 2005, the biomass burning emissions for all species (Liousse et al 2010) were greater than the anthropogenic emissions estimated with our new regional anthropogenic inventories. However, in 2030, the estimated anthropogenic emissions are expected to equal the biomass burning estimates (e.g. biomass burning BC emissions are 2.1 TgC in the AMMA biomass burning inventory (Liousse et al 2010) compared with the 2030 range of 1.6–2.6 TgC for anthropogenic combustion estimates).
3. Conclusions
We have developed an inventory of African emissions for the year 2005, and quantified the emissions in 2030 for three different scenarios. This study has shown that the 2005 African emissions made a significant contribution to the global emissions in 2005. These emissions will increase further, and could represent about 50% of the global emissions of organic carbon in 2030. A considerable increase in emissions from Africa is then expected in 2030 if no regulations are implemented. This work highlights the possible effectiveness of regulations, and their impact on future decreases in emissions and their worldwide importance. We have furthermore evaluated mitigation efforts to reduce African combustion emissions (e.g. replacement of two-wheeled vehicles, decreased in charcoal making and reduction in the burning of animal waste).
We have defined an integrative inventory taking into account both particles and gases using the same methodology. This ensures that the evaluation of the impact of emissions regulations will be consistent among the different species considered, for the specific conditions found in African regions and for different types of sources. In southern Africa, for example, the optimal way to reduce CO, OC, NMHC and BC emissions could concentrate on biofuel combustion whereas mitigation of coal combustion will mainly decrease SO2 and NOx emissions.
This comparison shows that there are marked differences between our inventory and African emissions provided by global inventories, with a few agreements. This work has demonstrated the urgent need to consider African anthropogenic emissions at regional scales.
African anthropogenic emissions require more detailed studies: the uncertainties in the estimates of emissions remain large, and cannot currently be assessed due to the lack of adequate data. Measurements of emission factors and of fuel consumption are required; for example, an accurate quantification of the number of vehicles in each African country is needed. Other sources are still largely unknown, such as the emissions from flaring of waste gas from natural gas extraction in Nigerian platforms.
To conclude, more data on anthropogenic emissions in Africa will be crucial for estimating their impact on climate change and health.