

Abstract
Climate has a strong influence on fire activity, varying across time and space. We analyzed the relationships between fire–weather conditions during the main fire season and antecedent water-balance conditions and fires in two Mediterranean-type regions with contrasted management histories: five southern countries of the European Union (EUMED)(all fires); the Pacific western coast of the USA (California and Oregon, PWUSA)(national forest fires). Total number of fires (≥1 ha), number of large fires (≥100 ha) and area burned were related to mean seasonal fire weather index (FWI), number of days over the 90th percentile of the FWI, and to the standardized precipitation-evapotranspiration index (SPEI) from the preceding 3 (spring) or 8 (autumn through spring) months. Calculations were made at three spatial aggregations in each area, and models related first-difference (year-to-year change) of fires and FWI/climate variables to minimize autocorrelation. An increase in mean seasonal FWI resulted in increases in the three fire variables across spatial scales in both regions. SPEI contributed little to explain fires, with few exceptions. Negative water-balance (dry) conditions from autumn through spring (SPEI8) were generally more important than positive conditions (moist) in spring (SPEI3), both of which contributed positively to fires. The R2 of the models generally improved with increasing area of aggregation. For total number of fires and area burned, the R2 of the models tended to decrease with increasing mean seasonal FWI. Thus, fires were more susceptible to change with climate variability in areas with less amenable conditions for fires (lower FWI) than in areas with higher mean FWI values. The relationships were similar in both regions, albeit weaker in PWUSA, probably due to the wider latitudinal gradient covered in PWUSA than in EUMED. The large variance explained by some of the models indicates that large-scale seasonal forecast could help anticipating fire activity in the investigated areas.
Export citation and abstract BibTeX RIS

Content from this work may be used under the terms of the Creative Commons Attribution 3.0 licence. Any further distribution of this work must maintain attribution to the author(s) and the title of the work, journal citation and DOI.
1. Introduction
Climate plays a major role in fires. On a short-term scale, weather closely controls fire ignition and propagation (Rothermel 1972). Daily warnings of fire danger are used by fire agencies across the world to allocate fire suppression resources based on indices that primarily integrate meteorological variables in ways that reflect the main processes affecting fire ignition, behavior, and difficulty of fire control (Fujioka et al 2008, Dowdy et al 2010). Numerous studies have related mean fire–weather values of various periods (the fire season being the most common), alone or combined with other climate variables of the relevant period to explain fire activity (e.g., Preisler et al 2008, Koutsias et al 2013, Riley et al 2013). While many studies emphasize the importance of climate during the fire season in determining fire activity (e.g., Koutsias et al 2012, Morton et al 2013), antecedent climate (i.e., conditions that occur months or years before the fire season) has been shown to also contribute to fire occurrence (Dimitrakopoulos et al 2011), area burned (Trouet et al 2006, Archibald et al 2010a, Abatzoglou and Kolden 2013), and large fires (Keeley and Zedler 2009, Barbero et al 2014), through its influence in fuel load and flammability of live and dead fuels (e.g., Castro et al 2003, Dennison et al 2008).
On a longer term, climate has a strong but complex influence on fires because it determines primary productivity and vegetation, hence fuels, all of which determine global fire patterns (Krawchuk et al 2009, Archibald et al 2013). The study of the longer-term climate controls on fires has been recently framed in a context of the fuel amount versus fuel moisture limitations paradigm (Meyn et al 2007, Krawchuk and Moritz 2011, Pausas and Ribeiro 2013). According to this, in more arid areas, with less favorable climate for plant growth, low primary productivity more than weather conditions will limit fuels and fires. At the other end of the spectrum, in areas with favorable climate for plant growth, fires may be limited by unfavorable weather conditions for them to ignite and spread owing to excess moisture. Consequently, changes in climate from year to year can differentially affect areas with different controls on fires. Moreover, areas that encompass a variety of vegetation types due to climate could also be differentially responsive to changes in climate variability, depending on what factors most limit fires. Notwithstanding, changes in local conditions (i.e., particular strong winds) (Moritz et al 2010) and in the environmental and sociological contexts can occur across the geographic space as well, all of which can modify climate-related controls on fires beyond the fuels/conditions limitations paradigm (Loepfe et al 2014, Parks et al 2014). As geographic scale increases, the probability of having areas responsive to different climate controls is also likely to increase, hence the relative importance of the various factors affecting fire can vary with the scale (Falk et al 2007, Parisien and Moritz 2009, Archibald et al 2010b). All of this complicates anticipating how the fire–climate relationships will change when moving from smaller to larger areas or across areas through climate and other gradients.
Here we investigated the relationships between fire activity during the main fire season and climatic conditions during that season and the preceding months for the 1985–2011 period in two Mediterranean-type climate areas that have had different management histories: southern European Union (EUMED) and the Pacific western USA (Oregon and California, PWUSA). Analyses were done at three spatial scales, from provincial level in Spain/national forests in PWUSA, to subregions in both EUMED/PWUSA, and whole region in each continent. By comparing southern Europe, including fires in all its territory, and PWUSA, focusing on national forest lands, would permit assessing climate controls in two most contrasted territories, sharing a largely-similar climate.
2. Methods
Models of fire activity (total number of fires [≥1 ha], number of large fires [≥100 ha] and area burned by all fires [≥1 ha]) as a function of within-season and antecedent climate conditions were developed for the period 1985–2011 in two regions: the southern countries of the European Union (Portugal, Spain, South France, Italy and Greece; EUMED) (figure 1(a)), and the two southern states of the Pacific western coast of the USA (Oregon and California, PWUSA) (figure 1(b)). EUMED (Latitude: 43.11 to 36.12, Longitude: −9.28 to 28.08 in decimal degrees) covered a wider longitudinal gradient than PWUSA (Latitude: 46.28 to 32.60, Longitude: −124.0 to −116.27), which represented a longer latitudinal gradient.
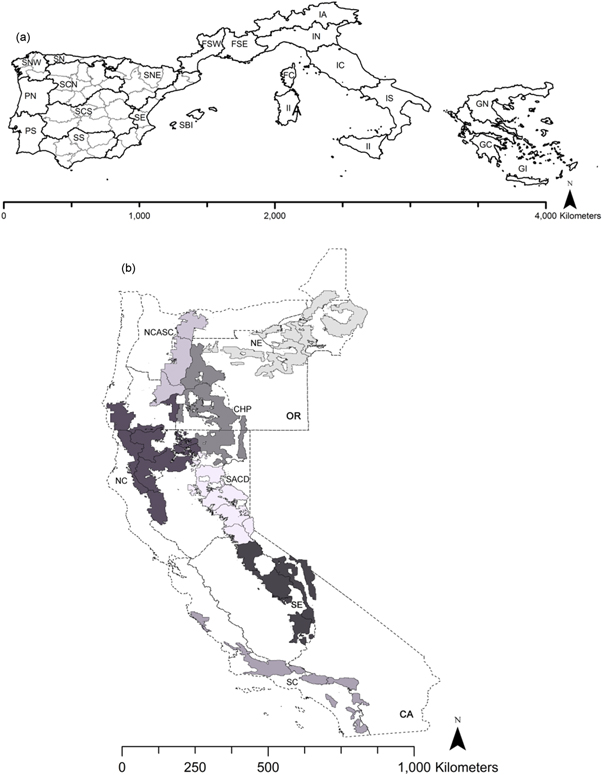
Figure 1. Study areas and scales. (a) Map of the Spanish provinces (gray lines), subregions (darker lines) and the whole EUMED region; (b) map of the national forests of Oregon and California (polygons), group of forests (filled areas) based on NOAA climate divisions (dotted lines), and the whole PWUSA region.
Download figure:
Standard image High-resolution imageFire–climate models were developed at three geographical scales in each study region: small (10 900 ± 4500 km2 and 11 850 ± 3400 km2, (mean ± SD)), medium (54 000 ± 31 700 km2 and 23 700 ± 6750 km2), and large (1188 010 km2 and 166 000 km2 for EUMED and PWUSA, respectively) (figure 1). At EUMED, calculations at the smaller scale were made for 47 provinces (i.e., NUTS3—nomenclature of territorial units for statistics—level)(EUROSTAT 2011) at Peninsular Spain based on daily fire statistics (EGIF, Spanish National Forest Fire Statistics, Spanish Ministry of Agriculture, Food and the Environment). In the medium scale, we modeled 21 subregions (proxy of NUTS2) of the different southern EU countries with monthly fire statistics, using the European Fire Database stored at the Joint Research Centre of the European Commission (Camia et al 2014), and then aggregated at the larger scale for the whole EUMED (figure 1(a)). At PWUSA, calculations were made using national forests fire data (FAMWEB Forest Service state data http://fam.nwcg.gov/fam-web/weatherfirecd/state_data.htm, last accessed 5 February 2015). At the smallest scale, we defined 15 areas using single national forests or, when these were too small, aggregations of several of them to reach an approximate equivalent area to the Spanish provinces. For the medium scale, we aggregated national forest data into 7 subregions following US climatic divisions boundaries for Oregon and California (www.esrl.noaa.gov/psd/data/usclimdivs/boundaries.html, last accessed 5 February 2015) (figure 1(b)). Los Padres National Forest was treated as South California subregion, although one part is located in the Central Coast. Finally, for the larger scale, data were aggregated for the whole PWUSA. Despite similarities in climate between both regions, there were some differences between them that need to be mentioned. At EUMED, the whole territory was used, and thus all fires, the majority of which are caused by people (on average 7% of area burned by lightning, 58% human-caused, and 35% unknown which most probably correspond to human-causes), albeit with some differences among the various areas (see Vázquez and Moreno 1998 for data from Spain). At PWUSA, only national forests territory, (which amounted to 25% of Oregon and California), and corresponding fires, were analyzed. National forest fires data have been often used in studies assessing large scale patterns of relationships between climate and fire activity (Gedalof et al 2005, Trouet et al 2006, 2009, Keeley and Syphard 2015). While it has been shown that the interannual variation in fire activity in national forests is correlated with that at the state level for California (Trouet et al 2006), differences in climate drivers of fires between forest and non-forest areas have been documented (e.g., Keeley and Syphard 2015). In Oregon, national forests territory covers a diverse range of fire regimes (Agee 1993, Gedalof et al 2005), but excludes the grassland fires of the Intermountain West (e.g., Knapp 1998). Thus, while national forests cover a diverse range of ecosystems, yet they may not capture the full range of them and of other factors driving fires in the study area. Forest fires in national forest of PWUSA are caused on average by lightning (36% of area burned) and human causes (64%), with differences between interior mountains, where lightning-ignited fires become more important than along coastal subregions where human-caused fires dominate.
A potential problem when comparing two time series is the possibility of autocorrelation. One means of dealing with such autocorrelations is with the time series technique of differencing, where the value of the variable at time t − 1 is subtracted from the variable at time t (Lobell and Field 2007, Trouet et al 2009, Turco et al 2014, Bedia et al 2015). Thus, the relationship between fire activity and climate conditions was ascertained by means of multiple linear regressions between first-difference time series of fire and climate-related variables. The period of study (1985–2011) was common to both regions and for all three scales, as well as the fire season (June to September, from now on abbreviated JJAS) except for South California (Los Padres, Angeles, San Bernardino and Cleveland national forests), in which October fires were included (i.e., JJASO) due to the presence of large fires in some years. This fire season amounted, on average, to 70%, 83% and 82% of number of fires, large fires and area burned, respectively, in EUMED, and 81%, 92% and 97%, respectively, in PWUSA.
To set the modeling framework, we first calculated the yearly change, in percentage, of each response variable (i.e., number of fires (≥1 ha), number of large fires (≥100 ha) and area burned by all fires ≥1 ha). Similarly, we characterized within fire-season conditions using the fire weather index (FWI) of the Canadian Forest Fire Danger Rating System (Van Wagner 1987), which is calculated based on daily meteorological conditions at noon time for air temperature and relative humidity, wind speed, and rainfall accumulated over 24 h. From the FWI time series we calculated the corresponding absolute increment, or yearly delta, of the mean FWI (FWIm) conditions experienced in the fire season. Prior to the modeling exercise, trends in the three metrics of fire activity and FWIm time series data at medium and large scales were analyzed using the Mann–Kendall trend-test, using the R package 'Kendall v.2.2' (Hipel and McLeod 2005, R Development Core Team 2013). Furthermore, we also tested the influence of extreme FWI events on fire activity, calculating the delta in the number of days over the 90th percentile of the FWI historical series for each area (dFWI90). FWI daily values were calculated from WATCH-Forcing-Data-ERA-Interim at 50 km (Weedon et al 2010) applied to ERA-Interim data (Dee et al 2011), following Bedia et al (2012). Finally, in order to test the influence of antecedent climate on fires, we extracted the standardized precipitation-evapotranspiration index (SPEI) (Vicente-Serrano et al 2010) from the Global 0.5° gridded SPEI dataset (Beguería et al 2014), which indicates the deviations of the current (e.g., period of reference) water-balance (precipitation minus potential evapotranspiration) with respect to the long-term water-balance, with time-scales between 1 and 48 months. Specifically, for each spatial unit of analysis at each scale we sampled the SPEI in May (i.e., to reflect the water-balance conditions accumulated just before the fire season) for two time scales: 3-months SPEI (March to May, SPEI3) to cover spring months, and 8-months SPEI (October to May, SPEI8) to capture the preceding autumn through spring conditions. We calculated the corresponding absolute increment, or yearly delta, for SPEI3 and SPEI8 with positive values indicating an increase in moisture and negative indicating an increase in drought conditions.
A forward stepwise regression analysis was performed with the pool of potential predictors (FWIm, dFWI90, SPEI3, SPEI8), using the R package 'stats v.3.0.2' (R Development Core Team 2013). We tested combinations of all possible predictors, maintaining those that were significant (p < 0.05) and added variance explained of the fire variables. Goodness of fit of the models was assessed by maximum log-likelihood, explained variance (adjusted R2), and examining the model residuals. Resulting models for each fire variable were compared using Akaike's information criterion (AIC) (Akaike 1992). The model with the minimum AIC was selected as the best model. If two models showed a difference in AIC between 0 and 2, these were considered to have equivalent empirical support (Burnham and Anderson 2002), and the simplest one was selected as the best model. The high variability in the fire data in a few small areas led us to carefully examine outliers. These were investigated using the Bonferroni outlier test in 'car v. 2.0.19' package (Fox and Weisberg 2011), omitting those values at p < 0.001, and after rigorous examination of residual plots. The reasons for such highly deviant years, when present, was beyond our primary interest, and were not further investigated. Additionally, to confirm that results were not sensitive to different assumptions of regressing first-differences, we checked the alternative technique of regressing the detrended residuals (Nicholls 1997) in a number of areas and for various scales, which produced qualitatively similar results (not shown). Before calculations, fire data were transformed to meet linear regression assumptions: number of fires (≥1 ha, and ≥100 ha) was square-root transformed, and area burned log-transformed.
Finally, to ascertain how climate controls on fires vary in relation to the prevailing climate conditions across areas, for both small and medium scales in both continents, we linearly related the R2 of the best climate–fire model obtained in each particular area (for each of the three fire variables) with the long-term mean seasonal FWI of the respective area.
3. Results
During the 1985–2011 period, significant decreasing trends were found at the whole EUMED for the number of fires (tau = −0.45, p < 0.01), number of large fires (tau = −0.40, p < 0.01), and marginally for area burned (tau = −0.27, p = 0.058) (figure 2). Similarly, decreasing trends were found for several EUMED subregions, particularly in Spain, Italy and Greece (table A1). Italian Islands were the only subregion showing an increase in the three fire variables (p < 0.05). On the other hand, no trend was found at the whole PWUSA (figure 2), and only few subregions showed significant trends in fire activity (table A2). While the number of fires significantly decreased in the South East and South of California (p < 0.05), an increasing trend was found for large fires and area burned in Northern Cascades (p < 0.05), and marginally for area burned in the South California subregion. In mean seasonal FWI no significant trends were detected for any of the two regions; at the subregional scales, positive FWIm trends were found in Spain East (tau = 0.30, p < 0.05) and Spain South (tau = 0.40, p < 0.01) at EUMED, and in the Sacramento Drainage (tau = 0.40, p < 0.01) at PWUSA (appendix A).
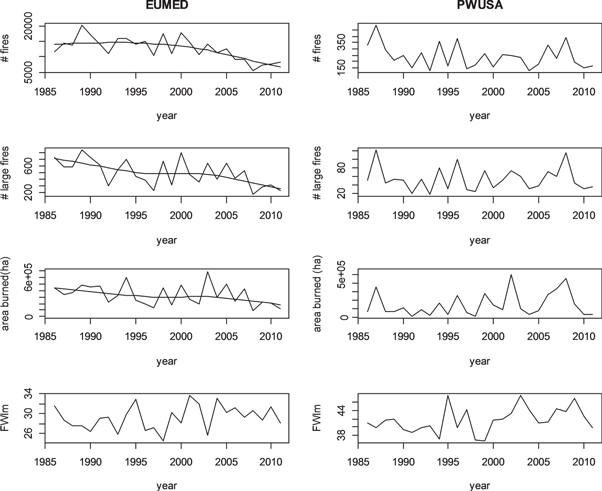
Figure 2. Time series of the three fire variables (number of fires, number of large fires, area burned) and mean FWI (FWIm) at the larger scale for EUMED (left pannels) and PWUSA (right pannels) (June–September, 1985–2011). Significant trends are shown fitting a nonparametric loess curve to the data. For details of the Mann–Kendall test results at large and medium scales see the text and appendix A.
Download figure:
Standard image High-resolution imageAt the smallest scale of provinces and national forests, fire activity was moderately explained by both, within season FWI and antecedent climate, and for both regions, EUMED and PWUSA. This was true for the three fire variables tested (number of fires, number of large fires and area burned), with minor differences among them within and between regions (figure 3(a)). Only a few (5 provinces and 3 national forests) did not show significant relationships to within season FWI conditions and antecedent climate for any of the three fire variables (tables B1 and B2).
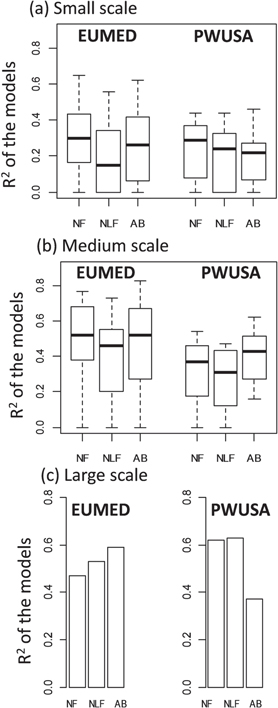
Figure 3. Variance explained (adjusted R2) of the best fire–climate models of number of fires (NF), number of large fires (NLF), and area burned (AB) at small (a), medium (b) and large (c) spatial scales for EUMED and PWUSA. For details of the contribution of within season FWI and antecedent climate see appendices B and C.
Download figure:
Standard image High-resolution imageAt the medium (i.e., sub-regional) scale, the variance explained by the models increased, more so in EUMED than in PWUSA (figure 3(b)). Differences between fire variables within regions were small. Note the high values obtained in some subregions at EUMED (R2 > 0.70) (Spain North East, France South West and East, Italy North, Center and South), and at PWUSA (R2 > 0.50) (Northern Cascades, North Coast, South California) (tables C1 and C2).
At the largest scale (i.e., whole region), relationships were still higher and similar in both regions and for the three fire variables, albeit with some differences. All variables were highly predictable (R2: 0.46–0.63) in both regions, except for area burned that was less predictable in PWUSA (R2: 0.37) (figure 3(c), tables C1 and C2).
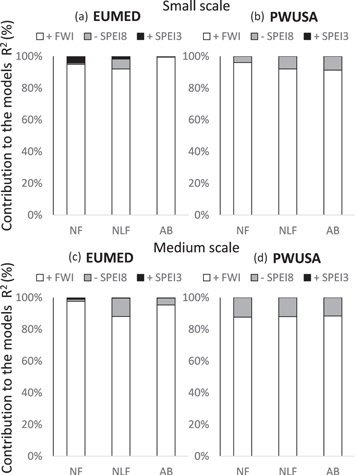
Most of the variability at either provinces/national forests or subregions was explained by within-season conditions, with an increase in mean seasonal FWI resulting in increases in the three fire variables (figure 4, appendices B and C). The number of days over the 90th percentile of the FWI (dFWI90) did not enter in any of the best models, and in many instances was highly correlated with mean FWI. Antecedent climate contributed to the models only at a few provinces/national forests or subregions in both continents (appendices B and C). When it did, 3-months SPEI contributed positively (a positive water-balance in spring, i.e., moist conditions, led to more fires and larger burned areas), while 8-months SPEI contributed negatively (i.e., autumn through spring dry conditions led to increased fire activity, with more fires and larger burned areas). While the mean contribution of these variables to the models was small (figure 4), in some cases they contributed quite markedly. This was mainly due to the high contribution of SPEI8, more so at subregional scale (tables C1 and C2): for number of fires (e.g., Spain North), large fires (e.g., Spain East, France South East and West, Central Italy and Greece), and area burned (e.g., France South East and West) in EUMED, and number of fires (e.g., North Coast, Central High Plateau), area burned (e.g., Northern Cascades) and large fires (e.g., southern California) in PWUSA. SPEI3 (spring wet conditions) showed a positive effect on fires only at EUMED, and more so at the small scale (table B1). At the scale of whole region (both, EUMED and PWUSA) no other variable than within-season mean FWI contributed to the models (tables C1 and C2).
Figure 4. Average relative contribution (as percentage) of within-season (mean FWI) and antecedent (SPEI3, SPEI8) climatic conditions to number of fires (NF), number of large fires (NLF), and area burned (AB) at small (a), (b) and medium (c), (d) spatial scales, for EUMED and PWUSA.
Download figure:
Standard image High-resolution image
Model performance was not homogeneous across the areas studied within each continent. We found a negative relationship, albeit weak, between the R2 values of the best fire–climate models and the long-term mean FWI of the various areas. This was so for the number of fires at both scales and continents, and for area burned at PWUSA small scale and EUMED subregions (table 1).
Table 1. Results of the models fitted between the R2 values of the best fire–climate models and the long-term mean FWI for EUMED and PWUSA.
| Number of fires | Area burned | |||||
|---|---|---|---|---|---|---|
| Intercept | Slope | R2 (p) | Intercept | Slope | R2 (p) | |
| Small scale | ||||||
| EUMED Spanish provinces | 0.625 | −0.010 | 0.26 (***) | — | — | n.s |
| PWUSA national forests | 0.615 | −0.008 | 0.21 (*) | 0.680 | −0.011 | 0.42 (**) |
| Medium scale | ||||||
| EUMED subregions | 0.914 | −0.015 | 0.40 (**) | 0.782 | −0.011 | 0.15 (*) |
| PWUSA subregions | 1.230 | −0.022 | 0.58 (*) | — | — | n.s |
4. Discussion
Mean seasonal fire–weather proved critical for fire activity in both regions, with minor influence of longer-term antecedent water-balance climatic conditions. Years with higher fire danger FWI values in summer corresponded to years with increased number of fires (total and large fires) and area burned, and vice versa. The rather strong relationship at the largest scale, with R2 values that explain almost 60% of the total variance for area burned at EUMED, and above 60% for number of fires and large fires at PWUSA, indicates that fire–climate relationships have been very strong during the nearly three last decades. The variance explained by our models was comparable to that obtained in other studies that used a number of variables for characterizing climate controls on fires (e.g., Trouet et al 2009, Amatulli et al 2013). The fact that much of the variance in the various fire variables was explained by the mean seasonal FWI implies that a simple, integrated measure of weather conditions during the fire season carries substantial information for anticipating fire activity. These findings are important considering the large socio-economic differences between the two regions, and the contrasted changes over time occurred during the study period, with consequent impacts on landscapes, fuels, ignitions patterns or firefighting, among other. For instance, in EUMED the dominant trend has been rural exodus, abandonment, afforestation and concentration of population in cities (e.g., Viedma et al 2015), while in PWUSA the dominant trend has been increasing urbanization (e.g., Syphard et al 2007). National forests may have been indirectly affected by such changes, but not their landscapes on a comparable magnitude to what has happened in EUMED. Nonetheless, in some areas a substantial amount of variance was not explained by climate conditions, thus other factors (e.g., socio-economic, ignition patterns, fire management, etc) are also relevant.
Some studies use conversions of FWI values (i.e., daily, monthly or seasonal severity ratings) to enhance the role of high FWI days (Van Wagner 1970). In our approach, we used raw FWI daily values, without further additional conversion to daily or monthly severity values. We tested days over the 90th percentile of the FWI to account for possible additional effects of extreme events. Nonetheless, mean FWI seasonal values and days above the 90th percentile were highly correlated, and mean FWI values were the best predictor kept by the models.
Despite previous reports on the significant role of antecedent water-balance conditions on fires in both regions using different approaches (e.g., Keeley 2004, Gedalof et al 2005, Riley et al 2013, Gudmundsson et al 2014, Keeley and Syphard 2015, Marcos et al 2015, Sousa et al 2015), adding this information did not generally improve our models, except in a few areas in which such variables proved to be relevant. Negative water-balance (i.e., dry) conditions from autumn through spring (SPEI8) were generally more important than positive conditions (i.e., moist) in spring (SPEI3) in contributing to increase fires. The fact that only in a few areas antecedent water-balance was important does not permit any generalization with regard to where (i.e., more or less humid areas) this was more relevant. For example, increasing negative SPEI8 in the antecedent months was important for area burned and number of large fires in southern France, a rather mesic area, but also for number of large fires in southern California, a much drier area. Similarly, while wet conditions in spring (SPEI3) contributed positively to fires in a few areas (e.g., some Spanish provinces) probably due to increasing fine fuel load during the summer months, there was no consistent pattern as to under which dominant climate conditions this variable was more important. Notwithstanding, it must be pointed out that the FWI index also includes drought code as an indicator of seasonal drought effects, which has a 52-day time lag in moderate weather conditions (Lawson and Armitage 2008) and correlates well with long-term live-plant moisture content (e.g., Pellizzaro et al 2007). This means that FWI partly carries antecedent water-balance information and that only in a few areas variations in this were sufficiently important or long in time to exceed what was embedded in the FWI index.
Trends in fire danger (mean FWI) during the period analyzed were non-significant, except in a few subregions in both EUMED and PWUSA. However, positive trends in fire danger have been reported in both EUMED (Venäläinen et al 2014) and PWUSA (Abatzoglou and Kolden 2013). This is probably due to the shorter period analyzed and different areas of reference, which signals to the sensitivity of trend analysis to the varying database. Trends in fire activity have also been variable among both regions and subregions within them. We found a clear decreasing trend at EUMED (for the three variables and both at large and medium scales), consistent with other studies (San-Miguel-Ayanz et al 2013). By contrast, in PWUSA, trends in fires were generally not significant, except in some subregions. While a number of studies have found an increase in number of fires and the area burned (Keeley et al 1999) and in the frequency of large fires in the Western USA (Dennison et al 2014), the different periods used and the fact that our data only considered national forests can explain these apparent contradictions.
Despite contrasted trends in both regions, we found significant fire–climate relationships across scales and for the various fire variables. Relationships were detected at the smaller scale investigated, but the R2 of the relationships generally increased with a growing area of study. We argue that the variability of fire and climate data becomes attenuated as the level of aggregation increases, hence allowing the relationship to emerge more clearly. Aggregating areas has shortcomings since it is possible that trends in the areas aggregated at a higher level might differ from one another, and what is true at the larger level may not necessarily apply at a lower level of aggregation (Parisien et al 2011). Therefore, each level of aggregation needs to be evaluated on its own.
Our results also document that, in general, the goodness of fit of the models (the R2) tended to decrease across areas within a region for some fire variables (i.e., number of fires and area burned) and at certain scales. The pattern was such that followed a climatic gradient, suggesting that areas with lower long-term mean FWI (i.e., milder climatic conditions during the summer) were more responsive to year-to-year changes in climate than those with higher values (i.e., more severe climatic conditions during summer). Similar results have been reported by other authors in both regions (e.g., Vázquez and Moreno 1995, Trouet et al 2009, Dimitrakopoulos et al 2011). Even if the patterns across the climatic gradient were weak (e.g., not all variables, not all scales), this is partially consistent with the fuels-moisture limitations hypothesis (Pausas and Ribeiro 2013, Parks et al 2014). The net result is reduced predictability at the more severe end of the gradient. A saturating performance of FWI index in the upper end of its spectrum of values could also play a role, but that needs further investigation.
The fire–climate relationships that emerged were rather similar, even if weaker in PWUSA at medium scale, and particularly for area burned at the largest scale. While both regions are to a certain degree comparable, the fact that we have covered a wider longitudinal gradient in EUMED (with all fires) and greater latitudinal gradient in PWUSA (only national forest fires) could account for some of the differences. At EUMED we explored more areas that are not that extreme, so the models performed better. The greater latitudinal gradient in PWUSA implies that we covered areas with substantial differences in climate. Several studies have pointed the differential impact of climate on fires across the western US (Gedalof et al 2005, Littell et al 2009, Stavros et al 2014) and between forested and non-forested landscapes (Abatzoglou and Kolden 2013, Keeley and Syphard 2015). Large scale atmospheric circulation patterns exhibit a pivot point in California, shifting south or north on decadal time-scales that may cause changes in the spatial association of climatic variations and fire activity (Westerling and Swetnam 2003, Trouet et al 2006). The longer fire season in southern California, and hence more diverse set of atmospheric drivers, in addition to increased human ignitions compared to the northwest (Miller et al 2012), likely contributes to weaken climate–fire linkages (Trouet et al 2009, Abatzoglou and Kolden 2013). Moreover, the significant role of local conditions such as Santa Ana winds in area burned in southern California (Keeley and Zedler 2009, Moritz et al 2010, Jin et al 2014), but not in northern California and Oregon, is causing a much greater inter-annual variability that was not fully accounted for in our models.
Determining the influence of variability and change in climate on fires in the past is important for projecting future climate change impacts (Bowman et al 2014, Moritz et al 2014). Nonetheless, attributing changes in fires to climate is difficult due to role of confounding factors that affect fire–climate relationships (Cramer et al 2014). When using long-term data series for the analysis of climate–fire relationships, studies should use proper analytical procedures or consider the role of other fire-drivers (fuels, landscape, fire management, etc) (Littell et al 2009). Relating year-to-year changes in fires to similar changes in the climate-related variables permits arguing that, in such a short period of time and at the spatial scales investigated here, climate with its underlying weather is the main variable that could significantly change. If at the smaller scale it is still conceivable that certain changes from one year to the next could meaningfully affect this relationship (Miller et al 2009, Brotons et al 2013, Price et al 2015), it is most unlikely that significant changes would affect the relationship at the largest scale investigated. For instance, landscapes are dynamic through time, but significant changes in landscape hazard from year to year due to human activities are unlikely. Similar temporal framing can be assumed for other drivers, like changes in ignitions patterns or on fire management, which may take years to unfold. While the effect of the other drivers is difficult to quantify, on such a small temporal window it can be assumed to be much smaller than that of weather/climate. Actually, this implicit assumption is used by the fire services, whose alerts use a scale of indices that only change due to weather, despite trends through time in other non-climate variables affecting fires.
While extrapolating these relationships to a future with more severe regional conditions due to global warming (Westerling et al 2011, Bedia et al 2014) must be made with caution, it would signal to a clear impact of climate change on fires, at least before changes in fires or other drivers can significantly affect current landscapes and vegetation. Our findings are important in a context of forecasting large scale climate patterns (Quesada et al 2012), as a basis to anticipate fire-seasonal severity. Since the range of FWI studied is quite large, this supports arguing that in some areas an increase in average FWI in the next decades or so, as a consequence of climate change, can result in increased fire activity. Our results also suggest that as the climate becomes more severe due to global warming, fires in these regions are likely to become less predictable, a finding that can have important implications for future fire prevention and planning.
5. Conclusion
Fire activity in EUMED and PWUSA at the three scales investigated was largely explained by within seasonal climate and, in a much lesser extent, by antecedent 3 to 8 months water-balance climatic conditions. Mean seasonal FWI was the most important variable, whereas antecedent water-balance did not contribute much to the models, except in a few areas. In any case, when they did, negative water-balance (i.e., drought) in the antecedent 8 months was more important, and contributed to increase fire activity. Despite differences among the two regions in land-use history, management and type of territory used (whole territory at EUMED, only national forests at PWUSA), the relationships were similar in both regions, albeit weaker, notably for area burned at the whole region level, in PWUSA probably due to the wider latitudinal gradient covered. The relationships tended to increase with the area of aggregation. The rather large variance explained by some of the models indicates that large-scale seasonal forecast could help anticipating the fire season in the investigated areas. The R2 of the models for some fire-variables decreased in both regions as the long-term mean FWI of the area increased. That is, in areas with lower long-term mean FWI (i.e., less amenable conditions for fires), fires were more susceptible to change with climate variability across the years than in areas with higher long-term mean FWI values (i.e., more amenable to fires). Provided that this trend reflects varied sensitivity to climate under more severe conditions, that would imply a reduced predictability of fire risk with climate change and consequent increases in mean seasonal FWI.
Acknowledgments
We thank Sixto Herrera for his assistance in climate data downloading and pre-processing. We acknowledge the helpful feedback from Julie Yee, Steve Cumming, and two anonymous reviewers to previous versions of the manuscript. This research was funded by the European Union's Seventh Framework Programme (FP7/2007-2013) under grant agreement 243888 (FUME Project). Publication in Open Access was funded by the EC FP7 Post-Grant Access Pilot. Any use of trade, product or firm names is for descriptive purposes only and does not imply endorsement by the U.S. government.