

Abstract
Objective. Repetitive transcranial magnetic stimulation (rTMS) emerges as a useful therapy for autism spectrum disorder (ASD) clinically. Whereas the mechanisms of action of rTMS on ASD are not fully understood, and no biomarkers until now are available to reliably predict the follow-up rTMS efficacy in clinical practice. Approach. In the current work, the temporal variability was investigated in resting-state electroencephalogram of ASD patients, and the nonlinear complexity of related time-varying networks was accordingly evaluated by fuzzy entropy. Main results. The results showed the hyper-variability in the resting-state networks of ASD patients, while three week rTMS treatment alleviates the hyper fluctuations occurring in the frontal-parietal and frontal-occipital connectivity and further contributes to the ameliorative ASD symptoms. In addition, the changes in variability network properties are closely correlated with clinical scores, which further serve as potential predictors to reliably track the long-term rTMS efficacy for ASD. Significance. The findings consistently demonstrated that the temporal variability of time-varying networks of ASD patients could be modulated by rTMS, and related variability properties also help predict follow-up rTMS efficacy, which provides the potential for formulating individualized treatment strategies for ASD (ChiCTR2000033586).
Export citation and abstract BibTeX RIS
1. Introduction
As a neurodevelopmental disease, autism spectrum disorder (ASD) is characterized by restricted, repetitive, and stereotyped behaviors, as well as lifelong impairment of social communication and interaction (Lord et al 2018). When investigating the pathophysiology of ASD, recent studies have emphasized the abnormal excitation/inhibition ratio and specific circuit-level dysfunctions (Casanova et al 2003, Ameis and Catani 2015). In fact, the pathophysiology of ASD may not be confined to dysfunctions in certain brain areas, but rather disruptions of the integration and functioning of long-range neural circuits, such as the underconnectivity of fronto-parietal and fronto-occipital interactions (Cherkassky et al 2006).
As an efficacious and safe intervention technology for non-invasive neuromodulation, repetitive transcranial magnetic stimulation (rTMS) has been usually used to promote the excitability of underactive cortical areas and related sub-networks. Recently, rTMS is extensively applied as a therapeutic intervention for diverse psychiatric and neurological diseases (Kobayashi and Pascual-Leone 2003) including Alzheimer's disease (Freitas et al 2011) and major depressive disorder (Gaynes et al 2014). Concurrently, its efficacy on ASD has also been suggested (Di Martino et al 2009, Casanova et al 2012, Enticott et al 2014, Panerai et al 2014, Sokhadze et al 2014), which helps relieve specific clinical symptoms (Oberman et al 2016). And the influences of rTMS on cerebral activity can sustain and modulate cognitive processes long beyond the duration of the intervention itself (Kobayashi and Pascual-Leone 2003). Although preliminary data suggest potential promise, the mechanisms by which rTMS modulate these physiologically aberrant indices to improve cognitive functions or behaviors are still scarcely revealed. In addition, more than half of patients do not make follow-up visits clinically, leading them to fail to receive additional clinical evaluations (Simon et al 2001). As illustrated, the efficacy of rTMS shows a remarkable variability (Rocchi et al 2018) that is still largely unpredictable, consequently, the effect of rTMS cannot be identified before or during the initial treatment. Hence, uncovering robust predictors will be of great significance for assisting in clinical practice to predict the long-term treatment response of ASD to rTMS.
Even at rest, the human brain still operates as a dynamic complex system, in which higher-level cognitive processes are usually attributed to the configurations of inter-regional synchronized activity (Raichle et al 2001, Portnova et al 2020). The dynamic fluctuation and variability characteristics of resting-state networks have also become hotspots in recent years. Thereinto, the temporal variability analysis, which can help assess the fluctuating interregional connectivity across time windows, has emerged as a critical approach to identifying the dynamic reconfiguration of associated regions into coupled modules over time (Zhang et al 2016). Recently, the potential temporal variability has been proved to be related to specific higher-level cognitive processes and mental diseases (Zhang et al 2016, Rolls et al 2021). Electroencephalogram (EEG), measuring neurophysiological fluctuations of postsynaptic activity of the cerebral cortex, is of great significance for studying complex brain diseases (Coben 2009, Ethridge et al 2012). For ASD, related resting-state EEG studies have reported widespread reductions in long-term couplings across the frontal and posterior areas (Murias et al 2007, Coben et al 2008, Barttfeld et al 2011, Duffy and Als 2012). And compared to behavioral measurements, EEG has been indicated to provide direct, objective, and sensitive indicators to evaluate the efficacy of rTMS on human cognition (Thut and Pascual-Leone 2010). In specific, high-frequency rTMS (HF-rTMS) could regulate the corresponding brain activities within varying rhythms, e.g. theta and alpha (Griškova et al 2007, Fuggetta et al 2008, Li et al 2017). Moreover, EEG has been adopted to investigate the regulation of rTMS on functional connectivity in ASD patients. For example, using continuous theta-burst rTMS, Shafi and colleagues observed attenuated resting-state functional connectivity of the high-beta and alpha bands (Shafi et al 2014). Together, rhythmic activity and resting-state network are thus believed to be effective tools to explore the efficacy and long-term aftereffects of rTMS on ASD. Although disorganized variability of time-varying networks had been revealed previously (Falahpour et al 2016, Chen et al 2017), few studies to date have investigated the mechanism of rTMS-induced rhythmic alterations from the perspective of temporal variability.
In the current work, adopting a previously proposed method of fuzzy entropy (Li et al 2021), we investigated the rhythmic fluctuating modes of resting-state networks over time to reveal the evidence accounting for the clinical improvement induced by rTMS for ASD patients. Afterwards, the potential relationships between the fluctuating properties and clinical scales were investigated, from which robust biomarkers were identified and multivariable linear models were further established to predict the long-term treatment response of rTMS intervention. Overall, exploring the rhythm-specific temporal fluctuations in resting-state networks is of great significance for exploring the neural mechanism of rTMS intervention on ASD, as well as for predicting the long-term efficacy of rTMS and formulating individualized treatment strategies.
2. Materials and methods
2.1. Participants
Under the approval of the Xuanwu Hospital Ethics Committee, 24 ASD children (3 females, aged 8.04 ± 3.54 years) and 24 sex-matched (Chi-square test, two-tailed; p = 0.084) and age-matched (independent sample t-test, two-tailed; p = 0.965) typical developing controls (TDs) (8 females, aged 8.00 ± 2.90 years) were recruited in our present experiment. The clinical evaluation of ASD was first conducted by experienced doctors according to the Diagnostic and Statistical Manual of Mental Disorders, Fifth Edition. None of the TD children had any history of ASD, neurological or psychiatric disease. Guardians of all children have read and understood the experimental protocols, and accordingly signed and provided written informed consent.
2.2. Experimental design
The previous study has proved that 15 treatments of HF-rTMS can improve the language- and social-related symptoms in ASD patients (Yang et al 2019). Meanwhile, for feasibility reasons, in this study, ASD patients were instructed to complete HF-rTMS intervention every consecutive weekday for three weeks (i.e. 15 treatments in total). Each intervention course included five 5 s trains at 15 Hz, with 10 min intertrain intervals (figure 1(a)). Given that ASD children are resistant to the sound and stimuli from the rTMS equipment, hence, we adopted a relatively short stimulating time 5 s and a relatively high frequency 15 Hz to guarantee enough amount of stimulation and intervention efficacy on ASD children (Ameis et al 2020), as well as avoid potential side effects, such as stroke and seizure (Wassermann 1998).
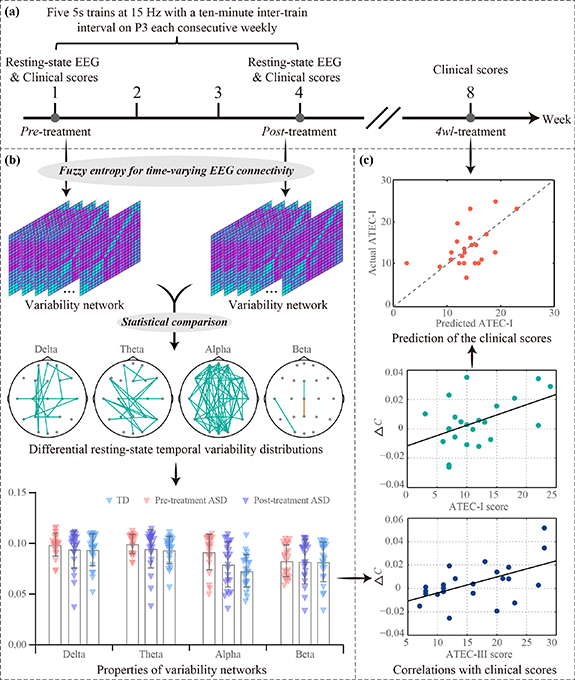
Figure 1. Analytical protocols. (a) The procedures of the rTMS experiment. (b) The temporal variability analysis. (c) The prediction of long-term rTMS efficacy on ASD.
Download figure:
Standard image High-resolution imageConcurrently, clinical evaluations were performed at three stages (figure 1(a)): immediately before the first HF-rTMS treatment ('pre-treatment'), immediately after the last HF-rTMS treatment ('post-treatment'), and four weeks after the last rTMS treatment ('4wl-treatment'). Within these stages, the clinical status of ASD children was assessed by adopting the Social Responsiveness Scale (SRS), Repetitive Behavior Scale-Revised (RBS-R), and Autism Treatment Evaluation Checklist (ATEC). Particularly, the ATEC (Rimland and Edelson 1999) includes four subtest scales: Scale I-Speech/Language/Communication (ATEC-I), Scale II-Sociability (ATEC-II), Scale III-Sensory/Cognitive awareness (ATEC-III), and Scale IV-Health/Physical/Behavior (ATEC-IV).
2.3. EEG data acquisition
In our present study, resting-state EEG was collected at the pre- and post-treatment stage, respectively (figure 1(a)). In detail, the EEG was recorded by an amplifier (Yunshen Ltd, Beijing, China) with 21 Ag/AgCl electrodes (the 10–20 system). The AFz and nasal tip electrodes were adopted as reference and ground, respectively. The impedance per electrode was maintained below 5 kΩ, and the online bandpass filtering parameter was 0.5–70 Hz, along with a sampling rate of 256 Hz.
2.4. EEG analysis
The analytical procedures for investigating the temporal variability between ASDs and TDs, as well as between pre- and post-treatment ASDs are briefly exhibited in figure 1, which included the rTMS experimental details (figure 1(a)), the temporal variability analysis (figure 1(b)), and the prediction of the long-term rTMS efficacy (figure 1(c)). Details of related sub-procedures are further described below.
2.4.1. EEG preprocessing
The EEG data were pre-processed following the standard procedures. Concretely, the raw EEG datasets were re-referenced to the 'zero' (Yao 2001) by using the reference electrode standardization technique toolbox (Dong et al 2017). Afterwards, independent component analysis (Cardoso 1997) was conducted, followed by [1, 4] Hz (delta), [4, 8] Hz (theta), [8, 13] Hz (alpha), and [13, 30] Hz (beta) offline band-pass filtering, respectively. Therein, one patient was excluded due to extensive head and body motion.
2.4.2. Dynamic resting-state networks
The time-resolved resting-state network within the delta (1–4 Hz), theta (4–8 Hz), alpha (8–13 Hz), and beta (13–30 Hz) bands were first constructed for both ASDs and TDs, respectively. Specifically, using a 20 s sliding-window approach with an overlapping of 98%, we constructed the time-varying networks with a 400 ms temporal resolution. Thereinto, for each segment, the phase-locking value (PLV) that can estimate the inter-regional phase synchronization (Sakkalis 2011) was adopted to assess the synchronized strengths (Li et al 2015, Zhang et al 2015).
Concretely, to estimate the instantaneous phases ϕu (t) and ϕv (t) of EEG signals u(t) and v(t), the analytical signal H(t) was first established by the Hilbert transform (HT), which can be expressed as:
where HTu (t) and HTv (t) denote the corresponding HT, which were formulated as:
where the P.V. indicates the Cauchy principal value.
Then, the analytical signal phases of ϕu (t) and ϕv (t) were calculated as:
Finally, the PLV was computed as:
where j and N denote the jth sample point and the sample number of each signal, respectively, t and Δt indicate the time point and the sampling period, and wPLV is the network connectivity weight.
2.4.3. Network complexity
Herein, fuzzy entropy was adopted to evaluate the network complexity of the time-varying resting-state networks (Li et al 2021). Specifically, supposing there are M networks per subject, the series of each network linkage Wi (1 ⩽ i ⩽ M) is defined as:
where  indicates q consecutive w values (i.e. PLV value) of the ith network, which can be deduced by excluding the baseline
  .
.
Given r, the similarity index  between
  and corresponding adjacency vector
  is defined as:

where  indicates the maximum absolute difference in the scalar components between
  and
and  .
.
For each vector  (i = 1, 2, ..., M−q + 1), by averaging all similarity degrees,
  , of its neighboring vectors
  , we then get
The FuzzEn(q, r) of the time series Wi (1 ⩽ i ⩽ M) is formulated as:

which can be estimated by the statistic,

where M is the length of the time series to be analyzed, r is the width of the boundary for similarity measurement, and q is the length of the compared window. As proved, a reasonable q will guarantee a more detailed reconstruction of the dynamic process, but an overlarge q might lead to information loss (Pincus and Goldberger 1994). Hence, following the previous study (Chen et al 2007), q was determined to be 2. In the meantime, a rather small r brings the noise, but too large r also results in information loss (Chen et al 2007). Therefore, following previous studies (Li et al 2021, Jiang et al 2022b), r is set to 0.2 multiplied by the standard deviation of the time series.
For each edge, its temporal variability was quantified, forming the variability network per child. Thereafter, we obtained the network topology variability by grand-averaging the variability networks across participants, and a threshold strategy was then adopted to detect the fluctuating temporal patterns in resting-state networks. Concerning this threshold, until now, there is still no standard to select an optimal one, since an overlarge threshold will have some suspicious linkages remaining, while a small one may lose important linkages. In previous studies, researchers have defined the 20% network edges with the largest fuzzy entropy as the flexible network organizations, which were indeed helpful for accurately classifying different groups and predicting cognitive performance (Li et al 2021, Jiang et al 2022b). Hence, following this strategy, a 20% threshold was adopted to capture flexible network organizations.
2.4.4. Network properties
After acquiring related networks, it has been well documented that network properties, which are regarded as lower-dimensional expressions of complex networks, can deepen our understanding of how these networks are structurally organized and how they generate complex dynamics (Bullmore and Sporns 2009, Rubinov and Sporns 2010, Jiang et al 2022a), as well as informing us on brain cognition and clinical disease. Consequently, to quantify the brain's potential for functional segregation and integration, as well as to reflect the efficiency of information processing in brain networks (Si et al 2019), four network metrics, i.e. characteristic path length (L), local efficiency (Le), global efficiency (Ge), and clustering coefficient (C), were calculated (Rubinov and Sporns 2010). Thereinto, the C is defined as the fraction of triangles around an individual network node. Le is the average efficiency of the local subgraphs. Both C and Le are related to the estimation of the potential for functional segregation between brain lobes and reflect the local information processing capacity of the brain networks,
In addition, Ge is the average efficiency of the related brain network and L is the mean value of the shortest path length between all pairs of network nodes. They are applied to estimate the potential for functional integration among brain areas and reflect the efficiency of global information processing in brain networks,
where dij is the weighted shortest path length between nodes i and j, θ denotes the set of all network nodes, N is the node number, and wij indicates the weighted connectivity strength between nodes i and j.
Herein, for each resting-state time-varying network, the four properties were calculated using the brain connectivity toolbox, forming the time-varying network properties that varied across time. Then, fuzzy entropy was also adopted to quantify the temporal variability of these properties, which reflected the fluctuating complexity in the properties' time series (Yu et al 2015).
2.4.5. Statistical analysis
Herein, to investigate the topologies and properties differences of the variability networks among the pre-treatment ASD, post-treatment ASD, and TD groups, two-way (i.e. Group × Band) repeated analysis of variance (ANOVA) were accordingly performed within these four bands. First, the normality of the data was verified using the Kolmogorov–Smirnov and the Shapiro–Wilk's W tests. For data in which the assumption of normality was not validated, their logarithmic transformations were calculated to meet the assumption of normal distribution (Van Albada and Robinson 2007, Sikka et al 2019). Mauchly's test was used to test the assumption of sphericity for repeated measures factor ANOVA, while Greenhouse–Geisser corrected significance values would be further used when sphericity was lacking (Meyers et al 2016). Thereafter, in case of significant main effects, post hoc comparisons were accomplished using the least significant difference (LSD) with adjustment for multiple comparisons.
2.4.6. Predicting the long-term after-effects of rTMS
Given follow-up assessments for ASD patients were also accomplished by clinical scales, we finally predicted the aftereffect of rTMS on ASD patients by developing credible biomarkers during the treatment stage. To achieve this, Pearson's correlation analyses were first applied to probe underlying correlations between clinical scores and network properties, whose results were further multiply corrected by the false discovery rate (FDR). Additionally, we assumed the fluctuations of the pre- and post-treatment network metrics (e.g. the ΔC, ΔGe, ΔLe, ΔL) may be proportional to the clinical scores at follow-up (i.e. the 4wl-treatment stage). Moreover, network properties within different bands reflect the varying spontaneous brain operations and functions (Steriade et al 1990), which can provide complementary and comprehensive information for further analysis. For example, using the properties of different brain rhythms, a previous study has successfully discriminated seizure events from normal brain operations (Quintero-Rincón et al 2016). Hence, in our present study, based on these network metrics in four bands, a stepwise multiple linear regression model was accordingly established to predict the clinical scores at the 4wl-treatment stage (CS4wl ).
Specifically, in the stepwise multiple linear regression (Schroeder et al 2016), features were selected in a stepwise manner to remove irrelevant or redundant characteristics and retain the relevant features until no further improvement in the model. Thereinto, in the iterative process, feature candidates in the feature space were added and removed in a multiple linear regression model and the statistical significance of the regression model was evaluated. The statistical significance is measured by the one-way analysis of the F-statistic with a probability level of <0.05. The stepwise procedure was stopped when no further variable of the data set met the criterion for entry in the model, or when the next variable to be entered was just removed. Meanwhile, the leave-one-out cross-validation strategy was applied to assess the prediction capability (Zeng et al 2012). In detail, for P participants, P − 1 participants were applied for training, while the remaining 1 participant was applied for testing. Then, for the current P− 1 participants, a prediction model was built by the estimated regression coefficient, which was further adapted to predict the clinical score of the remaining 1 participant. This process will repeat P times until the clinical scores of all participants were predicted.
Finally, the Pearson's correlation coefficients between the recorded and predicted scores were calculated to validate to which extent these predictors could predict the clinical assessments for ASD children. In the meantime, the root mean square error (RMSE) and normalized RMSE (NRMSE) (Xiang-Wei et al 2010) were further calculated to quantify the prediction error.

where Y denotes predicted clinical scores, X indicates the actual clinical scores, P denotes the number of participants, and  is the mean of the actual clinical scores.
3. Results
3.1. Clinical assessments underlying the rTMS intervention on ASD
To validate the effectiveness of rTMS intervention on ASD patients, clinical assessments, by using scales including the ATEC, SRS, and RBS-R, were performed at pre- and post-treatment stages, as well as at the follow-up stage (i.e. 4wl-treatment stage). As provided in table 1, significant differences in the majority of these scales (e.g. ATEC and RBS-R, etc) are reported (p < 0.05), as decreased scores were identified after a three-week rTMS intervention. Moreover, even four weeks after rTMS intervention, the ATEC, RSB-R, and SRS scales were also found to be decreased than that recorded before the rTMS intervention (p < 0.05).
Table 1. Demographic and clinical scales of ASD patients (n = 24).
| Pre-treatment | Post-treatment | 4wl-treatment | |
|---|---|---|---|
| Age (years) | 8.04 ± 3.54 | \ | \ |
| Sex (M/F) | 3/24 | \ | \ |
| SRS | 107.88 ± 21.3 | 100.67 ± 23.41* | 102.29 ± 23.33* |
| RBS-R | 25.63 ± 12.01 | 19.71 ± 11.8* | 20.96 ± 11.97* |
| ATEC | 69.67 ± 19.01 | 60.17 ± 20.31* | 64.46 ± 22.57* |
| ATEC subscale score | |||
| ATEC-I | 12.13 ± 5.29 | 10.29 ± 5.8* | 11.58 ± 5.41 |
| ATEC-II | 20.88 ± 5.59 | 16.92 ± 7.86* | 17.79 ± 8.56* |
| ATEC- III | 17 ± 5.63 | 15.54 ± 6.78 | 16.42 ± 6.61 |
| ATEC-IV | 19.67 ± 8.71 | 17.42 ± 6.08* | 18.67 ± 8.86 |
Notes: * Significantly different from the pre-treatment stage by paired-sample t-test (p < 0.05).
Additionally, to quantify the fluctuations of clinical symptoms, the relative change ratio (RCR) from the pre- to the post-treatment stage, and from the pre- to the 4wl-treatment stage was further calculated for patients with ASD. Herein, the RCR was defined as a ratio of the clinical scale difference between post- (4wl-) and pre-treatment stages versus that of the pre-treatment stage. Since smaller scores suggest the remission of clinical symptoms, a negative RCR thus indicates the effectiveness of rTMS intervention on ASD patients. Concretely, just as depicted in table 2, a prominent improvement was consistently found, especially in RBS-R and ATEC-II scales, after the rTMS treatment, even after one month.
Table 2. RCR of clinical scores induced by the rTMS intervention (n = 24).
| SRS | RBS-R | ATEC | ATEC-I | ATEC-II | ATEC-III | ATEC-IV | |
|---|---|---|---|---|---|---|---|
| RCR(Pre-Post) | −6.68%* | −23.09%* | −13.64%* | −15.12%* | −18.96%* | −8.58% | −11.44%* |
| RCR(Pre-4wl) | −5.18%* | −18.21%* | −7.48%* | −4.47% | −14.77%* | −3.43% | −5.08% |
Notes: * Significantly different from the pre-treatment stage by paired-sample t-test (p < 0.05).Abbreviations: RCR(Pre-Post), RCR of clinical scores from pre- to post-treatment stage; RCR(Pre-4wl), RCR of clinical scores from pre- to the 4wl-treatment stage.
3.2. Different temporal variability distributions
In addition to the improvement of clinical manifestation, by performing the brain network analysis, the temporal variability patterns and the corresponding topological differences between the ASDs and TDs, as well as between the pre- and post-treatment ASDs, were investigated in four frequency bands, to explore the pathomechanism of ASD and to validate the efficacy of the rTMS intervention on ASD patients. Here, figure 2(a) presents the distinct topologies underlying network variability between pre-treatment ASD patients and TDs within four concerned bands revealed by two-way repeated ANOVAs, where the green solid line presents stronger connectivity of ASDs than that of TDs. Specifically, in comparison with TDs, the stronger long-range variability connectivity spanning the distributed frontal and posterior lobes was found for pre-treatment ASDs, especially within the theta and alpha bands (figure 2(a)). Of note, in contrast to pre-treatment ASDs, after three week rTMS treatments, patients experienced reduced temporal variability in the long-range frontal-parietal and frontal-occipital linkages within the theta and alpha bands (figure 2(b)). And as expected, no differences were revealed between post-treatment ASDs and TDs in all bands (figure 2(c)), coinciding with the clinical improvements in ASD children induced by rTMS intervention. Besides, the network differences under distinct data lengths (e.g. 10 s and 30 s) show similar patterns as that under the 20 s, which consistently demonstrates the reliability of the reported topology patterns under the 20 s data length.
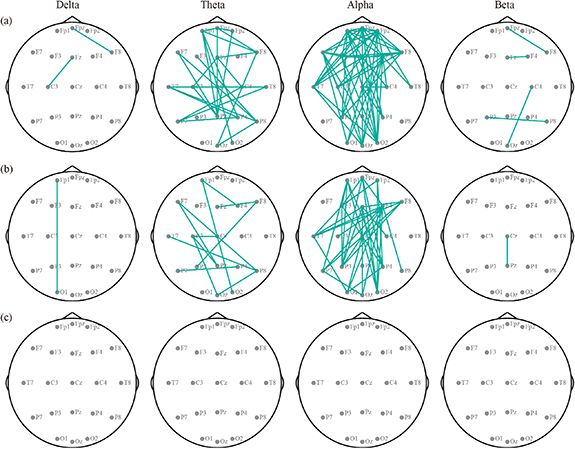
Figure 2. Differential temporal variability distributions of resting-state EEG networks in four bands. (a) Pre-treatment ASDs vs. TDs. (b) Pre- vs. post-treatment ASDs. (c) Post-treatment ASDs vs. TDs. Green-solid lines represent the stronger network variability of the ASDs than TDs, and of the pre- than post-treatment ASDs.
Download figure:
Standard image High-resolution imageIn this study, for each participant group and within each band, the flexible network architectures were also evaluated. For visualization, the flexible patterns and the scalp distributions of the nodal degree within the alpha band were depicted in figure 3, and that of other bands was provided in figures S1–S3 of supplementary result 1. Figure 3(a) exhibits the 20% edges that had the largest (i.e. flexible) fuzzy entropies for TDs, pre-, and post-treatment ASD children separately, in which the flexible architecture of TDs spanning the extensive posterior regions consists of the parietal, temporal, and occipital lobes (the third column of figure 3(a)). However, for the pre-treatment ASDs, we observed widespread medium-range linkages across the whole brain in the first column of figure 3(a). Interestingly, after a three-week rTMS intervention, the flexible couplings in the anterior regions of the post-treatment ASDs were attenuated (the second column of figure 3(a)) and gradually restored to a spatial pattern similar to the TDs. Accordingly, the scalp distributions of the nodal degree in figure 3(b) exhibited that, the posterior regions of the flexible network were highlighted by a larger nodal degree for post-treatment ASDs and TDs, while that of the pre-treatment ASDs was characterized by brain-wide temporal fluctuations. Besides, the flexible network under different thresholds (e.g. 10%, 15%, 25%, and 30%) also shows similar patterns as that under the 20% threshold, which consistently demonstrates the reliability of the reported flexible network patterns under the 20% threshold.

Figure 3. Flexible patterns of the TDs and ASD patients in the alpha band. (a) Flexible architecture. The red solid line represents flexible connectivity. (b) Nodal degree distribution.
Download figure:
Standard image High-resolution image3.3. Different resting-state network properties
To further quantify the clinical remissions of ASDs after rTMS treatment, figure 4 shows the properties underlying variability networks for both ASDs and TDs in all bands. Two-way repeated ANOVA showed that there were main effects of group (C: F = 3.873, p= 0.026; L: F = 6.153, p= 0.004; Ge: F = 4.536, p= 0.014; Le: F = 3.985, p= 0.023) and band (C: F = 30.385, p< 0.001; L: F = 26.068, p< 0.001; Ge: F = 29.681, p< 0.001; Le: F = 30.438, p < 0.001) for these network properties. Meanwhile, significant interactions between the factors group and band were also identified for C (F = 13.444, p< 0.001), L (F = 24.820, p< 0.001), Ge (F = 17.172, p= 0.001), and Le (F = 14.115, p< 0.001), respectively. Moreover, when post-hoc exploring the potential differences in pairwise groups using LSD correction, figure 4 displays the significantly decreased C, Ge, and Le, as well as a longer L, in TDs and post-treatment ASDs deviating from the pre-treatment ASDs in the alpha band (p < 0.05). No significant differences were identified in the delta, theta, and beta bands (p > 0.05).
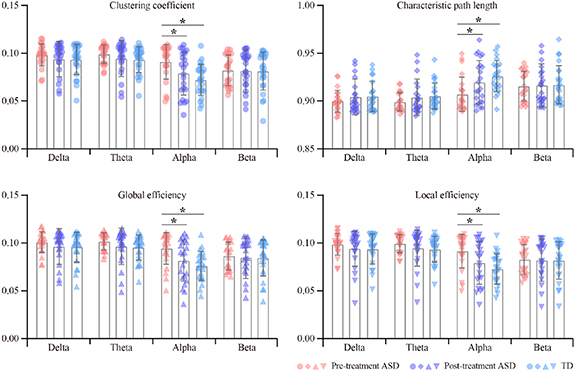
Figure 4. The variability network properties of ASDs and TDs in four EEG bands. The symbol * denotes p < 0.05.
Download figure:
Standard image High-resolution imageAdditionally, the RCR of variability network properties between the pre-/post-treatment ASDs and TDs and between the pre- and post-treatment ASDs was also calculated, which consistently showed that the temporal fluctuation of resting-state network properties experienced prominent suppression after rTMS intervention, especially within the alpha band (table 3).
Table 3. RCR of network properties in different treatment stages.
| Frequency band | Properties | Pre-treatment ASDs vs. TDs | Pre- vs. post-treatment ASDs | Post-treatment ASDs vs. TDs |
|---|---|---|---|---|
| Delta | C | −4.89% | −4.45% | −0.46% |
| L | 0.57% | 0.50% | 0.07% | |
| Ge | −5.33% | −4.64% | −0.72% | |
| Le | −5.00% | −4.52% | −0.50% | |
| Theta | C | −5.94% | −4.63% | −1.37% |
| L | 0.68% | 0.54% | 0.14% | |
| Ge | −6.18% | −5.02% | −1.23% | |
| Le | −5.99% | −4.73% | −1.32% | |
| Alpha | C | −20.88%* | −13.39%* | −8.64% |
| L | 2.10%* | 1.39%* | 0.70% | |
| Ge | −19.32%* | −13.56%* | −6.66% | |
| Le | −20.44%* | −13.43%* | −8.10% | |
| Beta | C | −0.96% | −0.56% | −0.40% |
| L | 0.15% | 0.10% | 0.05% | |
| Ge | −2.30% | −1.86% | −0.44% | |
| Le | −1.30% | −0.90% | −0.39% |
Notes: * Significantly different from the pre-treatment stage (p < 0.05).
3.4. Prediction of the aftereffect of rTMS by network properties
Given the large individual variability of rTMS efficacy, predicting the long-term aftereffects of rTMS treatment is critical for developing personalized clinical protocols. Hence, the underlying relationships between the alterations in variability network properties (ΔC = Cpre−Cpost) concerning the rTMS treatment and clinical scales at the 4wl-treatment stage (e.g. ATEC-I4wl ) were first statistically explored to identify robust biomarkers for predicting the aftereffect of rTMS for the ASD. As provided in figure 5, within the delta and alpha bands (figures 5(a) and (c)), ΔC, ΔGe, and ΔLe were positively correlated with the ATEC-I4wl score, while ΔL was negatively correlated with the ATEC-I4wl score (pFDR < 0.5). In terms of the theta band (figure 5(b)), the ΔC, ΔGe, and ΔLe were observed to be significantly positively associated with ATEC-III4wl score, while ΔL shows a negative correlation (pFDR < 0.5).
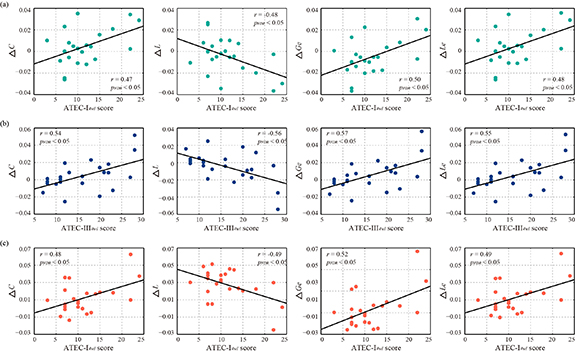
Figure 5. Correlations between the alterations in variability network properties and clinical scores at the 4wl-treatment stage for ASDs patients. (a) Correlations in the delta band. (b) Correlations in the theta band. (c) Correlations in the alpha band.
Download figure:
Standard image High-resolution imageConsidering the promotion in network properties (e.g. the promotion of C in the delta band, which is termed as ΔCdelta) was highly correlated with the specific clinical scales at the 4wl-treatment stage, prediction of the long-term aftereffect of rTMS intervention for ASD patients was further explored. Herein, the corresponding prediction model of each clinical score is formulated as,
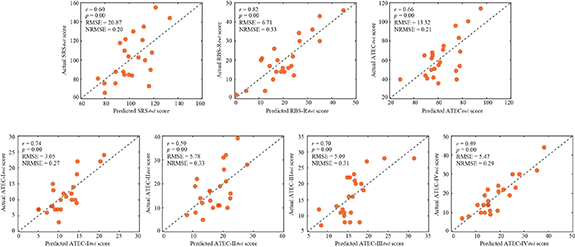
Thereafter, the predicted and actual clinical scores of ASD patients at the 4wl-treatment stage were found to be significantly correlated in figure 6. Concretely, the merged network properties within these four bands greatly contributed to the prediction of the SRS4wl (r = 0.60, p = 0.00, RMSE = 20.87, NRMSE = 0.20), RBS-R4wl (r = 0.82, p = 0.00, RMSE = 6.71, NRMSE = 0.33), and ATEC4wl scores (r = 0.66, p = 0.00, RMSE = 13.32, NRMSE = 0.21). And in terms of the four subtest scales of ATEC, related correlation coefficients were 0.74 for ATEC-I4wl (p = 0.00, RMSE = 3.05, NRMSE = 0.27), 0.59 for ATEC-II4wl (p = 0.00, RMSE = 5.78, NRMSE = 0.33), 0.70 for ATEC-III4wl (p = 0.00, RMSE = 5.09, NRMSE = 0.31), and 0.89 for ATEC-IV4wl (p = 0.00, RMSE = 5.47, NRMSE = 0.29), indicating a good prediction power.
Figure 6. Prediction of the clinical scores at the 4wl-treatment stage.
Download figure:
Standard image High-resolution image
4. Discussion
Resting-state network analyses have demonstrated brain-wide alterations in the inherent topographical organizations in ASD patients (Kennedy and Courchesne 2008, Hanaie et al 2018), and rTMS may ameliorate these abnormities (Di Martino et al 2009, Casanova et al 2012, Enticott et al 2014, Panerai et al 2014, Sokhadze et al 2014). However, the flexibility of resting-state networks in ASD and the mechanism underlying rTMS-evoked improvement in brain function have not been comprehensively investigated from the temporal variability perspective. Our work first demonstrated the ASD-specific fluctuations of variability network in pre-treatment patients, which may offer new insights into the rhythmic dynamics underlying related neuropathological profiles of this disease. Thereafter, we explored the alterations of network variability after a three week rTMS treatment and identified the potential biomarkers associated with the follow-up clinical score, which may contribute to the prediction of the long-term rTMS efficacy for ASD patients.
As a critical tool for characterizing the dynamical reconfigurations of a brain area into diverse functional modules, temporal variability can be regarded as an indicator of brain adaptability and flexibility (Zhang et al 2016). Given that ASD was characterized by cognitive 'inflexibility' (Van Eylen et al 2011, Uddin et al 2015), our findings coincided with this and further identified extensive rhythm-specific abnormities in the temporal variability of related long-range frontal-parietal and frontal-occipital connectivity, particularly within the theta and alpha bands. In this regard, plentiful researchers have identified widespread distributed network disintegration in ASD patients (Murias et al 2007, Fogelson and Diaz-Brage 2021), particularly the long-range interregional connectivity mediated by theta and alpha oscillations (Uhlhaas and Singer 2007). The underconnectivity in ASD might be driven by greater variability across time (Falahpour et al 2016), which is also aligned with the greater variance and standard deviation in dynamic network architecture (Falahpour et al 2016, Chen et al 2017). In particular, previous studies have reported reduced resting-state connectivity across the default mode network (Kennedy and Courchesne 2008), which coincided with the high variability across related frontal, temporal, and parietal regions in figure 2(a). Of note, high variability suggests low functionality, implying the disturbed self-referential mind processing, retrieving and manipulating memories, etc (Greicius et al 2003, Kennedy et al 2006, Garrity et al 2007), and may thus lead to the failure of ASD patients in performing some necessary social processes, such as mentalizing (Li et al 2020).
The efficacy of the three week intervention was then studied by identical dynamic functional connectivity and fuzzy entropy analyses. Strikingly, deviating from the pre-treatment stage, for ASD patients, the fluctuating long-range linkages were attenuated, after receiving a three week rTMS treatment, especially for the alpha band. Generally, the resting-state activity is usually characterized by the dominated alpha oscillation (Si et al 2019), which has served as a reliable marker of the individual's state of arousal and attention and is associated with various cognitive features such as working memory capacity (Clark and Veltmeyer 2004), information processing speed (Klimesch 1996) and inhibition (Klimesch 2012). In the meantime, previous studies also demonstrated that inhibitory GABAergic interneurons drive synchrony in alpha oscillation (Schreckenberger et al 2004, Lőrincz et al 2009, Lozano-Soldevilla et al 2014). Given that excitatory-inhibitory neural imbalance that involves reduced GABAergic inhibition might correlate with the pathophysiology of ASD (Coghlan et al 2012), alpha may thereby be more sensitive to the disease courses of ASD. Furthermore, compared to that of TDs, the network variability of post-treatment for ASD patients exhibits similar topological patterns, explaining the seldom difference in figure 2(c). Given that HF-rTMS (⩾5 Hz) induces functional reorganization by promoting the excitability of related cortical regions (Pascual-Leone et al 1994, Maeda et al, 2000), the prominently suppressed alpha-variability in figure 2 confirmed the fact that the alpha functions were significantly increased after rTMS intervention (Anninos et al 2016), suggesting the clinical recovery in ASD patients (Kang et al 2019).
Subsequently, the flexible patterns underlying the network variability were further extracted, and a highly flexible architecture with extensive medium-range linkages distributed in posterior regions was consistently found in both the post-treatment ASD patients and TDs (second and third column of figure 3, respectively). However, highly flexible linkages spanning frontal areas were found for the pre-treatment ASDs (first column of figure 3), coinciding with previous reports of higher frontal fluctuation (Di Martino et al 2014) and hyper-variant connectivity (Chen et al 2017) in ASD patients. Together, the resting-state brain fluctuations captured by the temporal variability of time-varying networks were distorted in ASD patients, while these abnormalities can be alleviated by three week rTMS treatment. As such, after three week rTMS treatment, the clinical scores of ASD patients in tables 1 and 2 reduced, indicating a remission in the clinical symptoms. Meanwhile, these decreases in variability network topology and clinical scores were also quantitatively measured by the significantly decreased C, Ge, and Le as well as a longer L in the specific EEG rhythms (figure 4 and table 3). Namely, the functional segregation and integration represented by the four network properties were impaired in pre-treatment patients. Whereas, after three weeks of rTMS intervention, these functional impairments are demonstrated to be significantly improved, further validating the positive efficacy of rTMS on ASD patients from the functional segregation and integration perspective.
Given the temporal variability was validated to have the capacity to reflect the effectiveness of rTMS treatment on ASD, related network metrics (e.g. C, L, Ge, and Le) may be robust biomarkers for tracking the long-term aftereffect of transcranial magnetic stimulation (TMS) therapy. As expected, changes in the C, L, Ge, and Le, i.e. the ΔC, ΔGe, ΔLe, and ΔL, were indeed found to be significantly correlated with specific clinical scores at the 4wl-treatment stage (figure 5). There into, delta- and alpha-properties in figures 5(a) and (c) are found to be significantly related to ATEC-I scores that evaluate the functions of speech, language, and communication; while those of the theta band were associated with the ATEC-III scores that assess functions of the sensory and cognitive awareness (figure 5(b)). Namely, rTMS is a therapeutic tool capable of addressing specific core symptoms of patients with ASD, especially the abnormalities in language, communication, sensory, and cognitive awareness. Accordingly, the network properties were then utilized to predict the long-term treatment outcome of rTMS in ASDs, with the network property changes selected as the predictors of the treatment response at the 4wl-treatment stage. Figure 6 gives the scatterplots of the actual and predicted clinical scores for all of these ASD patients, where the revealed significantly positive relationship did validate the reliability of variability network properties in promoting personalized treatment strategies.
One potential limitation of this study was the conventional network properties that were used to quantify the variability networks, in the future, new high-order network parameters will be developed and extracted to further measure the variability networks, which are also expected to provide constructive evidence for deepening our knowledge of ASD, particularly related brain fluctuations under the physical TMS intervention.
5. Conclusion
In summary, this study performed the dynamic network fuzzy entropy analyses, to examine the efficacy of rTMS on ASD from the temporal variability perspective. The differentiable topologies between pre- and post-treatment ASD, as well as TDs, reveal the hyper-variability in the resting-state network of ASD patients; concurrently, rTMS can alleviate these excessive fluctuations, contributing to ameliorative ASD-related symptoms. Besides, by performing the correlation analysis, the variability in network properties was shown to significantly relate to clinical assessments, which further serve as predictors to track the aftereffect of rTMS intervention on ASD. Together, the findings consistently clarified that the temporal variability of related time-varying EEG networks can track the efficacy of rTMS therapy and help predict the long-term outcome, suggesting a new bridge for dynamically adjusting the personalized treatment strategy for ASD patients.
Data availability statement
The data that support the findings of this study are available upon reasonable request from the authors.
Acknowledgments
This work was supported by the Project of Science and Technology Department of Sichuan Province (#2021YFSY0040, #2020ZYD013), the National Natural Science Foundation of China (#61961160705, #U19A2082, #62103085, #82102175, #81801124), the Science and Technology Development Fund, Macau SAR (File No. 0045/2019/AFJ), and the Scientific Research Foundation of Sichuan Provincial People's Hospital (2021LY21).
Conflict of interest
The authors declare that they have no conflict of interest.
Supplementary data (2.3 MB DOCX)