

Abstract
One challenge for PET-MR hybrid imaging is the correction for attenuation of the 511 keV annihilation radiation by the required RF transmit and/or RF receive coils. Although there are strategies for building PET transparent Tx/Rx coils, such optimised coils still cause significant attenuation of the annihilation radiation leading to artefacts and biases in the reconstructed activity concentrations. We present a straightforward method to measure the attenuation of Tx/Rx coils in simultaneous MR-PET imaging based on the natural 176Lu background contained in the scintillator of the PET detector without the requirement of an external CT scanner or PET scanner with transmission source. The method was evaluated on a prototype 3T MR-BrainPET produced by Siemens Healthcare GmbH, both with phantom studies and with true emission images from patient/volunteer examinations. Furthermore, the count rate stability of the PET scanner and the x-ray properties of the Tx/Rx head coil were investigated. Even without energy extrapolation from the two dominant γ energies of 176Lu to 511 keV, the presented method for attenuation correction, based on the measurement of 176Lu background attenuation, shows slightly better performance than the coil attenuation correction currently used. The coil attenuation correction currently used is based on an external transmission scan with rotating 68Ge sources acquired on a Siemens ECAT HR + PET scanner. However, the main advantage of the presented approach is its straightforwardness and ready availability without the need for additional accessories.
Export citation and abstract BibTeX RIS
1. Introduction
One challenge for MR-PET hybrid imaging is the correction for attenuation of the 511 keV annihilation radiation by the required RF transmit and/or RF receive coils (Tx/Rx coils) (Zaidi 2016). During the last decade of research on compatible PET and MR instrumentation, the development of MR silent scintillation detectors and PET systems has been the most prominent area of interest (Catana et al 2006, Herzog et al 2010, Zaidi and Guerra 2011, Delso et al 2011, Weissler et al 2014, 2015, Olcott et al 2015, Levin et al 2016, Herzog and Lerche 2016). However, considerably less effort has been made to design PET transparent Tx/Rx coils. Most of these coils are primarily optimised for excellent MR image quality while their impact on the PET image is handled by implementing a correction that compensates the γ-ray attenuation caused by the coil (Eldib et al 2016). Simultaneous MR-PET imaging without attenuation correction (AC) for the Tx/Rx coil leads to streak artefacts in the PET image, global and regional under- or overestimation in the reconstructed activity concentrations, and decreased SUV values (Delso et al 2010, MacDonald et al 2011, Fürst et al 2014). The magnitude of these effects depends significantly on the geometry and the material of the used Tx/Rx coil. Strategies for building PET transparent Tx/Rx coils include placement of highly absorbing electrical components, such as soldered capacitors and inductors, outside the PET field of view (FOV) and the careful selection of supporting material for the Tx/Rx coil. Further possibilities are using conductive glue as a replacement for soldering, minimising the thickness of conductors and the supporting coil structure inside the PET FOV, and integrating the MRI coil into the PET system (Herrick et al 2010, Stark et al 2010, Dregely et al 2015, Sander et al 2015, Parl et al 2017). Evaluation of the attenuation properties of these PET optimised Tx/Rx coils revealed that artefacts and overall loss in γ-photon counts were still observed when these coils were used without any coil AC (Sander et al 2015). Therefore, even when PET optimised Tx/Rx coils are available, they are not likely to be completely transparent to the γ-photons. Moreover, Tx/Rx coil design rules for optimum MR imaging, such as the placement and size of electronic components or the amount and thickness of conductors and of the supporting structure, are often in conflict with requirements for optimised PET imaging. Consequently, AC of the Tx/Rx coils is not negligible, and is, in most cases, necessary.
Strategies for AC of the Tx/Rx coils differ greatly from the strategies used for attenuation correction of the imaged object because the Tx/Rx coils are, in general, neither visible in the MR image4 nor in the PET image. Furthermore, attenuation in the patients is dependent on the object and is different for each examination, while MR scans are generally done with one coil from a limited set of available coils. In comparable clinical or research studies, the same Tx/Rx coil is always used, therefore always leading to the same attenuation by the coil. Thus, it is possible to prepare a single AC map for each coil once and use it for all examinations. This is especially straightforward for rigid coils with a known and reproducible position inside the MR-PET FOV, e.g. the body coil, head coils and spine matrix coils (Eldib et al 2016). Most often, the AC map of the coil is either computed from CT images (Zhang et al 2009, Catana et al 2010) or from transmission images acquired with a PET scanner with an integrated, rotating, transmission source (Wagenknecht et al 2013). The generation of coil AC maps from computer-aided design files has also been reported (Eldib et al 2012a). Coil AC maps derived from CT or γ-ray transmission data have drawbacks and lead to systematic errors in the reconstructed attenuation corrected PET image. In addition, for surface and flexible coils, it is necessary to localise the Tx/Rx coil either with markers, ultra short echo time MR sequences, or cameras (Paulus et al 2012, Eldib et al 2015, Frohwein et al 2018).
If no dedicated PET transmission source, such as a rotating line source, sheet sources or similar (see Mollet et al (2014)), is installed in the MR-PET device, it is necessary to acquire the Tx/Rx coil AC template on a different system. However, this can lead to a mismatch of the radiation energy, requiring an extrapolation of the attenuation coefficient (Stark et al 2010), and/or to a mismatch of the spatial resolution of both PET systems involved (Wagenknecht et al 2013). In either case, the correct alignment of the AC map for PET image reconstruction is critical and difficult because the Tx/Rx coil is generally not visible in either the MR image nor in the PET image. However, exact positioning within a range of very few millimetres is required for artefact free PET images (Catana et al 2010). Installation of a PET transmission source inside the MR-PET FOV, as suggested in Mollet et al (2014), would require considerable technical and financial commitment as special design constraints are imposed by MR compatibility and either additional calibration sources or additional radiopharmaceutical would have to be purchased regularly. In this publication we suggest using the intrinsic activity of the PET scintillator as an alternative for generating the AC maps of fixed, rigid Tx/Rx coils such as fixed spine array coils and head coils.
Most modern PET scanners use LSO or LYSO crystals as scintillator, which naturally contain a small fraction of the radioactive isotope Lutetium 176Lu (Melcher and Schweitzer 1992, Yamamoto et al 2005). The feasibility of using the natural intrinsic LSO activity for object AC was shown by Rothfuss et al (2014). We examined this approach for the generation of AC maps or attenuation correction factors (ACF) (Kaltsas et al 2015) for the head Tx/Rx coil of a 3T MR-BrainPET produced by Siemens Healthcare GmbH (Herzog et al 2011).
2. Materials and methods
The Lutetium isotope 176Lu has a half-life of  years (e.g. Kossert et al (2013)) and decays predominantly via
  decay with a maximum
  -energy of 596 keV followed by three prompt γ-photons with energies of 306.78 kev, 201.83 keV, and 88.34 keV and abundances of 94%, 86%, and 13.3%, respectively. The decay scheme is shown in figure 1, left. The
  -particle will be stopped in the same scintillation crystal where the decay takes place, since the range of β particles in solids is very short. However, the prompt γ-photons can escape from the scintillation crystal and can evoke additional scintillation events in other detector modules of the scanner (figure 1, right). Since the energy, the abundance, and the escape probability of the 88 keV prompt γ-photon is very low, three main types of coincidences, with corresponding lines of responses (LOR), will be observable if the energy acceptance window is sufficiently large: coincidence between
  and 307 keV γ, coincidence between
  and 202 keV γ, and triple coincidence between
  , 307 keV γ, and 202 keV γ. Along their paths, the γ-photons will be attenuated according to the Beer-Lambert law

where I0 is the γ-beam intensity at the begin of the LOR, I is the intensity γ-beam intensity at the end of the LOR, and  is the linear γ-ray attenuation coefficient along the LOR. Due to this attenuation, the measured coincidence counts in PET have to be corrected:

where IEmitted is the intensity of the γ-beam before attenuation, IMeasured is the intensity of the γ-beam after attenuation and ACF is the attenuation correction factor defined by

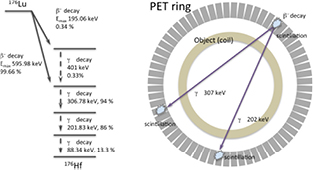
Figure 1. Left: decay scheme of 176Lu. Right: most probable coincidences from 176Lu in the MR-BrainPET scanner.
Download figure:
Standard image High-resolution imageThe ACF can be estimated by computing the ratios of the detected counts, I for each LOR of a transmission scan with the object (I, object scan) and the detected counts I0 for each LOR of a transmission scan without the object (I0, blank scan) (Ostertag et al 1989). Note that normalisation factors, which in general are gamma energy dependent, will cancel out by definition of the ACFs. Taking into account that the ACFs depend on the γ-photon energy and that their attenuation in air can be neglected, the ACFs for the Tx/Rx coil can be written as

where d is the length of the γ-ray traversing the Tx/Rx coil and  is the average linear attenuation coefficient of the coil material at energy
  , assuming that the coil consists of a single homogeneous material. As will be shown later, this approximation can be made for the purpose of this study.
Based on the work of Rothfuss et al we developed an AC method using 176Lu background radiation for the MR compatible BrainPET insert for a clinical 3T magnetom Trio MR produced by Siemens Healthcare GmbH (figure 2, left). The insert consists of 32 copper shielded detector cassettes with an inner diameter of 36 cm and 19.2 cm axial FOV. Each cassette contains 6 scintillation detector blocks built with 12 × 12 LSO crystals of 2.5 mm pitch in both directions and 20 mm length. Since the natural background activity from 176Lu is 255  in LSO, the total natural activity in the scintillator of the MR-BrainPET is 881 kBq. This activity is much lower than the activity of transmission sources used in PET scanners with an integrated transmission source and is far too low for generating low noise AC maps for the Tx/Rx coil, that are of sufficient quality, by simultaneous acquisition transmission and emission data during a human study. Moreover, a simultaneous acquisition would require high resolution time of flight (TOF) measurements, Mollet et al (2014) which are not possible with the BrainPET insert due to the relatively low timing resolution of the avalanche photo diods (APDs). However, the same Tx/Rx head coil will be used for all measurements with the 3T MR-BrainPET. It is attached to the patient bed (see figure 2) and always positioned at the same location within the FOV. Thus, making it possible to acquire the transmission data of the bed and the Tx/Rx head coil without the subject and over a much longer measurement time than the relatively short times required for human studies. While Rothfuss et al proposed a maximum likelihood expectation maximisation algorithm for reconstructing the attenuation map from an object scan and a blank scan, we computed the ACF values as defined in equation (4). The BrainPET FOV is too small for reconstructing an attenuation map from the transmission acquisition because only coincidences between one cassette and its 19 opposed cassettes are registered. It is not possible to change the configuration for accepting coincidences between the PET cassettes and, as a result, this leads to missing projections for the reconstruction of the Tx/Rx head coil attenuation map, as shown by the red sectors in figure 3.
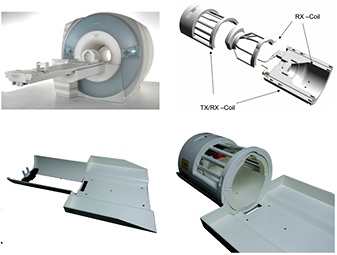
Figure 2. Upper left: Siemens Trio 3T MRT with BrainPET insert and dedicated head Tx/Rx coil. Upper right: detailed view of the Tx/Rx head coil. Lower left: head coil holding extension for the patient bed of the Siemens Trio 3T MRT with BrainPET insert. Lower right: head coil holding extension together with Tx/Rx coil.
Download figure:
Standard image High-resolution image
Figure 3. View field for the uppermost PET cassette (grey with green frame) together with the 19 opposed PET cassettes (solid green) for which coincidences are accepted. The red sectors mark the missing projections for this cassette. A transversal CT image of the Tx/Rx coil is superposed to show which parts of the coil fall outside the transversal FOV.
Download figure:
Standard image High-resolution image2.1. Scanner stability
For the generation of the individual ACF values, it is necessary to acquire an object scan and a blank scan. In order to register all possible coincidences from the 176Lu isotopes, the energy windows must be widened to  and the energy autocorrection must be disabled since the correction algorithm requires the presence of the 511 keV photopeak, which is neither present in the LSO blank scan nor in the LSO object scan. The energy autocorrection normally compensates for the drifts in the measured γ-ray energy spectra, caused by the temperature dependence of the APD gains (Hamamatsu Photonics 2004). For the measurement of ACFs with 176Lu background activity, particularly long acquisition intervals of between hours and days are required. An excessive temperature drift, without autocorrection of the energy spectrum, could lead to varying prompt random count rates and, as a consequence, to biased ACF estimates. In anticipation of this issue, object scans were acquired during two weekends and blank scans were acquired during three weekends to verify the stability of count rates over long measurement intervals. During each weekend, a total of 16 frames with a duration of 4 h (64 h in total) of LSO coincidence data were acquired. Furthermore, the temperature of the 32 PET cassettes was measured with temperature sensors located inside the PET cassettes. In addition, in order to identify potential correlations, the outdoor temperature at the research centre was also measured. In addition to the prompt count rates and random count rates for the individual PET cassettes for all frames, the total prompt count rates and total random count rates of all measurement frames, for both the blank scan and the object scan, were also computed.
2.2. CT measurements
Scattering and absorption of γ-rays depend strongly on the coil materials and vary for different γ-energies. The energy dependence of the linear attenuation coefficient may require the ACF values to be extrapolated from the energy of the intrinsic 176Lu γ-energies to 511 keV. Therefore, the x-ray attenuation of the Tx/Rx head coil was measured with a prototype industrial CT scanner used for material testing5 This enabled the application of higher cathode voltages than ordinarily possible with a clinical CT scanner and furthermore, facilitated the use of a large variety of filters (copper sheets with thicknesses 2,3,4, and 5 mm) in order to obtain several different x-ray mean energies over a wide range. The x-ray tube can be operated with a voltage up to 450 kV and the beam is pre-filtered by an integrated filter consisting of 2 mm beryllium and 3 mm aluminium. Voltage and filter configuration for all four x-ray attenuation measurements are listed in table 1 together with the estimated mean photon energy. In contrast to emission spectra from radiopharmaceuticals and from the 176Lu background, the emission spectra from x-ray tubes are continuous, superposed by several discrete lines from photoelectric absorption at the inner shells. As it was not possible to measure the x-ray spectra for the different beam configurations, the spectra were simulated with SpekCalc (see figure 4) and the mean energy  was computed from the simulated spectra (Poludniowski et al 2009).
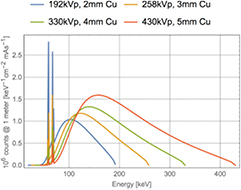
Figure 4. Simulated x-ray spectra for all four different beam configurations.
Download figure:
Standard image High-resolution imageTable 1. Configuration of the CT measurements. All filters were made from copper sheet.
| Anode voltage | Filter thickness |  |
|---|---|---|
| 192 kV | 2 mm | 111 keV |
| 258 kV | 3 mm | 143 keV |
| 330 kV | 4 mm | 174 keV |
| 430 kV | 5 mm | 210 keV |
The material samples water, polyvinyl chloride (PVC), polymethyl methacrylate (PMMA), and Polytetrafluoroethylene (PTFE) were scanned together with the Tx/Rx head coil using the 4 beam configurations. The density, dimensions, and linear attenuation coefficients of the material samples were known. The material samples were placed at the centre of the CT FOV and inside the Tx/Rx head coil using an x-ray transparent foam (see figure 5). Coil and material samples were placed on a rotating table at 1 m distance to the x-ray tube and 1 m distance to the CT flatpanel detector. The flatpanel detector had a  pixel pitch. Filtered back projection with beam hardening correction was used for CT image reconstructions. The resulting grey scale images have a spatial resolution of 160
  . Six volumes of interest (VOI) with of dimensions
  were placed inside the four material samples, the coil material, and the surrounding air. Mean and standard deviation of the grey values inside the VOIs were computed and the ratios between the mean value of the water VOI and the mean values of the remaining 5 VOIs were determined.

Figure 5. Left: 4 material samples with floral foam (the upper sample is water, the left sample is PMMA, the white sample is Teflon, and the red sample is PVC). Right: material samples and coil positioning on the CT scanner table. The table rotates around a vertical axis.
Download figure:
Standard image High-resolution image2.3. 176Lu derived attenuation correction factors
During 3 weekends, coincidence data from 176Lu was acquired with an empty PET FOV and without Tx/Rx head coil (blank scan). The object scan (coincidence data from 176Lu with an empty PET FOV and with Tx/Rx head coil) was acquired during two further weekends. On each weekend, coincidence data was acquired over 64 h (total of 16 frames, each frame has a length of 4 h). The energy window was set to  in order to allow detection of the 202 keV γ-photons and the complete
  -spectrum. The prompt coincidences were corrected using variance reduced random rate estimates (Badawi et al 1999) that were measured with the delayed window technique. Both random corrected prompt coincidences from the blank scan and random corrected prompt coincidences from the object scan were binned into sinograms with axial compression (span 9) (Fahey 2002). Finally, the sinogram entries were divided by the corresponding scan times, and ACF sinograms were computed from the count rates by applying equation (3). Using ACF sinograms is mandatory for the BrainPET since standard image reconstruction is done from sinograms instead of LOR histograms. In addition, even for very long scan times, no 176Lu decays at all are counted for many LORs during the blank and/or object scans due to the very low amount of 176Lu contained in the scintillator. This leads to undefined values when computing the ACF values using equation (3). When using the sinograms, the probability for zero entries in both data (blank and object) was much lower due to an accumulation of counts of several physical LORs into single sinogram bins for data compression. For the residual small fraction of 0.13% of zero entries in both sinograms, no attenuation correction was done, i.e. the ACF value was set to 1.0. The ACF values were not extrapolated to the energy of annihilation γ-photons, although the energy of both γ-lines of 176Lu that fall inside the energy window are lower than 511 keV. The reason for omitting the extrapolation is discussed in sections 3.2 and 4. The attenuation correction (AC) by 176Lu derived ACFs (called Lu-coil-AC) was compared to AC with an attenuation map computed from a transmission scan acquired on an ECAT Exact HR + PET scanner with integrated rotating 511 keV line sources (Wagenknecht et al 2013) (called standard-coil-AC).
2.4. Phantom measurements
A three-compartment phantom (see figure 6) was used to evaluate the accuracy and the quality of the Lu-coil-AC method. The phantom is made from PMMA and has a large background compartment of 236 mm length and 140 mm diameter. The background compartment contains a PTFE cylinder (PTFE compartment) with 190 mm length and 40 mm diameter and two additional compartments, with the same dimensions, that can be filled with air or activity solution. The background compartment and one of the small fillable compartments (hot compartment) were filled with an 18F aqueous solution. The activity concentration ratio between the hot and the background compartment was 5.14:1. One of the small compartments was not filled (air compartment).
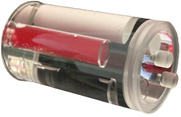
Figure 6. Image of the three compartment phantom with background compartment, hot compartment, cold compartment, and teflon compartment.
Download figure:
Standard image High-resolution imageFor the data acquisition of the emission data from the three compartment phantom, the energy window of the BrainPET was set to the normal range from 420 keV to 600 keV. One acquisition was done without the Tx/Rx head coil and a second acquisition was done with the Tx/Rx head coil. The phantom was placed at exactly the same position for both measurements using an in-house built fixture. The acquired data were corrected for radioactive decay and dead time, and the emission image was reconstructed with a manufacturer's implementation of the OP-OSEM algorithm (Michel et al 1998). An attenuation map of the three compartment phantom, acquired with an ECAT Exact HR + PET scanner with transmission source, was used for attenuation correction of the phantom itself. Scatter correction for phantom scatter was done with the single scatter simulation (SSS) method (Watson et al 1996).
Attenuation correction for the Tx/Rx head coil used in the phantom measurement with the Tx/Rx head coil was done either by multiplication (see equation (2)) of the ACF sinogram computed from 176Lu activity, as described in section 2.3 (Lu-coil-AC), or by using an attenuation map obtained from a rotating 511 keV transmission source (Wagenknecht et al 2013) (standard-coil-AC). For reasons explained previously (see figure 3), reconstruction of an attenuation map of the Tx/Rx head coil from 176Lu transmission is not possible. Therefore, scatter correction was always applied using the SSS method with the transmission AC map of the coil acquired with the ECAT Exact HR + PET scanner. Neither Tx/Rx head coil attenuation correction nor Tx/Rx head coil scatter correction was applied for the phantom measurement without the Tx/Rx head coil. An additional reconstruction without coil attenuation correction but with the Tx/Rx head coil present during acquisition was done for comparison.
The 4 differently acquired/reconstructed images of the phantom were analysed by placing 5 VOIs with 13 mm diameter and 95 mm length at the centre of the PTFE compartment, hot compartment, cold compartment, background compartments, and outside the three compartment phantom (air). Minimum value, maximum value, mean, standard deviation, median, and 25%-quantile were computed from the approx. 6300 voxel values contained in each VOIs.
2.5. Patient data
In addition, we tested the Lu-coil-AC method with emission data from three subjects studied for diagnostic or clinical research purposes. The image reconstruction with scatter correction and coil attenuation correction with either the Lu-coil-AC method or the standard-coil-AC were analogue to the procedure described in 2.4. The radiopharmaceutical and injected activities used for the 3 subjects are shown in table 2.
Table 2. Radiopharmaceutical and injected activity for the three subjects. FDG is 18F-fluordesoxyglucose and FET is 18F-fluoroethyl-L-tyrosine (Langen et al 2006).
| Subject | Radiopharmaceutical | Injected activity |
|---|---|---|
| 1 | FET | 170 MBq |
| 2 | FDG | 184 MBq |
| 3 | FDG | 169 MBq |
3. Results
3.1. Scanner stability
The measurements of the PET cassette temperatures revealed no relevant temperature fluctuations. All cassette mean temperatures remained between  and
and  , with minimal and maximal standard deviations of
  and
and  , respectively. Two factors that caused major changes in the cassette temperatures were identified. The first rise in temperature, of up to
  over the average, lasted a number of hours and was due to intervention by the persons inside the scanner room during examinations done with the MR-BrainPET. The second was due to seasonal temperature changes that affected the climate of the building and led to mean temperature differences of ≈
 C between measurements done in July and in September. Cassette temperature values and outdoor temperatures are shown in figure 7. Apart from the short temperature peaks and the long term variation caused by seasonal changes, the temperature of the cassettes remained constant within <
 minimum to maximum. Prompt and random count rates from 176Lu radiation that were registered during these measurements are shown in figure 7. The count rates measured over single weekends were very stable and observed maximum variations were not larger than 3.6%. The count rates of measurements from successive weekends varied from 3.6% to 4.4%. When the measurements were separated by months, variation in the count rates reached up to 12%. These large changes in the count rates seem to be correlated to the observed change of cassette temperature due to seasonal temperature fluctuations. The observed periods of a few hours with increased cassette temperature do not appear to have influenced the measured count rates, since during the blank and object scan, no personnel were present in the scanner room.
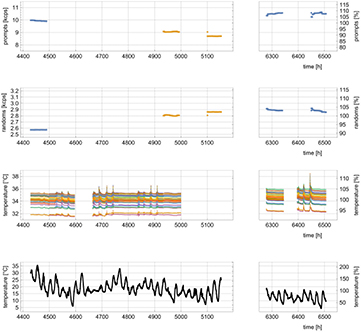
Figure 7. From top to bottom: 1: prompt count rates for blank (blue) and coil (yellow) measurements. 2: Random count rates for blank (blue) and coil (yellow) measurements. 3: Temperature values of the 32 PET cassettes logged during the measurements of the blank scans and the object scans. 4: Outdoor temperature during time of measurement at Research Center Jülich.
Download figure:
Standard image High-resolution image3.2. CT measurements
Figure 8 shows one slice of each of the four CT images from the Tx/Rx head coil and the material samples acquired with the four different x-ray tube configurations resumed in table 1. Only very weak streak artefacts, as reported from images acquired with a clinical CT scanner (for instance MacDonald et al 2011), were visible in these images. This is because the x-ray photon energy of the industrial CT scanner is higher and, during coil design, special emphasis was put on avoiding the placement of heavily attenuating components inside the FOV of the MR-BrainPET. The antenna components, made from copper ribbons, can be identified as 8 thin short dark lines arranged in a circle around the image centre. Due to the very small size of the copper elements inside the FOV, it can be assumed that the x-ray and γ-ray attenuation is mainly caused by the carrier material. In figure 9, ratios of the mean intensity values for the different VOIs and the mean grey value of the water VOI are shown. It can be seen that, within the measurement errors, the coil material has the same x-ray attenuation as water. Although we do not know the exact composition of the coil material, we conclude that a water equivalent plastic was used as carrier material. Knowing the material composition of the coil, the ACF values for 511 keV could have been obtained from the ACF values measured with the 176Lu activity using equation (3), had the path lengths traversing the coil and the surrounding air for each LOR been known. However, as explained in section 2, reconstruction of the attenuation map was not possible because of missing projections (see figure 3). By using equation (4), we estimated the error for the ACF values as if the coil material was water and the ACFs were not corrected for the different γ-ray energies. For structures not larger than 6 cm, which is the case for the Tx/Rx head coil used, we obtained an error for the ACF that was not larger than 28% for a γ-energy of 202 keV and not larger than 14% for a γ-energy of 307 keV. With the MR-MR-BrainPET, offline energy discrimination is not possible in normal operation mode, but according to Rothfuss et al (2014), 61.6% of the recorded counts during a transmission scan with 176Lu background arise from the 307 keV photons and 38.4% from the 202 keV photons, whereas 88 keV photons were rejected. Therefore, it can be assumed that the maximum ACF errors are closer to 14%. Plots of ACF errors for several thicknesses without applying energy extrapolation are shown in figure 10.
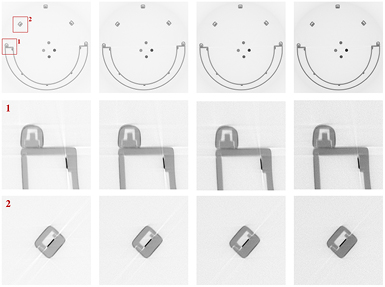
Figure 8. Upper row: single CT image-slices of Tx/Rx head coil and four material samples. Middle and lower row: detail views of support structures and conductors. From left to right:  keV,
keV,  keV,
keV,  keV, and
  keV. Material samples: upper is PVC, right is PTFE, lower is PMMA, left is water. Lowered CT image contrast at higher energies is clearly visible.
Download figure:
Standard image High-resolution image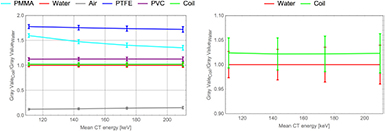
Figure 9. Ratios between CT image grey values (mean) of material sample VOIs and water sample VOI. Left: ratios for all material samples. Right only water and coil material. Error bars show standard deviations.
Download figure:
Standard image High-resolution image
Figure 10. ACF errors  for absent energy extrapolation from γ energy to 511 keV versus transmission γ-energy for material thicknesses of 2 cm, 4 cm and 6 cm.
Download figure:
Standard image High-resolution image3.3. 176Lu derived attenuation correction factors
When computing the ACF values according to equation (3) from the 192 h blank scan and the 128 h object scan, only 0.13% of the ACF sinogram entries could not be computed because both, sinogram entry of the blank scan and sinogram entry of the object scan were zero. Attenuation for these sinogram bins was ignored and the corresponding ACF values were set to 1. However, in 17.4% of the cases, the sinogram entry of the blank scan was smaller than the sinogram value of the object scan. The Poisson noise present in both scans is responsible for this observation. In order to avoid a bias and streak artefacts in the attenuation corrected reconstructed PET image, these values were used without modification for attenuation correction.
3.4. Phantom measurements
We computed the difference images between ground truth (image measured without coil and reconstructed without coil AC) and the images acquired with the Tx/Rx head coil and reconstructed them with different coil attenuation corrections (no coil AC, standard-coil-AC, and Lu-coil-AC). The reconstructed voxel size for all images was  and the difference images are shown in figure 11. As expected, the difference between ground truth and image acquired with the Tx/Rx head coil, but without coil AC, shows streaks due to uncorrected γ attenuation. Moreover, a negative bias of up 7 kBq
  (hot compartment VOI) was observed. When using the standard-coil-AC method, streaks due to γ attenuation by the coil are reduced, but a positive bias of up to 6 kBq
  (hot compartment VOI) is observed. When using the Lu-coil-AC method, streaks are further reduced but a negative bias is still present. However, the maximum bias is 4 kBq
  , which is significantly smaller than for the other two cases.

Figure 11. Difference emission images of a single slice of the three compartment phantom. Left: Difference between ground truth and image without coil AC. Middle: Difference between ground truth and image with standard-coil-AC. Right: Difference between ground truth and image with Lu-coil-AC. Ground truth is data acquisition without coil and reconstruction without coil AC.
Download figure:
Standard image High-resolution imageAnalysis of the volumes of interest showed that, except for the VOI in the surrounding air and the background compartment, the mean activity concentration for the Lu-coil-AC best approaches the mean activity concentration of the ground truth. Mean values obtained using the standard-coil-AC always overestimated the ground truth values. Without coil AC, the activity concentrations in the hot, cold, and background compartment were underestimated, whereas the activity concentrations in the PTFE compartment and the surrounding air were overestimated. Standard deviation and coefficient of variation were highest for Lu-coil-AC, which was expected because of the low 176Lu activity. Mean values, differences of mean values to the ground truth, standard deviation and coefficient of variation for all VOIs and all 4 reconstructions are given in table 3. Corresponding Box–Whisker plots are shown in figure 12.
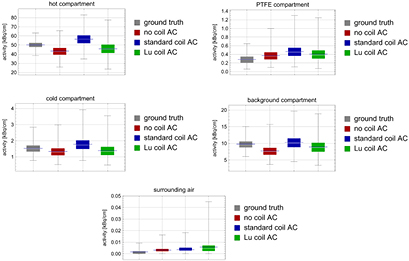
Figure 12. Box–Whisker plots for all 5 VOIs and ground truth, no coil AC, standard-coil-AC and Lu-coil-AC. Blue centre lines represent the mean of all voxel values, rectangles represent interquartile range of all voxel values, whiskers with fences represent minimum and maximum of all voxel values. The standard mean error was, in all cases, smaller than 1.26% of the corresponding mean value.
Download figure:
Standard image High-resolution imageTable 3. Mean values, differences of mean values to ground truth, standard deviation and coefficient of variation for all 5 VOIs and ground truth, no coil AC, standard-coil-AC and Lu-coil-AC. Units are kBq  .
.
| Value | Method | Hot VOI | PTFE VOI | Cold VOI | bg VOI | Air VOI |
|---|---|---|---|---|---|---|
| Mean | Ground truth | 50 | 0.28 | 1.5 | 9.7 | 0.002 |
| No coil AC | 43 | 0.37 | 1.3 | 7.7 | 0.003 | |
| Standard-coil-AC | 56 | 0.47 | 1.8 | 10.3 | 0.003 | |
| Lu-coil-AC | 46 | 0.41 | 1.4 | 8.9 | 0.006 | |
| Diff. | No coil AC | −6.8 | 0.092 | −0.2 | −2.1 | 0.0014 |
| Standard-coil-AC | 6.4 | 0.19 | 0.25 | 0.54 | 0.0018 | |
| Lu-coil-AC | −4. | 0.12 | −0.14 | −0.8 | 0.0042 | |
| Std. Dev. | Ground truth | 3.3 | 0.1 | 0.28 | 1.3 | 0.002 |
| No coil AC | 5.4 | 0.12 | 0.34 | 1.5 | 0.002 | |
| Standard-coil-AC | 6.5 | 0.14 | 0.41 | 2 | 0.002 | |
| Lu-coil-AC | 6.9 | 0.14 | 0.38 | 2 | 0.004 | |
| Var. Coeff. | Ground truth | 0.067 | 0.34 | 0.19 | 0.14 | 0.98 |
| No coil AC | 0.12 | 0.33 | 0.25 | 0.2 | 0.7 | |
| Standard-coil-AC | 0.11 | 0.31 | 0.23 | 0.19 | 0.7 | |
| Lu-coil-AC | 0.15 | 0.35 | 0.27 | 0.23 | 0.63 | |
3.5. Patient data
Image reconstructions comparing standard-coil-AC to Lu-coil-AC for the three subjects are shown in figures 13 and 15. Figures from an additional FDG exam are provided in the supplementary data (stacks.iop.org/PMB/63/035039/mmedia). In all three cases, faint streak artefacts that are visible in the images with standard-coil-AC are slightly reduced by using Lu-coil-AC. This is noticed, in particular, for the image reconstruction of the FET examination (figure 13). The different strengths of the weak streak artefacts and their location in the image can be easily seen in the corresponding difference images. The difference images are overlaid by the concentric ring artefacts previously mentioned, e.g. Badawi and Marsden (1999) and references therein, and are apparently not a consequence of the attenuation correction methods used. The concentric ring artefacts are not discerned in the transversal slices of the head and phantom images. Figure 14, left, shows the same image as figure 13, bottom left, but with a modified colour range and overlay of the head coil CT image for better visualisation and localisation of residual artefacts. For comparison, the difference between the ground truth phantom image and the phantom image with the coil but without coil AC is shown in figure 14 to the right (averaged over all image planes). A further important observation is that the estimated activity concentration is systematically higher for image reconstruction with the standard-coil-AC than for reconstructions with the Lu-coil-AC. The slightly increased image noise, as expected from table 3, is hardly noticeable in the head images reconstructed with the Lu-coil-AC. These three observations are in agreement with the findings in section 3.4. Except for the bias of the activity concentration, which can be compensated by recalibration of the Siemens 3T MR-BrainPET insert with the Lu-coil-AC, the observed differences in both AC methods are too small to be clinically relevant.
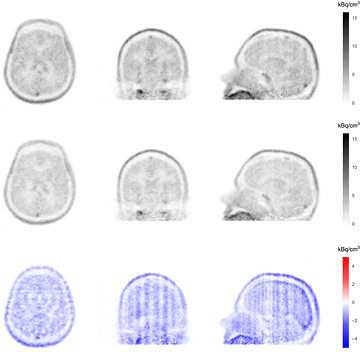
Figure 13. Transversal slice (left), coronal slice (mid), and sagittal slice (right) of first subject (FET). Upper row shows images reconstructed with standard-coil-AC. Middle row shows images reconstructed with Lu-coil-AC. Lower row shows difference images between Lu-coil-AC and standard-coil-AC.
Download figure:
Standard image High-resolution image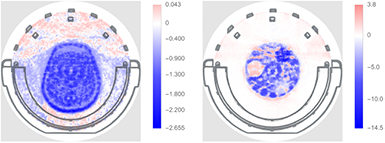
Figure 14. Left: overlay of CT image of the Tx/Rx head coil and the difference head image shown in figure 13, bottom, left with modified colour range for better visualisation of residual artefacts. Right: overlay of CT image of the Tx/Rx head coil and the three compartment phantom (difference between ground truth and image without AC, averaged over all planes of the phantom) with modified colour range for better visualisation of residual artefacts. Colour scale is in kBq  .
.
Download figure:
Standard image High-resolution image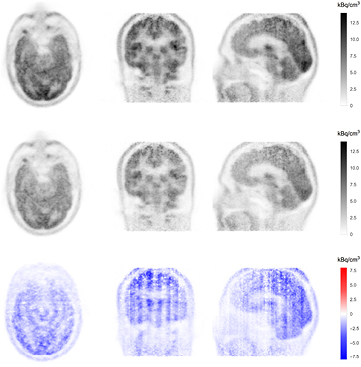
Figure 15. Transversal slice (left), coronal slice (mid), and sagittal slice (right) of third subject (FDG). Upper row shows images reconstructed with standard-coil-AC. Middle row shows images reconstructed with Lu-coil-AC. Lower row shows difference images between Lu-coil-AC and standard-coil-AC.
Download figure:
Standard image High-resolution image4. Discussion
When using Tx/Rx coils that are attached to or integrated into the MR bed, the presented approach is a feasible alternative for obtaining ACFs of the coil. It is straight forward and readily available, without the need for additional accessories. Extension to flexible, arbitrarily placeable coils will, however, be difficult because the method relies on the prerequisite that the coil can be placed repeatedly for the 176Lu transmission scan without subjects in the same position and with identical orientation. Furthermore, the PET device must allow adaptation of the energy window to the 176Lu γ radiation. If these conditions are fulfilled, the presented method provides a straightforward and easy to implement alternative to providing AC maps acquired with an external CT scanner or a PET scanner with transmission source. The data acquisition can be done without human interaction during nights or weekends, i.e. during the idle times of the MR-PET scanner. By placing the coil at exactly the same position when acquiring the ACFs and when applying them for correction, one can circumvent the problem of positioning mismatch between AC map and true coil. Also, the intrinsic spatial resolution of the scanner is perfectly matched, since the same scanner is used. Compared to transmission AC maps acquired at the energy of 511 keV, 176Lu based ACFs are acquired at lower energies (i.e. 202 keV and 307 keV). However, these energies are considerably higher than the mean x-ray energies of clinical CT scanners, which are widely available and used very often for the acquisition of AC maps of MR components. As described in Lemmens et al (2008) and references therein, the low energies lead to strong streak artefacts due to materials with higher density and higher effective atomic numbers than observed in organic tissue. In addition, the continuous nature of the x-ray spectrum only allows for an approximate energy extrapolation, see e.g. Paulus et al (2013). On the contrary, energy discrimination and energy extrapolation is possible for the 176Lu γ-photons (Rothfuss et al 2014), although this is not available with the MR-BrainPET used for this study. Furthermore, the limited transversal FOV impedes the reconstruction of the AC-map from the 176Lu background with the method described in Rothfuss et al (2014) or similar approaches, e.g. Heußer et al (2017). The accurate reconstruction of the AC-map is necessary to allow for correct energy extrapolation and also for scatter correction based on the same 176Lu background derived AC-map.
The very low natural activity of Lutetium requires very long transmission scan times and therefore very stable count rates. Without any objects inside the MR-PET FOV, i.e. no γ-photon emitter apart from 176Lu, the prompt and random count rates can only be affected by the thermal stability of the scintillation detector. An average prompt count rate of 8.9 kcps was measured with the Tx/Rx head coil in the FOV and a count rate of 10.3 kcps was measured without the coil. Thus, approximately 1400 photons per second were absorbed by the coil, and generation of ACFs from 176Lu with a Poisson noise component, that is comparable to routine emissions scans, requires an acquisition time of several days. The system temperatures were found to be very stable inside the PET cassettes during the acquisitions of both the blank and the object scans and were within a range of  peak to peak. Over several months, an additional general temperature drift of all cassette temperatures of
  was observed and was found to be correlated with a substantial change in the outdoor temperature. In agreement with these temperature variations, count rates for prompts and randoms are subjected to larger variations when the measurements are separated by longer times. Apart from a few exceptions, variations in count rates over one week remained below 1%. In all cases, they were smaller than 3.6%. Since this small variation was found to affect the counts in all LORs similarly, it mainly introduces a bias in the AC corrected images. Calibration of the PET scanner for using Lu-coil-AC in the routine image reconstruction can effectively compensate this bias. Nevertheless, in order to minimise differences in the count rates, acquisition of blank and object scans should be done during consecutive days and weekends.
It was found that the Tx/Rx head coil material essentially attenuates like plain water, which would enable a straightforward extrapolation of the linear attenuation coefficients from the two 176Lu γ energies to 511 keV. Unfortunately, reconstruction of an attenuation map for the coil, as described in Rothfuss et al (2014), is not possible with the MR-BrainPET, since the diameter of the transversal FOV is slightly smaller than the coil diameter and some projections are missing. Whole body devices, such as Siemens' mMR and GE's Signa system (Delso et al 2011, Levin et al 2016), should have a sufficiently large transversal FOV for AC map reconstruction from 176Lu γ-transmission. In addition, using a reconstructed coil AC map would also allow for scatter correction with the same AC map. The ACF error introduced by absent energy extrapolation was estimated analytically and found to be smaller than 28% in all cases, up to the maximum thickness of present coil structures (6cm). Even with this error, the performance of the method was better than using the standard-coil-AC. The error can be avoided by allowing reconstruction of the coil from 176Lu transmission data.
The high fraction of unphysical ACF values (ACF < 1) in the attenuation correction sinogram of approx. 17% could be reduced by extending the acquisition times for the blank and object scans. A test evaluation of setting all ACF values smaller than 1.0 led to stronger streak artefacts in the reconstructed head images. The standard deviation for the pixel values in the different VOIs were, in this case, only slightly smaller than those reported in table 3. The fraction of undefined ACF values due to zero entries in the LOR histograms of the object and blank scan is considerably higher if the ACF values are computed in LOR space instead of in sinogram space. This is a consequence of the considerably higher number of physical LORs compared to sinogram entries. Therefore, the scan times should be significantly longer if LOR based image reconstruction is used.
Image reconstruction for emission scans acquired with a Tx/Rx head coil but without any coil AC is not acceptable for the coil used in MR-BrainPET studies, since streak artefacts appear and a strong negative bias in the activity concentration is introduced (see difference images 11). Reconstruction with the standard-coil-AC leads to a generally positive bias, which is most probably due to cross-calibration between the well counter, the MR-BrainPET, and the ECAT Exact HR + PET scanner in order to achieve comparable quantitative images from both PET scanners. Reconstruction with the Lu ACF values leads to negative bias values for the activity concentrations, which are, however, significantly smaller than in both other cases. These residual biases may be either due to the missing energy extrapolation or to the fact that the cross-calibration for the standard-coil-AC was also used for the reconstruction with Lu-coil-AC. A further possible reason may be different scatter fraction for transmissions with 202 keV and 307 keV photons when compared to transmissions with 511 keV photons.
Neither the difference image for the reconstruction of the phantom data (figure 11) with standard-coil-AC nor the one for the reconstruction of the phantom data with Lu-coil-AC showed strong streak artefacts. In particular, no additional artefacts due to scattered gamma photons during measurement of the ACFs could be observed in these images, although the 3D acquisition of ACFs potentially leads to increased scatter contamination of the ACFs and equation (4) is not accounting for this effect. However, 2D acquisition of ACFs for minimised scatter contribution is not possible with the Siemens 3T MR-BrainPET scanner. We are currently working on using prior information and regularisation for the reconstruction of AC-maps from incomplete data for obtaining unbiased and artefact-free AC-maps, which still remains a challenge and is certainly beyond the scope of this work.
The reproduced activity concentration in the different VOIs of the three compartment phantom was altogether best for the Lu-coil-AC reconstruction, although it was not the closest to the ground truth for all VOIs. The magnitude of the observed bias without attenuation correction agrees with values reported in Eldib et al (2012b). The image noise for 176Lu based correction is slightly increased compared to all other cases (ground truth, standard-coil-AC, no coil AC) because of the very low intrinsic 176Lu activity. However, the increased image noise is barely noticeable in the patient/volunteer images; whereas the streak artefacts, which are noticeable in the images with standard-coil-AC, could be reduced by using the Lu-coil-AC. Since the transmission AC map was acquired with 511 keV radiation, we attribute the residual streak artefacts in this case to a residual mis-positioning of the standard AC map, with respect to the true position of the coil and/or the different spatial resolutions of the MR-BrainPET and the ECAT Exact HR + PET scanner. For the Lu-coil-AC, we attribute the residual streak artefacts to the missing energy extrapolation of the ACF values and the usage of the transmission AC map for scatter correction.
In summary, the presented method allows the measurement of the ACFs for fixed Tx/Rx coils without the need for an additional CT scanner or PET scanner with transmission sources. However, for the presented method to be effective, it is necessary to ensure that the Tx/Rx coils are placed at exactly the same position both during the transmission scan with 176Lu background activity and the emission scan which will be corrected with the measured ACFs. Therefore, attenuation correction using flexible Tx/Rx coils is not easily possible. Furthermore, due to the low activity of the 176Lu background, long transmission scan times of several days with stable operational parameters, in particular, stable scintillation detector temperature, are required. Finally, the availability of a reconstructed coil attenuation map, which was not possible for the present study, would allow extrapolation of the attenuation correction from the γ-energy of the 176Lu background to the γ-energy of the annihilation photons. Furthermore, it would also avoid having to empirically correct 0.13% of undefined ACF values resulting from zero entries in both the blank sinogram and the transmission sinogram. Thus, reconstruction of a coil attenuation map would potentially improve the presented method, however, it is not possible with the Siemens 3T MR BrainPET insert and has to be studied in future on MR-PET devices without the restriction of a limited PET FOV.
5. Conclusions
The presented approach based on natural 176Lu background provides a straightforward method for attenuation correction of Tx/Rx coils in simultaneous MR-PET imaging. No additional imaging device such as a CT scanner or PET scanner with transmission sources is required and the data acquisition can be done during the idle times of the MR-PET scanner e.g. at weekends or night time and without the need of intervention by technicians. The AC method can be used for rigid Tx/Rx coils that can be repeatedly placed at the same position within the MR-PET FOV, independent of the presence of a patient or volunteer. Even without energy extrapolation from 202 keV and 307 keV to 511 keV, the Lu-coil-AC corrected images had smaller biases than the images corrected with our standard method (transmission AC map acquired on an ECAT Exact HR + PET scanner). Also, residual streak artefacts, that are still observed in reconstructed PET images when using standard-coil-AC, could be further reduced. On a MR-PET scanner with a sufficiently large FOV covering the complete Tx/RX coil, the method could be further improved by reconstructing an AC map from the 176Lu background transmission scan that allows for energy extrapolation of the attenuation coefficients to 511 keV. Also, by extending the blank and object scan times to more than 3 weekends, one could further reduce the additional noise that will propagate into the reconstructed PET images by using the Lu-coil-AC.
Acknowledgments
The authors would like to thank for the support of this work by Diondo GmbH, Hattingen an der Ruhr, Germany. Furthermore, the authors want to thank the colleagues from Department S for providing us with outdoor temperatures for the time period of the measurements.
Footnotes
- 4
- 5
The prototype CT scanner was built from a 450 kV x-ray tube with inherent filtration equivalent to 2 mm Beryllium and 3 mm Aluminium, and an x-ray flat panel detector with a
 pixel pitch (Diondo GmbH, Hattingen an der Ruhr, Germany).