 Min Zhu
 Mei-xia Wang3
 Xia Su
 Zheng Jiao
- 1Department of Pharmacy, Shanghai Chest Hospital, Shanghai Jiao Tong University, Shanghai, China
- 2School of Basic Medicine and Clinical Pharmacy, China Pharmaceutical University, Nanjing, China
- 3National Clinical Trial Institution Office and Phase I Study Ward, Beijing Youan Hospital, Capital Medical University, Beijing, China
- 4Department of Pharmacy, Huashan Hospital, Fudan University, Shanghai, China
- 5PharmaEssentia Biotechnology (Beijing) Limited, Beijing, China
- 6Pharmacometrics, Earnest and Ye-sayer, Beijing, China
Objective: To develop a population pharmacokinetic (PK) model for ropeginterferon alfa-2b and to compare its PK properties between Caucasian and Chinese populations.
Methods: A population PK model was developed based on data from two phase I clinical trials conducted in Caucasian and Chinese individuals, to evaluate the influence of ethnicity on the PKs of ropeginterferon alfa-2b.
Results: We included 456 observations from 30 healthy Caucasian subjects and 438 observations from 27 healthy Chinese subjects in the population PK analysis. The PKs of ropeginterferon alfa-2b were best described by a one-compartment quasi-equilibrium approximated target-mediated drug disposition model with first-order absorption and absorption lag times. The typical value (relative standard error%) of apparent clearance (CL/F) and volume of distribution of ropeginterferon alfa-2b in 70-kg subjects were 0.778 (12%) L/day and 2.32 (14%) L, respectively. Body weight was the only significant factor affecting the CL/F. There were no obvious differences in the PK properties of ropeginterferon alfa-2b, and predicted steady-state exposure was similar in the Chinese and Caucasian populations.
Conclusion: No significant ethnic differences in ropeginterferon alfa-2b PKs were observed between the Chinese and Caucasian populations.
Introduction
Interferon (IFN) is produced in influenza virus-infected chick embryo cells, which has the ability to interfere with viral replication and induce resistance to viral infection. It has been widely used in the treatment of chronic hepatitis B (Janssen et al., 2005), hepatitis C (Rivero-Juarez et al., 2014), acquired immunodeficiency syndrome (Husak et al., 1997), and cancer (Bottomley et al., 2009). There are three principal routes of IFN elimination: through the liver, the kidneys, or via interactions with IFN receptors (Bocci, 1987). Standard IFNs have short serum half-lives (approximately 6 h) (Wills, 1990), which limits their use. Polyethylene glycol-modified (PEGylated) forms of IFN have considerably long half-lives and provide a means of improving patient compliance (Pedder, 2003). The first-generation long-acting IFN PEG-Intron® (Schering Corporation, 2001) from Merck and the second-generation Pegasys® (Genentech Inc., 2002) from Roche have been approved by the United States Food and Drug Administration and European Medicines Agency (EMA), to treat chronic hepatitis B and hepatitis C. Both drugs are administered weekly via subcutaneous (SC) injection.
Ropeginterferon alfa-2b (BESREMi®) is a third-generation long-acting IFN injection marketed in the European Union for the treatment of polycythemia vera (Gisslinger et al., 2015). Ropeginterferon alfa-2b contains a PEGylated isomer at only one position (Illes et al., 2020), whereas PEG-Intron® and Pegasys® have 13 and six positional isomers, respectively (Foster, 2004). The single isomer entity of ropeginterferon alfa-2b and the monopegylation at the proline chain of the N-terminal of the moiety can reduce the variabilities caused by different isomers (Foser et al., 2003). The usual starting dose is 100 μg every 2 weeks (Q2W), which can be gradually increased to a maximum dose of 500 μg Q2W until a sufficiently low and stable red blood cell count is achieved (EMA, 2021). Compared to the weekly dose regimen of PEG-Intron® and Pegasys®, the 2-weeks dosing interval makes ropeginterferon alfa-2b more convenient in clinical use.
A non-compartment PK analysis (NCA) of ropeginterferon alfa-2b has been conducted, using PK data from a phase I clinical trial conducted in healthy Caucasian volunteers. The dose proportionality analysis suggested more than proportional kinetics with an increasing dose, indicating that ropeginterferon alfa-2b might have a nonlinear PK (EMA, 2019). Moreover, although we have information for PK, efficacy, and safety of ropeginterferon alfa-2b in Caucasians, little was known in Chinese populations.
Here, intense sampling PK data pooled from two phase I studies conducted in Caucasians and Chinese were included to develop a population PK model of ropeginterferon alfa-2b for the first time. The population PK analysis aimed to 1) describe and explain the nonlinear PKs of ropeginterferon alfa-2b and 2) investigate the potential PK ethnic differences between Caucasian and Chinese populations.
Methods
Study Design
PK data from two phase I clinical trials of ropeginterferon alfa-2b (BESREMi®, PharmaEssentia Corp., Taipei) conducted on healthy Caucasian subjects (Study A09–102) and healthy Chinese subjects (Study A17–101), were pooled into analysis.
Study A09–102 was a single center, randomized double-blind, active-control, single dose escalation study conducted by Anapharm Inc. (Montréal, QC, Canada). In total, 48 adult male Caucasian subjects aged 18–45 years were randomized into six cohorts, with each evaluating one dose. Within each dosing cohort, two subjects received a single SC dose of Pegasys® (180 μg) and the other six received a single SC injection of ropeginterferon alfa-2b (24, 48, 90, 180, 225, or 270 μg). Blood samples were collected pre-dosing and 1, 3, 6, 9, 12, 16, 24, 36, 48, 72, 96, 120, 144, 168, 192, 240, 288, 336, 504, and 672 h afterward.
Study A17–101 was a single center, randomized open-label, active-control, single dose escalation study conducted at the Beijing Youan Hospital (Beijing, China). Forty healthy male or female Chinese subjects aged 18–45 years were randomly assigned to four cohorts as follows: three ropeginterferon alfa-2b cohorts (n = 10 each) that received a single SC dose of 90, 180, or 270 μg ropeginterferon alfa-2b, and a Pegasys® cohort that received a single SC dose of 180 μg Pegasys® (n = 10). The proportion of males or females was no less than one-third in each cohort. Blood samples were collected pre-dosing and 1, 3, 6, 9, 12, 16, 24, 36, 48, 72, 96, 120, 144, 192, 240, 336, 504, and 672 h afterward.
The two studies were intended to investigate the PKs of ropeginterferon alfa-2b. Pegasys® was chosen as the comparator in both studies since it is the typical drug of the 40-kDa long-acting PEGylated IFNs and expected to have comparable PKs with ropeginterferon alfa-2b.
Written informed consent was obained from all study subjects. Clinical trial A09–102 was reviewed and approved by the Quebec Institutional Review Board, Canada. Clinical trial A17–101 was reviewed and approved by the Ethics Committee of Beijing Youan Hospital affiliated to Capital Medical University, Beijing, China. Both studies were conducted in accordance with the International Council for Harmonization Good Clinical Practice guidelines and the Declaration of Helsinki 2004. Data from the subjects administered ropeginterferon alfa-2b were included in the PK analysis.
Bioassays
Serum ropeginterferon alfa-2b concentrations were determined using the validated double antibody sandwich method by Pharmaron Biotechnology Co., Ltd. (Boston, MA, United States) in study A09–102, and by Xuzhou Jiasheng Pharmaceutical Technology Co., Ltd. (Xuzhou, China) in study A17–101. The bioassay method has been cross-validated in the two laboratories. The coefficient of variation of the bioassay was <10%, with a lowest limit of quantification of 50.0 pg/ml and a calibration range of 50.0–2,800 pg/ml.
Non-Compartment Analysis
PK parameters were estimated through a NCA using the standard methods. The peak concentration (Cmax) was obtained directly from the concentration-time curve and the area under the concentration-time curve (AUC) was calculated using the linear trapezoidal rule. All calculations were performed using the R package PKNCA (version 0.9.4) (Denney et al., 2015).
Population Pharmacokinetic Modeling
PK analysis was performed using the nonlinear mixed effects modeling software (NONMEM, version 7.3, ICON plc, Ellicott City, MD, United States) with a gFortran compiler (version 4.6.0, http://gcc.gnu.org/fortran/). Pre- and post-processing were conducted using Perl-speaks-NONMEM (version 4.9.0, https://uupharmacometrics.github.io/PsN/), Pirana (version 2.9.9, https://www.certara.com/software/pirana-modeling-workbench/), and R (version 3.6.1, http://www.r-project.org/). The first-order conditional estimation method, with η-ε interaction option, was used throughout model development.
Base Model
A first-order absorption with or without the lag time was investigated for modeling the SC absorption of ropeginterferon alfa-2b. A one-compartment model was selected according to the previous reports of PEG-Intron® (Jen et al., 2001) and Pegasys® (Saleh, 2017) as well as the diagnostic plot. Because nonlinear PKs were revealed by the dose proportionality analysis in Caucasians (EMA, 2019), an empirical Michaelis-Menten (MM) elimination model and a mechanism-based target-mediated drug disposition (TMDD) model were examined. Akaike information criterion (AIC) (Yamaoka et al., 1978) and Bayesian information criterion (BIC) (Dunne, 1993) were used to assess the candidate structural models.
The schematic of the MM model is shown in Figure 1A. The dose-dependent clearance can be described by Eq. 1:
where
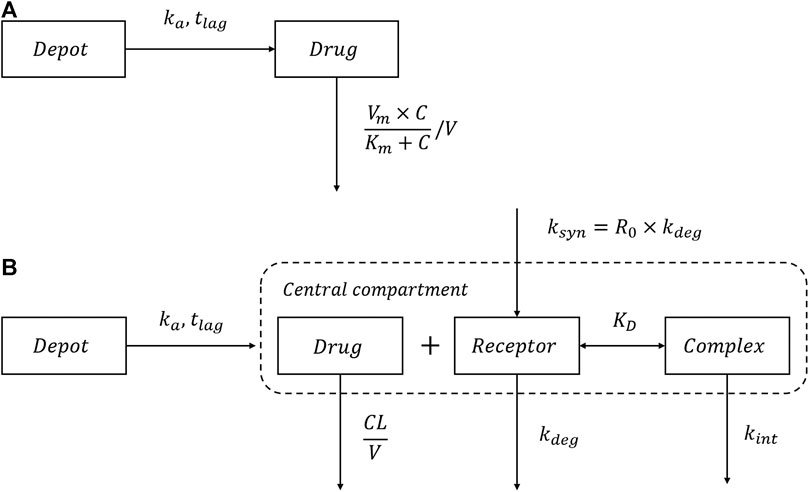
FIGURE 1. Schematic of the MM model and TMDD model. (A) The Michaelis-Menten (MM) elimination model; (B) The quasi-equilibrium approximated target-mediated drug disposition (TMDD) model.
The schematic of the TMDD model is shown in Figure 1B. Because the concentrations of the receptor and drug-receptor complex were not available, the initial binding process for the general TMDD could not be sufficiently identified (Ma, 2012). Thus, the quasi-equilibrium (QE) approximated TMDD model (Mager and Krzyzanski, 2005) was employed, where the parameter
As shown in Figure 1B, after SC administration, ropeginterferon alfa-2b enters the central compartment with first-order absorption rate
All processes, including receptor binding, receptor degradation, and drug-receptor complex internalization occur in the central compartment. Both drugs and receptors comprise two components: free drugs/receptors and complexes. Thus, the total drugs and receptors can be determined using Eqs 3, 4, respectively:
where
where
The total drug amount (Eq. 3) can also be expressed in terms of free drug (Gibiansky et al., 2008):
Thus, the total systemic clearance of ropeginterferon alfa-2b can be calculated by Eq. 8:
where
Between-subject variability (BSV) was estimated using an exponential function, as described in Eq. 9:
where
Residual unexplained variability (RUV) was modeled using additive (Eq. 10), proportional (Eq. 11), and combined proportional and additive (Eq. 12) models as follows:
where
Covariate Model
The covariates investigated in this study were subject demographics [age, sex, ethnicity, weight, body mass index (BMI), and body surface area (BSA)]. Because all subjects included in this study were healthy volunteers, the laboratory tests (alkaline phosphatase, alanine glutamate transferase, aspartate aminopeptidase transferase, total bilirubin, albumin, serum creatinine, hemoglobin level, hematocrit, white blood cell count, and platelet count) were within the normal ranges. The effects of these factors could not be identified, and they were not included in the covariate analysis.
First, we visually inspected the relationships between the post hoc Bayesian estimates and covariates, to identify potential covariates. These were then tested using a stepwise forward inclusion and a backward elimination procedure. In the forward inclusion process, covariates were considered significant if they decreased the objective function value (OFV) by > 3.84 (
Continuous covariates were modeled using a power function (Eq. 13):
For categorical covariates, such as sex, a proportional function was used, as described in Eq. 14:
where, in both the models,
Model Evaluation
The final model was evaluated using goodness-of-fit (GOF) plots, a visual predictive check (VPC) (Yano et al., 2001), and bootstrapping. A VPC with 1,000 simulations was performed. The median and 10th and 90th percentiles of the distributions of the simulated concentration values were calculated and assessed after overlaying the observations. A non-parametric bootstrap method with 1,000 iterations was used to assess the stability of the model. The 5th to 95th percentiles for bootstrap replicates were obtained and compared with the parameter estimates from the final model.
Simulation
Monte Carlo simulations were conducted based on the final established model, to compare the PKs of ropeginterferon alfa-2b in the two populations (n = 1,000 each). After multiple SC doses of 100 or 200 μg Q2W, the area under the time-concentration curve at steady state (AUCss) for Caucasian and Chinese populations was simulated using Simulx (version 2019R12, Lixoft SAS, Antony, France) (Lixoft, 2019).
Results
Subjects
Of the 66 subjects administered ropeginterferon alfa-2b, nine (six Caucasian subjects from the study A09–102 and three Chinese subjects from the study A17–101) were excluded from the PK analysis because of drop-out. Therefore, 57 subjects with 894 concentrations were finally included in the study. A total of 456 observations were from 30 Caucasian subjects, and 438 observations were from 27 Chinese subjects.
Table 1 summarizes the demographic characteristics of the subjects enrolled in the population PK analysis. The number and percentage for categorical variables and the mean and standard deviation for continuous variables were presented. The differences between Caucasians (Study A09–102) and Chinese (Study A17–101) were compared by χ2 test for categorical variables and t test for continuous variables. Subjects in study A09–102 were all males and study A17–101 had a sex ratio of 15: 12 (male: female). The male/female ratios in A17–101 were 5:4, 5:3, and 5:5 for 90, 180, and 270 μg cohorts, respectively. Ages in the two ethnic groups were comparable (32.3 ± 6.9 vs. 31.6 ± 6.19), whereas the body weight was 14% lower in the Chinese population than the Caucasian population (68.1 ± 10 vs. 79.4 ± 9.41 kg).

TABLE 1. Demographic characteristics of subjects.
Non-Compartment Analysis
The estimates of PK parameters, including Cmax, AUC from time zero to the time of the last quantifiable concentration (AUC0–t), and AUC from time zero extrapolated to infinity (AUC0–inf), are shown in Supplementary Table S1. The concentration-time curves stratified by dose are shown in Figure 2, which implied that Caucasians and Chinese populations had similar PK profiles. CL/F derived from the NCA decreased with an increase in dose (Figure 3).
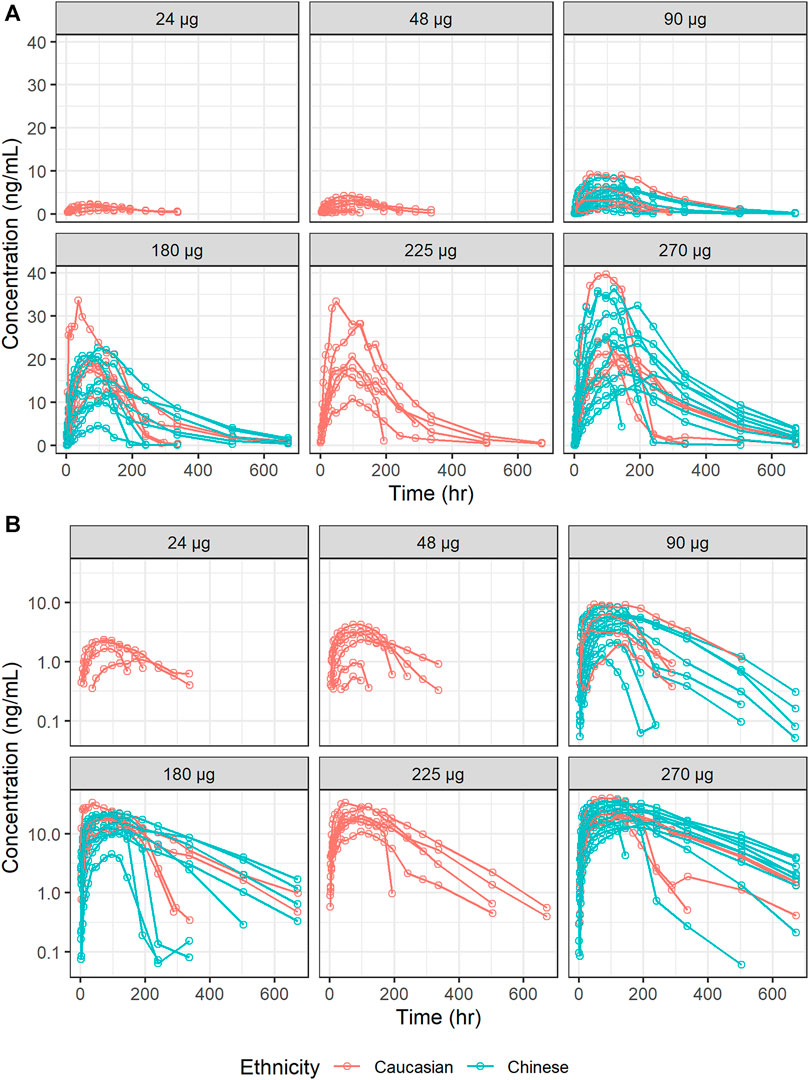
FIGURE 2. Concentration-time curves of ropeginterferon alfa-2b stratified by dose. (A) Ordinary coordinate; (B) Semi-logarithmic coordinate. Red points and lines represent Caucasian populations; blue points and lines represent Chinese populations.
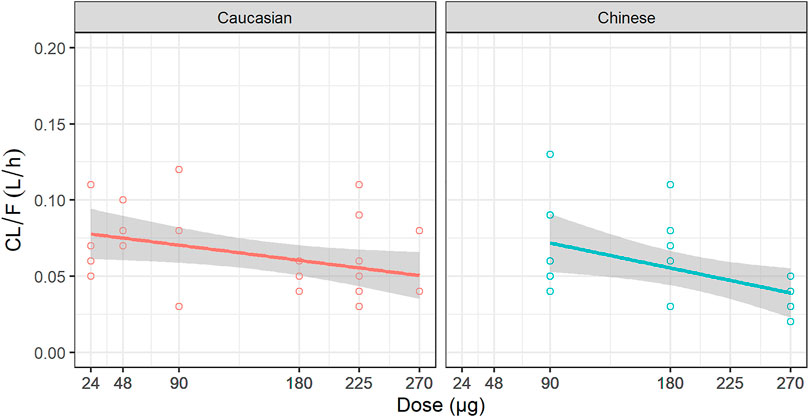
FIGURE 3. Relationship between dose and CL/F. CL/F: the apparent clearance derived from non-compartment analysis.
Population Pharmacokinetic Modeling
Base Model
First-order absorption with a lag time (
The condition number of the TMDD model was too large (2.4 × 10⁷), indicating that the model was over-parameterized and needed to be simplified (William Bachman, 2003). The relative standard errors of the estimates of
The sensitivity analysis was performed for these two parameters (
Covariate Model
Of all the covariates included in this study, ethnicity, sex, weight, BMI, and BSA showed correlations with CL/F and ka by visual inspection. These were then included into the population PK model for a quantitative analysis. Among the three covariates which were highly correlated (namely, weight, BMI, and BSA), weight was selected.
The stepwise covariates selection is shown in Supplementary Table S2. Only weight was selected in forward inclusion as a significant factor affecting CL/F, as it resulted in an OFV decrease of 8.309 (p = 0.004). After backward elimination, weight was still retained in the final model as follows:
No significant effect of ethnicity was found on all PK parameters, including CL/F, V/F, and ka. Parameter estimates for the final population PK model are presented in Table 2.
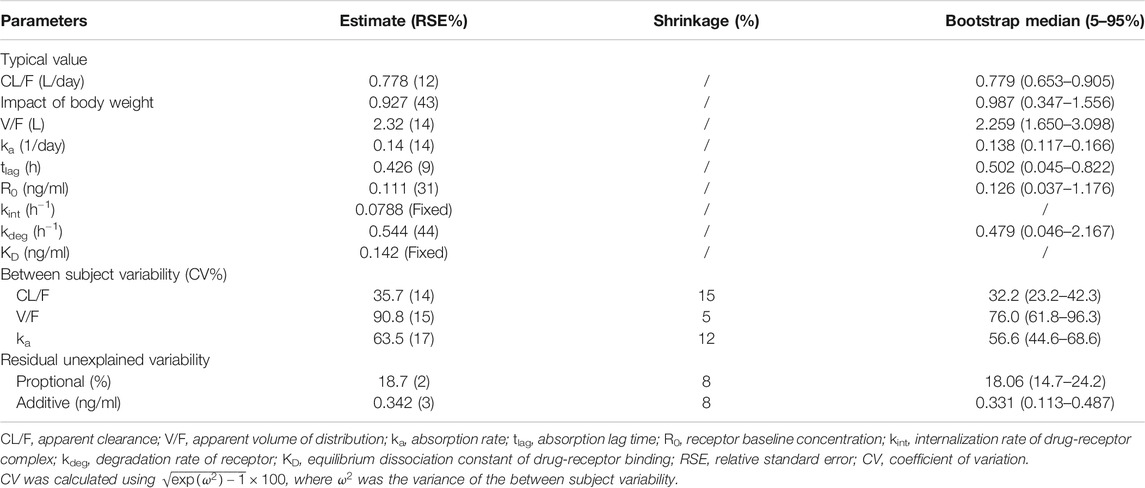
TABLE 2. Parameter estimates of the final model and bootstrap evaluation.
Model Evaluation
The GOF of the final model was evaluated graphically (Figure 4). Overall, scatterplots of observations vs. population or individual predictions indicated that the model adequately described the observations over their entire range. The conditional weighted residuals did not show any obvious trends when plotted against the time or population predictions, indicating that the model was unbiased.
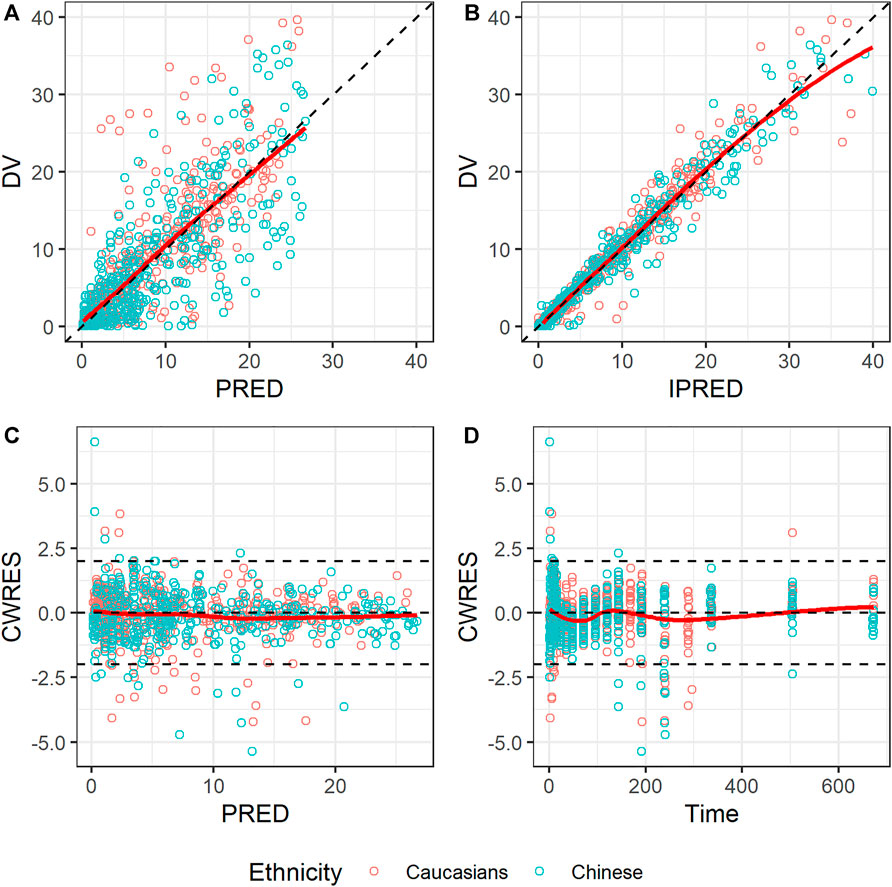
FIGURE 4. Goodness-of-fit plots for the final model. (A) Observed concentration (DV) vs. population prediction (PRED); (B) DV vs. individual prediction (IPRED); (C) Conditional weighted residual (CWRES) vs. time; (D) CWRES vs. PRED. Red points represent Caucasian population; blue points represent Chinese population; black dashed lines represent reference lines; red solid lines represent loess splines.
A prediction-corrected VPC (pc-VPC) (Bergstrand et al., 2011) was used because of the various dose levels included in this study. The pc-VPC for the final model is shown in Figure 5. In each time period, the 10th, 50th, and 90th percentiles of the observations largely matched the corresponding percentiles of the simulated values.
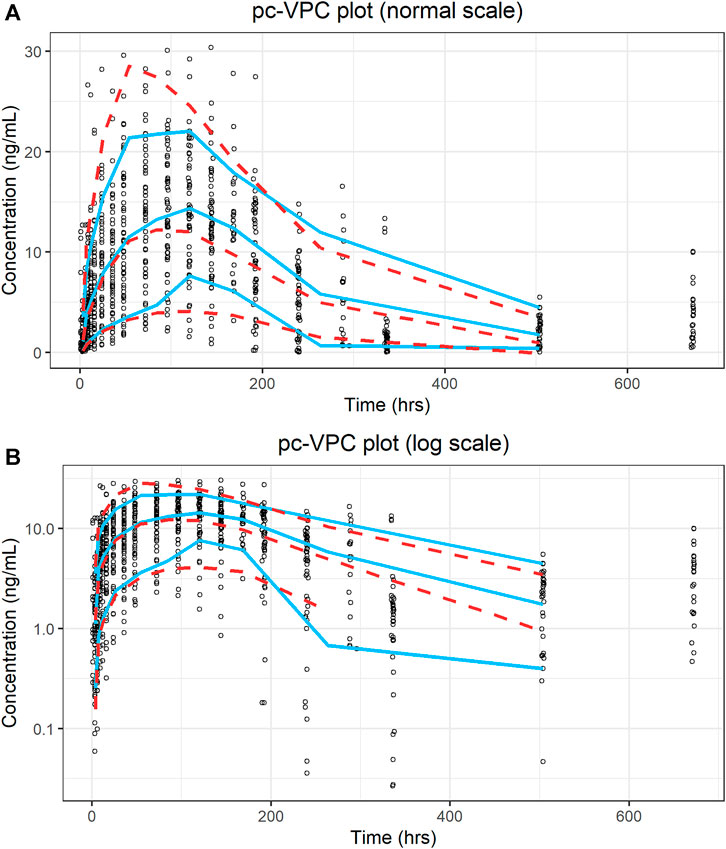
FIGURE 5. Prediction-corrected visual predictive check plot for the final model. (A) Ordinary coordinate; (B) Semi-logarithmic coordinate. Blue solid lines represent the 10th, 50th, and 90th percentiles of the observations; red dashed lines represent the 10th, 50th, and 90th percentiles of the simulated values.
The non-parametric bootstrapping results are listed in Table 2. The parameter estimates of the final model were within the 90% confidence intervals derived from the bootstrap analysis, and all estimates were close to the bootstrap median. Moreover, the successful estimation rate of the bootstrap was 80%, indicating that the final model was stable.
Simulation
As no obvious PK differences were observed for ropeginterferon alfa-2b between Caucasian and Chinese individuals, and body weight was the only significant factor affecting clearance, two virtual populations were generated by resampling Caucasian and Chinese subjects based on body weight. At 100 μg Q2W, the 80% intervals of the AUCss were 1,867–11,595 ng h/ml in Caucasian subjects and 2,231–13,403 ng h/ml in Chinese subjects. At 200 μg Q2W, the 80% intervals of the AUCss were 3,776–14,890 ng h/ml and 4,384–16,922 ng h/ml for Caucasian and Chinese subjects, respectively. As shown in Figure 6, although the AUCss of the Chinese population was slightly higher than that of the Caucasian population, the distributions of the two groups were very similar. The simulations indicate that a similar exposure could be obtained if Chinese populations were administered the same dose regimen as Caucasians.
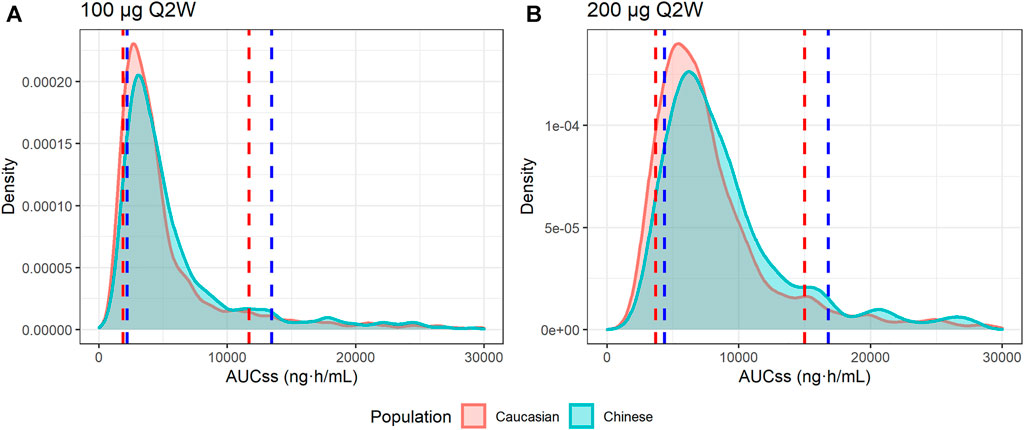
FIGURE 6. Distributions of the simulated AUC at steady state (AUCss). (A) AUCss of 100 μg every 2 weeks (Q2W); (B) AUCss of 200 μg Q2W. The red area and red dashed lines represent the distribution and 10th and 90th quantiles of the AUCss of Caucasian virtual subjects, respectively. The blue area and blue dashed lines represent the distribution and 10th and 90th quantiles of AUCss of Chinese virtual subjects, respectively.
Discussion
We developed the first population PK model of repeginterferon alfa-2b using pooled data to investigate the nonlinear PKs and quantify the potential ethnic difference between Caucasians and Chinese populations. The TMDD model was employed because it has a more mechanistic focus and has better fitness than the empirical MM model. As shown in Eq. 8, ropeginterferon alfa-2b underwent a combination of nonspecific linear elimination (
Target binding resulting in nonlinear PKs is common for IFNs, and has been reported for INF-β 1a (Mager and Jusko, 2001), IFN-β 1b, and IFN-α 2a (Kagan et al., 2010). However, the TMDD model was not employed to describe the PK of PEG-Intron® (Jen et al., 2001) or Pegasys® (Saleh, 2017) in patients with hepatitis C, which could be attributed to the narrow dose ranges used in these previous studies. The data for model building of PEG-Intron® had three dose levels (0.5, 1, 1.5 μg/kg), and a time-varying clearance model was used. Pegasys® had just one dose (180 μg) and a linear PK elimination model was used. In this study, six dose levels were administrated. The large dose ranges make the dose-dependent PK easily identified.
The median linear CL/F was 0.778 L/day for 70-kg subjects, much lower than the reported value of 31.5 L/day in patients with hepatitis C administered PEG-Intron® (Jen et al., 2001), and close to 1.12 L/day in male patients and 0.83 L/day in female patients receiving Pegasys® (Saleh, 2017). The varied clearances of these three long-acting IFNs might be due to differences in their PEGylated moieties. The PEGylated moieties of both ropeginterferon alfa-2b and Pegasys® are approximately 40 kDa, whereas that of PEG-Intron® is 12 kDa. The BSV of ropeginterferon alfa-2b was 35.7%, compared with 40 and 45.9% for PEG-Intron® and Pegasys®, respectively. Since all subjects in this study were healthy volunteers, further investigations need to be conducted in the patients.
Body weight was the only significant covariate affecting the PK of ropeginterferon alfa-2b in this study, and no remarkable ethnic differences were observed after adjusting for body weight. The clearance of ropeginterferon alfa-2b increased nonlinearly with body weight and was modeled using a power function with an exponential term of 0.927. The effect of body weight on CL/F was consistent with that of PEG-Intron® (Jen et al., 2001). The effect of body weight on the PK of Pegasys® has not been identified (Saleh, 2017).
Sex-based differences in CL/F were reported for Pegasys®, with higher CL/F in males than in females (Saleh, 2017); however, the reason is unknown. The hemoglobin level is a significant factor in the volume of distribution of Pegasys® (Saleh, 2017). However, an effect of hemoglobin levels on the volume of distribution could not be identified in this study, because all subjects were healthy volunteers with normal hemoglobin levels.
This study has a few limitations. Our data were obtained from two phase I clinical trials conducted in healthy subjects, which limits their extrapolation to other populations. In addition, only male Caucasian subjects were enrolled and the effect of sex was not fully investigated. Further investigations in larger populations, especially in patients, are warranted to confirm our results.
Conclusion
In this study, a population PK analysis was used to quantitatively compare the PKs of ropeginterferon alfa-2b between healthy Chinese and Caucasian subjects. No significant differences in the PK characteristics of ropeginterferon alfa-2b were observed between these populations. The simulation results showed that Chinese are expected to be associated with similar exposures as Caucasians under the same dose.
Data Availability Statement
The original contributions presented in the study are included in the article/Supplementary Material, further inquiries can be directed to the corresponding author.
Ethics Statement
The studies involving human participants were reviewed and approved by local ethics committees. The patients/participants provided their written informed consent to participate in this study.
Author Contributions
CRediT author statement. MZ: Methodology, Software, Writing-Original Draft, and Writing–Review and Editing M-xW: Investigation, and Writing–Review and Editing Z-rL: Software, Writing-Original Draft, and Writing–Review and Editing WW: Conceptualization, Resources, and Writing–Review and Editing XS: Conceptualization, Supervision, and Writing–Review and Editing ZJ: Conceptualization, Methodology, Writing-Original Draft, Supervision, and Writing–Review and Editing.
Conflict of Interest
The author WW is the employee of PharmaEssentia Biotechnology (Beijing) Limited and holds the stocks and shares in the company.
The remaining authors declare that the research was conducted in the absence of any commercial or financial relationships that could be construed as a potential conflict of interest.
Acknowledgments
We thank all the subjects and investigators involved in the clinical trials. We would like to thank Editage (www.editage.cn/) for English language editing.
Supplementary Material
The Supplementary Material for this article can be found online at: https://www.frontiersin.org/articles/10.3389/fphar.2021.673492/full#supplementary-material
References
Bergstrand, M., Hooker, A. C., Wallin, J. E., and Karlsson, M. O. (2011). Prediction-corrected Visual Predictive Checks for Diagnosing Nonlinear Mixed-Effects Models. AAPS J. 13 (2), 143–151. doi:10.1208/s12248-011-9255-z
Bocci, V. (1987). Metabolism of Protein Anticancer Agents. Pharmacol. Ther. 34 (1), 1–49. doi:10.1016/0163-7258(87)90090-8
Bottomley, A., Coens, C., Suciu, S., Santinami, M., Kruit, W., Testori, A., et al. (2009). Adjuvant Therapy with Pegylated Interferon Alfa-2b versus Observation in Resected Stage III Melanoma: a Phase III Randomized Controlled Trial of Health-Related Quality of Life and Symptoms by the European Organisation for Research and Treatment of Cancer Melanoma Group. Jco 27 (18), 2916–2923. doi:10.1200/JCO.2008.20.2069
Chaturvedula, A. (2016). Re: Nonmem Question Regarding Condition Number [Online]. Available: https://www.cognigen.com/nmusers/2016-March/6131.html (Accessed February 27, 2021).
Denney, W., Duvvuri, S., and Buckeridge, C. (2015). Simple, Automatic Noncompartmental Analysis: The PKNCA R Package. J. Pharmacokinet. Pharmacodynamics 42, S65.
Dunne, A. (2011). Statistical Moments in Pharmacokinetics: Models and Assumptions. J. Pharm. Pharmacol. 45 (10), 871–875. doi:10.1111/j.2042-7158.1993.tb05611.x
EMA (2021).Besremi [Online]. Available: https://www.ema.europa.eu/en/medicines/human/EPAR/besremi (Accessed February 27, 2021).
EMA (2019).Besremi-epar-public-assessment-report [Online]. Available: https://www.ema.europa.eu/en/documents/assessment-report/besremi-epar-public-assessment-report_en.pdf (Accessed February 27, 2021).
Foser, S., Weyer, K., Huber, W., and Certa, U. (2003). Improved Biological and Transcriptional Activity of Monopegylated Interferon-α-2a Isomers. Pharmacogenomics J. 3 (6), 312–319. doi:10.1038/sj.tpj.6500204
Foster, G. R. (2004). Pegylated Interferons: Chemical and Clinical Differences. Aliment. Pharmacol. Ther. 20 (8), 825–830. doi:10.1111/j.1365-2036.2004.02170.x
Genentech Inc (2002). PEGASYS® Package Insert [Online]. Available at: https://www.gene.com/download/pdf/pegasys_prescribing.pdf (Accessed February 27, 2021).
Gibiansky, L., Gibiansky, E., Kakkar, T., and Ma, P. (2008). Approximations of the Target-Mediated Drug Disposition Model and Identifiability of Model Parameters. J. Pharmacokinet. Pharmacodyn 35 (5), 573–591. doi:10.1007/s10928-008-9102-8
Gisslinger, H., Zagrijtschuk, O., Buxhofer-Ausch, V., Thaler, J., Schloegl, E., Gastl, G. A., et al. (2015). Ropeginterferon Alfa-2b, a Novel IFNα-2b, Induces High Response Rates with Low Toxicity in Patients with Polycythemia Vera. Blood 126 (15), 1762–1769. doi:10.1182/blood-2015-04-637280
Husak, R., Goerdt, S., and Orfanos, C. E. (1997). Interferon Alfa Treatment of a Patient with Eosinophilic Cellulitis and HIV Infection. N. Engl. J. Med. 337 (9), 641–642. doi:10.1056/NEJM199708283370917
Illés, Á., Pinczés, L. I., and Egyed, M. (2020). A Pharmacokinetic Evaluation of Ropeginterferon Alfa-2b in the Treatment of Polycythemia Vera. Expert Opin. Drug Metab. Toxicol. 17, 3–7. doi:10.1080/17425255.2021.1839050
Janssen, H. L., van Zonneveld, M., Senturk, H., Zeuzem, S., Akarca, U. S., Cakaloglu, Y., et al. (2005). Pegylated Interferon Alfa-2b Alone or in Combination with Lamivudine for HBeAg-Positive Chronic Hepatitis B: a Randomised Trial. The Lancet 365 (9454), 123–129. doi:10.1016/S0140-6736(05)17701-0
Jen, J., Glue, P., Ezzet, F., Chung, C., Gupta, S. K., Jacobs, S., et al. (2001). Population Pharmacokinetic Analysis of Pegylated Interferon Alfa-2b and Interferon Alfa-2b in Patients with Chronic Hepatitis C. Clin. Pharmacol. Ther. 69 (6), 407–421. doi:10.1067/mcp.2001.115872
Kagan, L., Abraham, A. K., Harrold, J. M., and Mager, D. E. (2010). Interspecies Scaling of Receptor-Mediated Pharmacokinetics and Pharmacodynamics of Type I Interferons. Pharm. Res. 27 (5), 920–932. doi:10.1007/s11095-010-0098-6
Lixoft (2019).Simulx Version 2019R12 [Online]. Available: http://lixoft.com/products/simulx/(Accessed February 27, 2021).
Ma, P. (2012). Theoretical Considerations of Target-Mediated Drug Disposition Models: Simplifications and Approximations. Pharm. Res. 29 (3), 866–882. doi:10.1007/s11095-011-0615-2
Mager, D. E., and Jusko, W. J. (2001). General Pharmacokinetic Model for Drugs Exhibiting Target-Mediated Drug Disposition. J. Pharmacokinet. Pharmacodyn 28 (6), 507–532. doi:10.1023/a:1014414520282
Mager, D. E., and Krzyzanski, W. (2005). Quasi-equilibrium Pharmacokinetic Model for Drugs Exhibiting Target-Mediated Drug Disposition. Pharm. Res. 22 (10), 1589–1596. doi:10.1007/s11095-005-6650-0
Pedder, S. C. (2003). Pegylation of Interferon Alfa: Structural and Pharmacokinetic Properties. Semin. Liver Dis. 23 (1), 19–22. doi:10.1055/s-2003-41635
Rivero-Juarez, A., Lopez-Cortes, L. F., Girón-Gonzalez, J. A., Pineda, J. A., and Rivero, A. (2014). Grupo Andaluz para el Estudio de las Hepatitis Viricas de la Sociedad Andaluza de Enfermedades, I.Atazanavir-based therapy with pegylated interferon and ribavirin for patients with hepatitis C and HIV. Lancet Infect. Dis. 14 (1), 13–14. doi:10.1016/S1473-3099(13)70359-1
Saleh, M. I. (2017). A Bayesian Approach for Population Pharmacokinetic Modeling of Pegylated Interferon α-2a in Hepatitis C Patients. Clin. Pharmacokinet. 56 (11), 1369–1379. doi:10.1007/s40262-017-0527-3
Savic, R. M., and Karlsson, M. O. (2009). Importance of Shrinkage in Empirical Bayes Estimates for Diagnostics: Problems and Solutions. AAPS J. 11 (3), 558–569. doi:10.1208/s12248-009-9133-0
Schering Corporation (2001). Package Insert PEG-IntronTM.(Peginterferon alfa-2b) [Online]. Available: https://www.accessdata.fda.gov/drugsatfda_docs/label/2001/pegsche080701lb.html (Accessed February 27, 2021).
Vu, T., Ma, P., Chen, J. S., de Hoon, J., Van Hecken, A., Yan, L., et al. (2017). Pharmacokinetic-Pharmacodynamic Relationship of Erenumab (AMG 334) and Capsaicin-Induced Dermal Blood Flow in Healthy and Migraine Subjects. Pharm. Res. 34 (9), 1784–1795. doi:10.1007/s11095-017-2183-6
William Bachman (2003). [NMusers] from Ken Kowalski Re: Model Diagnostics [Online]. Available: https://www.cognigen.com/nonmem/nm/99may012003.html (Accessed February 27, 2021).
Wills, R. J. (1990). Clinical Pharmacokinetics of Interferons. Clin. Pharmacokinet. 19 (5), 390–399. doi:10.2165/00003088-199019050-00003
Yamaoka, K., Nakagawa, T., and Uno, T. (1978). Application of Akaike's Information Criterion (AIC) in the Evaluation of Linear Pharmacokinetic Equations. J. Pharmacokinet. Biopharmaceutics 6 (2), 165–175. doi:10.1007/BF01117450
Keywords: ropeginterferon alfa-2b, population pharmacokinetics, Chinese, Caucasian, nonlinear mixed effect modeling, ethnic difference, target-mediated drug disposition
Citation: Zhu M, Wang M-x, Li Z-r, Wang W, Su X and Jiao Z (2021) Population Pharmacokinetics of Ropeginterferon Alfa-2b: A Comparison Between Healthy Caucasian and Chinese Subjects. Front. Pharmacol. 12:673492. doi: 10.3389/fphar.2021.673492
Received: 27 February 2021; Accepted: 13 May 2021;
Published: 28 May 2021.
Edited by:
Sara Eyal, Hebrew University of Jerusalem, IsraelReviewed by:
Hea-young Cho, CHA University, South KoreaKit Wun Kathy Cheung, Genentech, Inc., San Francisco, CA, United States
Copyright © 2021 Zhu, Wang, Li, Wang, Su and Jiao. This is an open-access article distributed under the terms of the Creative Commons Attribution License (CC BY). The use, distribution or reproduction in other forums is permitted, provided the original author(s) and the copyright owner(s) are credited and that the original publication in this journal is cited, in accordance with accepted academic practice. No use, distribution or reproduction is permitted which does not comply with these terms.
*Correspondence: Zheng Jiao, jiaozhen@online.sh.cn