 Jae-Hyeok Lee
 Myung-Sik Lee
- 1Department of Neurology, Research Institute for Convergence of Biomedical Science and Technology, Pusan National University Yangsan Hospital, Pusan National University School of Medicine, Yangsan, South Korea
- 2Department of Neurology, Gangnam Severance Hospital, Yonsei University College of Medicine, Seoul, South Korea
Recent data suggest mechanistic links among perturbed iron homeostasis, oxidative stress, and misfolded protein aggregation in neurodegenerative diseases. Iron overload and toxicity toward dopaminergic neurons have been established as playing a role in the pathogenesis of Parkinson's disease (PD). Brain iron accumulation has also been documented in atypical parkinsonian syndromes (APS), mainly comprising multiple system atrophy (MSA), and progressive supranuclear palsy (PSP). Iron-sensitive magnetic resonance imaging (MRI) has been applied to identify iron-related signal changes for the diagnosis and differentiation of these disorders. Topographic patterns of widespread iron deposition in deep brain nuclei have been described as differing between patients with MSA and PSP and those with PD. A disease-specific increase of iron occurs in the brain regions mainly affected by underlying disease pathologies. However, whether iron changes are a primary pathogenic factor or an epiphenomenon of neuronal degeneration has not been fully elucidated. Moreover, the clinical implications of iron-related pathology in APS remain unclear. In this review study, we collected data from qualitative and quantitative MRI studies on brain iron accumulation in APS to identify disease-related patterns and the potential role of iron-sensitive MRI.
Introduction
Iron overload in the substantia nigra and its toxicity toward dopaminergic neurons has been suggested to play a key role in the pathogenesis of Parkinson's disease (PD) (1). Brain iron accumulation has also been repeatedly documented in atypical parkinsonian syndromes (APS), mainly comprising multiple system atrophy (MSA), and progressive supranuclear palsy (PSP). Pathological studies have shown that iron levels in the putamen, globus pallidus, and substantia nigra are higher in MSA patients than in PD and control patients, and resembles the levels found in PSP patients (2–4).
Iron-sensitive magnetic resonance imaging (MRI) has been applied to identify iron-related signal changes for the diagnosis and differentiation of these disorders. However, the clinical and pathogenic implications of iron-related pathology detected by MRI in APS remain unclear. In this review study, we collected data from qualitative and quantitative MRI studies on brain iron accumulation in APS to identify disease-related patterns and the potential role of iron-sensitive MRI.
Potential Pathogenic Mechanisms of Iron Accumulation in APS
Brain iron accumulation can be caused by several factors, such as impaired iron homoeostasis, neuroinflammation, and increased blood–brain barrier permeability (1). The key proteins associated with degenerative parkinsonism, α-synuclein and tau, are believed to play roles in iron homeostasis (5). α-synuclein is a cellular ferrireductase responsible for reducing ferric iron (Fe3+) to ferrous iron (Fe2+) (6). In the presence of functional tau, the export of ferrous iron in neurons is controlled by the binding of the amyloid precursor protein (APP) to tau, which results in the trafficking of the protein complex to the neuronal surface, where APP interacts with ferroportin (7). Changes in these proteins might result in altered cellular iron homeostasis (5).
Dysregulation of the proteins involved in iron homeostasis has been reported in APS patients. In PSP patients, the amount of ferritin, an iron-storing protein, has been reported to be considerably lower than that in control patients, which is the opposite trend of increasing iron burden (8). High levels of iron might exceed the iron-buffering capacity of complexes, such as neuromelanin and ferritin in the substantia nigra (1, 9). In MSA, an increase in ferritin iron coupled with a reduction in ferroportin expression has been detected in the pons and putamen (10). These findings suggest a potential deficit in bioavailable iron despite an excess of tissue iron.
Impaired iron homeostasis can induce toxic protein oligomers and abnormal intracellular aggregates under pathological conditions. The aggregation of α-synuclein and tau has been shown to be triggered by iron in vitro (1). Iron promotes α-synuclein aggregation by inducing β-sheet conformational changes and increasing oxidative stress and microglial activation (4, 11). Abundant evidence has demonstrated the role of iron in tau hyperphosphorylation and aggregation into fibrils (12, 13).
In postmortem brain tissues, high concentrations of iron have been colocalized with α-synuclein and hyperphosphorylated tau aggregates. Notably, the highest iron content in the putamen, as assessed by histochemistry, is correlated with the highest density of glial cytoplasmic inclusions and α-synuclein aggregation in MSA brains (14). Hyperphosphorylated tau aggregates from the brains of PSP patients have been shown to colocalize with ferritin (15).
Iron overload in brain regions that undergo protein misfolding and aggregation can promote oxidative stress and neuroinflammation (4). In turn, iron-induced oxidative stress leads to apoptosis and ferroptosis, a novel mode of regulated cell death dependent on iron and lipid peroxidation (1, 16). Scavenging of accumulated labile iron by chelation can protect against iron-mediated neuronal damage (17).
Current MRI Methods for Detection and Quantification of Brain Iron
Iron-Sensitive MRI Techniques
Iron-sensitive MRI techniques have been used to differentiate parkinsonian disorders and monitor disease progression (18–20). Various methods have been used to study iron content, including R2 (1/T2), (1/), R′2 (1/), susceptibility weighted imaging (SWI), and quantitative susceptibility mapping (QSM) (20, 21). SWI enhances image contrast by using the susceptibility differences between tissues; images are obtained by combining T2*-weighted magnitude images with filtered phase images in the gradient echo data. SWI further enhances the contrast between tissues of different susceptibilities (22). Because of its high degree of sensitivity in detecting and visualizing iron deposition, SWI has been applied in the diagnosis and differentiation of parkinsonian disorders (23). However, SWI does not provide quantitative measurement of magnetic susceptibility, which is a limitation that has been addressed by the recent development of QSM (22, 23). Both QSM and the transverse relaxation rate (R2*) are highly sensitive and represent the most accurate measurement of iron content in the brain (20); results have been shown to correlate closely with iron concentrations measured in postmortem brain tissues (24, 25). QSM can also overcome the confounding effect of increased water content influencing relaxation values, thus counteracting the effect of increased iron levels (20). Recent studies have shown that QSM achieves stronger diagnostic performance than R2* for detecting iron deposition in the subcortical gray matter (26, 27). However, the opposite effect of myelin on QSM may impede its positive correlation with iron. A histological validation study found lower correlation coefficients for QSM and iron in white matter and cortical gray matter regions than in the basal ganglia when correlating R2* and iron (28).
Quantitative MRI Measurements of Brain Iron
The region-of-interest (ROI) method is commonly used to calculate regional iron content. The method is based on the manual or automated segmentation of target structures (29). Automated ROI analysis eliminates bias in the process of selecting images and drawing ROIs (30). Computer-based MRI analyses using machine learning techniques and support vector machine (SVM) classification have proven potential in the discrimination of parkinsonian syndromes and the tracking of disease progression (31, 32). SVM pattern recognition of SWI data can accurately discriminate PD from APS (32).
Focal or unevenly increased iron deposition should be considered in determining the iron concentration within a structure (23, 33). Single or two consecutive ROIs in two-dimensional images without delineation of the exact boundaries of a structure may not sufficiently reflect unevenly or focally increased iron content of the whole three-dimensional structure. Voxel-based analysis can provide additional information about the topographic distribution of sub-regional iron deposition (34).
The multimodal MRI approach combines MRI techniques for imaging iron and other MRI sequences that are sensitive to complementary tissue characteristics, including volume atrophy and microstructural damage (35). This approach may aid early diagnosis, monitoring of disease progression, and highlighting of pathogenic mechanisms (36, 37).
Iron-deposition Patterns in APS: the Determinants of Region Specificity
Age-Related and Structure-Specific Patterns
The regional distribution of iron is heterogeneous in normal adult brains. The basal ganglia have the highest iron concentrations, whereas low concentrations are detected in the cortical gray matter, white matter, brainstem, and cerebellum (1). Typically, total iron concentrations increase with age in the substantia nigra, putamen, globus pallidus, caudate nucleus, and cortices. However, the rate of iron accumulation varies among strictures throughout the adult life span (38, 39). For example, a previous study found high iron concentration in the globus pallidus regardless of age, but a significantly greater presence of iron in the putamen with advancing age (38). Regional heterogeneity of brain iron and its changes with age have been confirmed in vivo by MRI (1).
The region- or structure-specific pattern of iron deposition in normal aging can be enhanced in pathologic conditions. In the parkinsonian variant of MSA (MSA-P), iron deposition predominantly in the posterolateral part of the putamen is in line with the aging pattern (40, 41). The motor-related subcortical structures may present with different patterns in both volume and iron level. In previous MRI studies, the putamen demonstrated a decrease in volume and an increase in iron level, whereas the thalamus did not show iron deposition despite volume shrinkage (42, 43).
Pathoanatomy-Related Distribution
Total iron levels have been found to be elevated in most areas of the basal ganglia in the postmortem brain tissue of patients with APS (2). However, in vivo iron-sensitive MRI has shown topographical differences in excessive iron accumulation among the distinct subtypes of parkinsonism (23, 33, 34, 43–46). Significant increases in iron-related signals (SWI phase and QSM susceptibility) have been found in the midbrain and globus pallidus of patients with PSP, and in the putamen of patients with MSA (Figure 1) (34, 46).
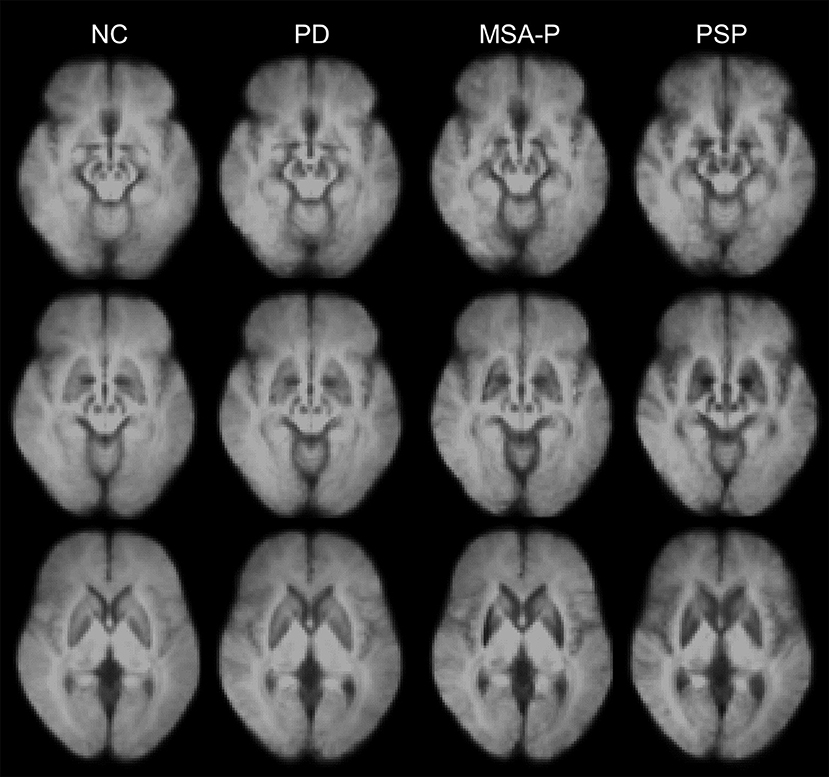
Figure 1. Disease-specific susceptibility weighted imaging maps generated using the mean images of normal control (NC), patients with Parkinson's disease (PD), the parkinsonian variant of multiple system atrophy (MSA-P), and progressive supranuclear palsy (PSP). The images were obtained from the Pusan National University Yangsan Hospital using protocols approved by the institutional review board. Written informed consent was obtained from all participants.
Regions of higher iron content are correlated with the main sites of underlying pathology. Increased iron in the putamen is the most consistent finding in MSA (23, 33, 34, 43–47), and specifically in MSA-P (48, 49), as well as being correlated with hypometabolism on 18F-flurodeoxyglucose positron-emission tomography (PET) (50). In a previous study, in vivo 18F-flortaucipir tau PET revealed that PSP patients had the highest overall uptake in the globus pallidus with the greatest discriminant power (51).
The multimodal MRI approach combining volumetry and iron estimation has shown that excessive iron accumulation is associated with advanced atrophy in a region-specific manner (4, 43, 49). R2* values are negatively correlated with volumes in the putamen and globus pallidus (43). In a longitudinal study, iron accumulation in the putamen increased in parallel with the extent of atrophy (49).
Uneven or Sub-structural Distribution
Iron distribution can be uneven across the entire structure of the brain. Iron concentrations in MSA-P are highest in the posterolateral subregion of the putamen (33, 41, 44, 48). Sub-structural differences have also been demonstrated by voxel-based analysis (34, 43). A previous study reported significant increases in SWI hypointensity in the posterolateral putamen and adjacent lateral aspect of the globus pallidus in patients with MSA-P, and in the anterior and medial aspects of the globus pallidus in patients with PSP (34). Similarly, higher R2* values have been reported in more atrophic sub-regions (43). In MSA-P, increases in R2* values in the putamen and globus pallidus have been noted more posteriorly and dorsally than those in PSP.
Conventional MRI techniques are insufficient to delineate the inner structure of the substantia nigra and measure the loss of melanized dopaminergic neurons and the increase of iron deposition (52). Recently, iron-sensitive MRI sequences at high field strengths have been reported to consistently display a hyperintense ovoid area within the dorsolateral border of the otherwise hypointense substantia nigra pars compacta, which is referred to as dorsolateral nigral hyperintensity (53–55). A postmortem 9.4 T MRI study with histopathological correlation indicated that this MRI feature corresponds to nigrosome-1 (56). Loss of dorsolateral nigral hyperintensity, a typical finding for patients with PD, is also observed in the majority of patients with MSA or PSP (53–55).
Clinical Implications of Brain Iron Deposition in APS
Discriminant Markers
Distinctive patterns of iron deposition detected on iron-sensitive MRI can be used in clinical practice to differentiate PD, MSA, and PSP (see Table 1). Patients with PSP have more widespread iron deposition in the motor-related subcortical nuclei than patients with other parkinsonian disorders (Figure 1) (34, 61). In receiver operating characteristic (ROC) analyses, the putamen has been consistently demonstrated to have the highest area under the curve (AUC) values (~0.8–0.9) in differentiating MSA-p from PSP and PD (34, 45, 46, 58, 59, 63). Furthermore, the red nucleus and globus pallidus are the two most valuable nuclei in the diagnosis of PSP (34, 46). However, direct comparisons among studies are difficult because of differences in patient characteristics (e.g., clinical severity and clinical subtypes) and methodology (e.g., MRI parameters, selected brain structures, and analysis methods) (31). The role of iron-sensitive MRI in other APS, such as diffuse Lewy body disease and corticobasal degeneration, has not yet been determined.
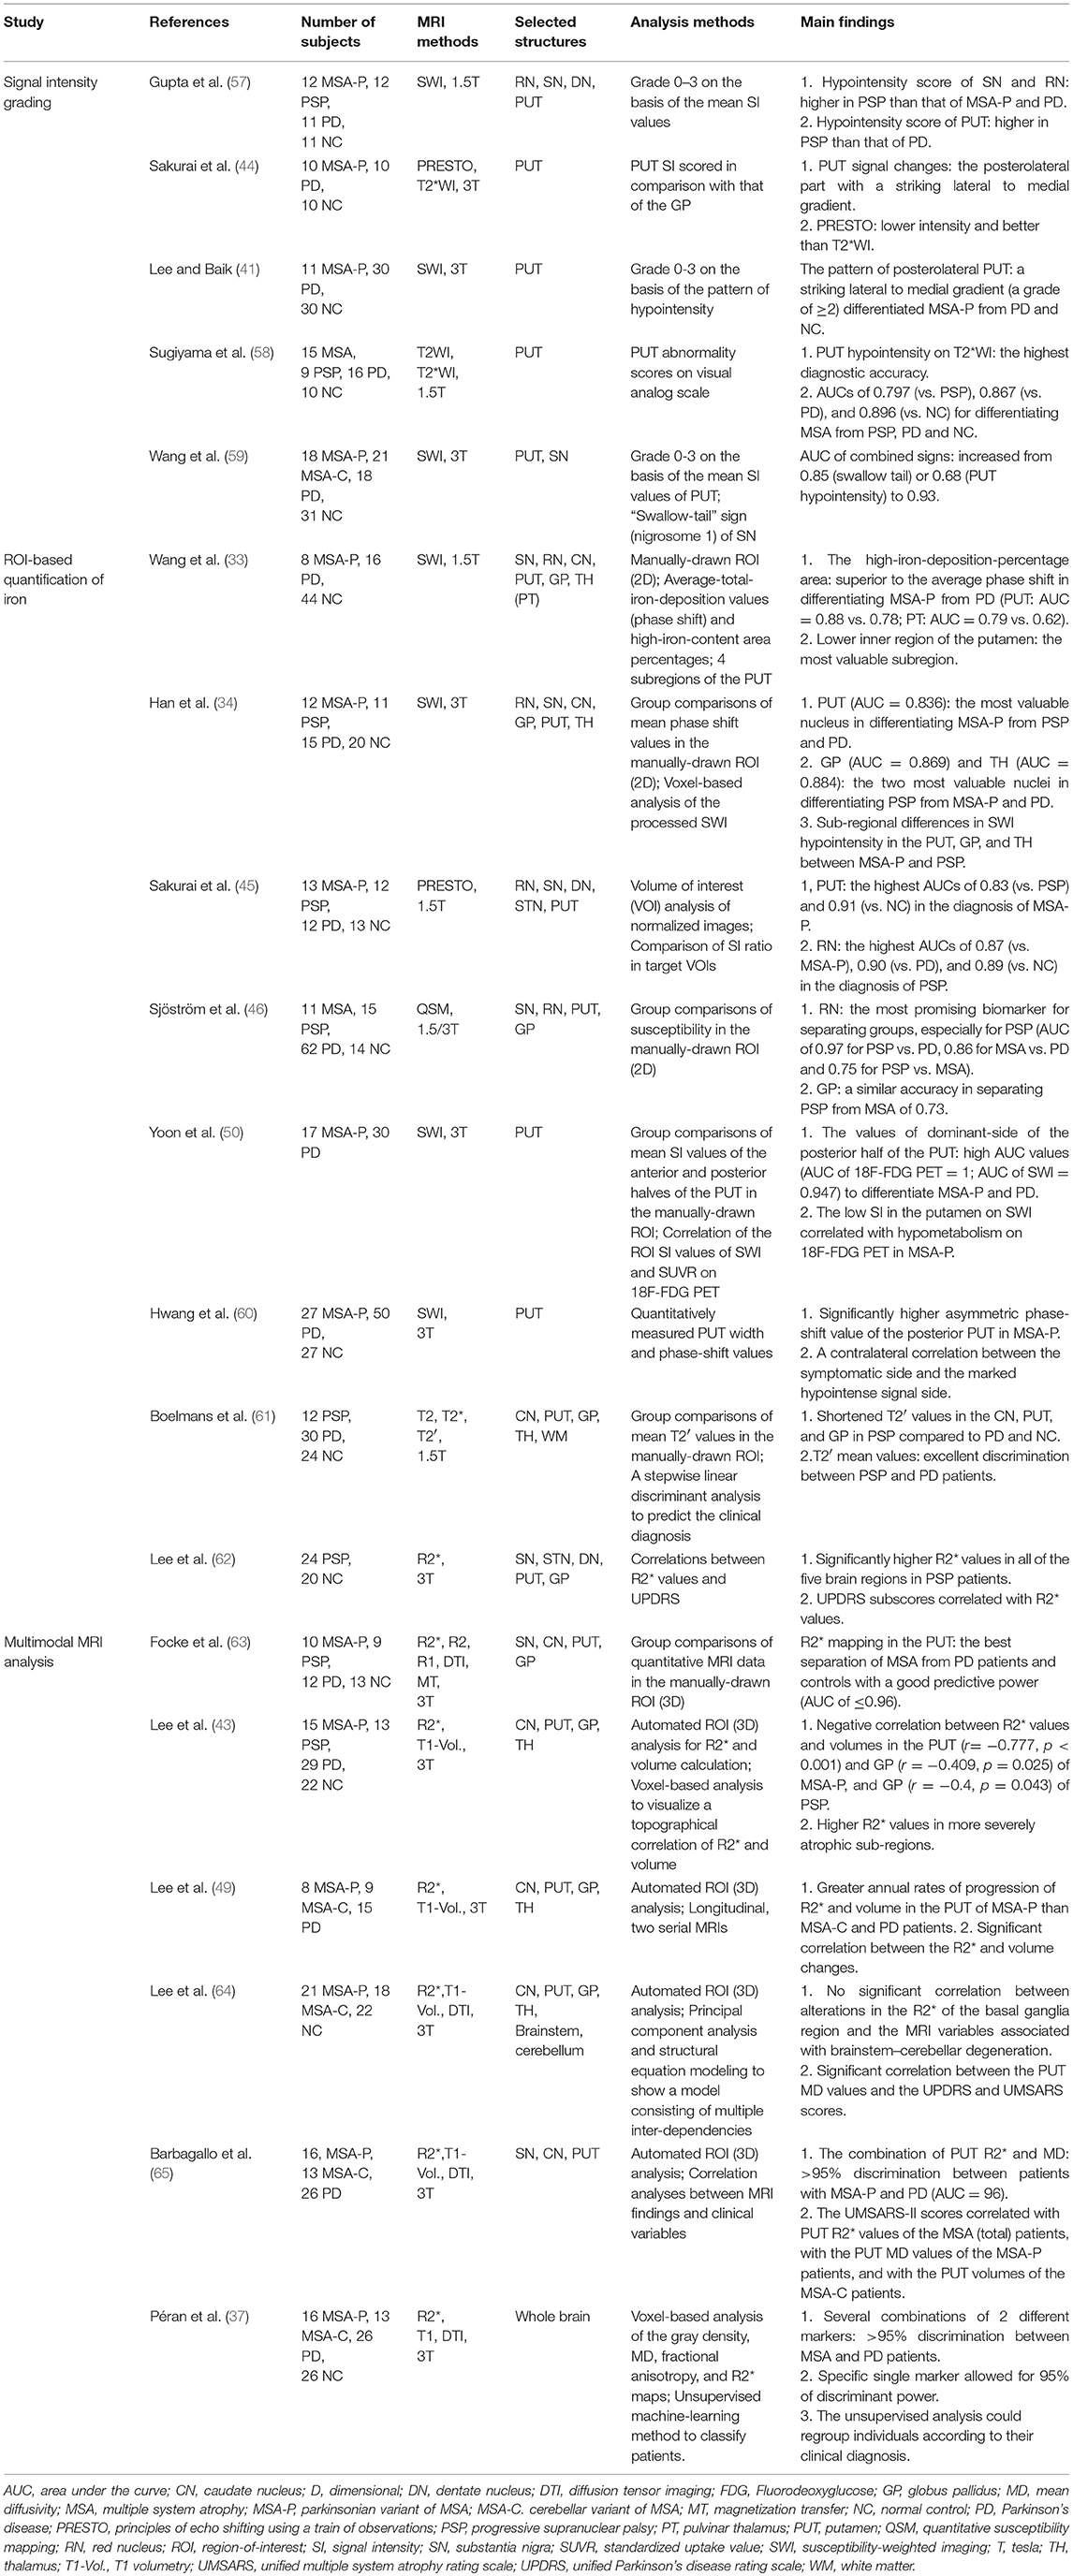
Table 1. Summary of studies using iron-sensitive MRI in atypical parkinsonian syndromes.
SWI can provide improved diagnostic accuracy through assessment of the degree and distribution of hypointensity in the putamen using a visual rating scale (Supplementary Figure 1) (41). A pattern of posterolateral putaminal hypointensity with a striking lateral-to-medial gradient on SWI is a highly specific sign of MSA-P (Supplementary Figures 1D–F). However, grading of putaminal hypointensity focused only on the signal intensity without consideration of the distributional pattern fails to differentiate MSA-P from PD (57). Slit-like hypointensity along the lateral margin of the putamen or evenly distributed hypointensity throughout the putamen can be a nonspecific and age-related sign of physiological mineralization (Supplementary Figures 1A–C) (40, 41). Compared with SWI, T2- or T2*-weighted images have limited diagnostic value with lower sensitivity (66, 67).
Because of uneven and focal accumulation of iron within the structure of the brain, subregional analyses could have higher diagnostic value than total average iron calculations (33). The posterior and inner subregion of the putamen is the most valuable among four subregional ROIs in differentiating MSA-P from PD. Moreover, high iron deposition percentages can be used to detect smaller increases in iron with higher sensitivity than average SWI phase shifts.
Multimodal MRI can identify specific markers to discriminate patients with PD from patients with MSA with high accuracy (37). The combination of T2* relaxation rates and mean diffusivity (MD) in the putamen achieves discrimination of >95% between patients with MSA-P and PD (65).
Clinical Correlates
Increased iron content in motor-related subcortical nuclei may be associated with the severity of parkinsonian motor deficits. Nigral iron accumulation in PD correlated with symptoms linked to dopaminergic neurodegeneration (68). A recent study identified a significant correlation between Unified MSA Rating Scale II scores and putaminal R2* values in patients with MSA (65). The phase-shift value of the posterior aspect of the putamen has demonstrated significantly higher asymmetry in MSA-P patients than in PD patients (60). These findings are frequently detected in the contralateral symptomatic side of patients.
In a recent study of correlations between R2* values and the degree of Unified Parkinson's Disease Rating Scale scores in PSP, the burden of iron-related PSP pathologies in the lenticular nucleus was associated with the severity of rigidity, and nigro-striato-pallidal and dentate iron content were associated with the severity of tremors (62). Other studies have failed to show a correlation of iron-sensitive MRI markers with clinical severity scale scores in MSA and PSP (34, 43, 49, 64), but have instead reported that diffusion tensor metrics, such as MD values, are closely correlated with clinical severity (63, 64). Iron-sensitive MRI markers may have less sensitivity to reflect clinical status than diffusion tensor metrics.
Structural MRI abnormalities in MSA are segregated into basal ganglia and brainstem-cerebellar factors (64). Alterations in the R2* of the basal ganglia region are not significantly correlated with the MRI variables associated with brainstem-cerebellar degeneration. In a longitudinal study, a higher rate of iron accumulation was observed in the putamen of MSA-P patients compared to patients with the cerebellar variant of MSA and PD (49). These findings may underlie the stratification of the motor subtype of MSA. Thus, far, no attempt has been made to correlate regional iron deposition with the severity of motor deficits according to the subtypes of PSP.
A recent post-hoc analysis demonstrated that MSA-specific MRI abnormalities are associated with more rapid progression and worse overall prognosis (69). In a longitudinal study, greater baseline iron content in the putamen was correlated with smaller volumes at follow-up in MSA patients (49). Similarly, accumulation of iron in the putamen predicts volume loss in healthy older adults (70). Excessive iron accumulation in the putamen may serve as a marker for impending progression of neurodegeneration in MSA.
Current Limitations and Future Directions
Although recent data suggest a mechanistic link between perturbed iron homeostasis, oxidative stress, and misfolded protein aggregation, whether iron accumulation is a primary pathogenic factor or an epiphenomenon of neuronal degeneration remains to be elucidated. In a single case report, putaminal iron deposition preceded the occurrence of the initial symptoms of MSA-P (71). However, when iron deposition appears during the course of disease is unknown. A longitudinal study on the relationship between multimodal MRI abnormalities at earlier stages of the disease is necessary to identify the spatiotemporal patterns of iron-related neurodegeneration.
High-field MRI developments have advanced the ability to map the distribution of iron in vivo (1). However, studies that have investigated the pathological correlates of iron-sensitive MRI measurements are rare. Signal hypointensities observed using T2 or T2* methods are correlated with iron deposits (Fe3+) and ferritin in histologic analysis (8, 48, 72). A recent study showed that R2* is significantly associated with nigral α-synuclein. Iron-sensitive MRI may capture the pathological aspects of disorders other than iron (73). Further research is needed to verify the exact underlying pathology of MRI signal alterations.
Conclusion
A distinctive pattern of iron deposition in MSA and PSP has been described. We highlighted the main factors that can determine region specificity. Disease-specific increases of iron occur in the brain regions mainly affected by underlying disease pathologies. Therefore, in vivo MRI mapping of brain iron deposition may serve as an indirect marker of neurodegenerative changes in pathoanatomically relevant sites. Age-related, structure-specific, and sub-structural patterns of iron accumulation should be considered when investigating iron-related neurodegeneration using MRI.
Author Contributions
All authors listed have made a substantial, direct and intellectual contribution to the work, and approved it for publication.
Funding
This research was supported by a grant of the Korea Health Technology R& Project through the Korea Health Industry Development Institute (KHIDI), funded by the Ministry of Health & Welfare, Republic of Korea (grant number: HI18C0713).
Conflict of Interest Statement
The authors declare that the research was conducted in the absence of any commercial or financial relationships that could be construed as a potential conflict of interest.
Supplementary Material
The Supplementary Material for this article can be found online at: https://www.frontiersin.org/articles/10.3389/fneur.2019.00074/full#supplementary-material
References
1. Ward RJ, Zucca FA, Duyn JH, Crichton RR, Zecca L. The role of iron in brain ageing and neurodegenerative disorders. Lancet Neurol. (2014) 13:1045–60. doi: 10.1016/S1474-4422(14)70117-6
2. Dexter DT, Carayon A, Javoy-Agid F, Agid Y, Wells FR, Daniel SE, et al. Alterations in the levels of iron, ferritin and other trace metals in Parkinson's disease and other neurodegenerative diseases affecting the basal ganglia. Brain (1991) 114:1953–75.
3. Jellinger KA. Neuropathological spectrum of synucleinopathies. Mov Disord. (2003) 18:2–12. doi: 10.1002/mds.10557
4. Kaindlstorfer C, Jellinger KA, Eschlböck S, Stefanova N, Weiss G, Wenning GK. The relevance of iron in the pathogenesis of multiple system atrophy: a viewpoint. J Alzheimers Dis. (2018) 61:1253–73. doi: 10.3233/JAD-170601
5. Angelova DM, Brown DR. Iron, aging, and neurodegeneration. Metals (2015) 5:2070–92. doi: 10.3390/met5042070
6. Davies P, Moualla D, Brown DR. Alpha-synuclein is a cellular ferrireductase. PLoS ONE (2011) 6:e15814. doi: 10.1371/journal.pone.0015814
7. Stankowski JN, Dawson VL, Dawson TM. Ironing out tau's role in parkinsonism. Nat Med. (2012) 18:197–8. doi: 10.1038/nm.2668
8. Foroutan P, Murray ME, Fujioka S, Schweitzer KJ, Dickson DW, Wszolek ZK, et al. Progressive supranuclear palsy: high-field-strength MR microscopy in the human substantia nigra and globus pallidus. Radiology (2013) 266:280–8. doi: 10.1148/radiol.12102273
9. Zucca FA, Segura-Aguilar J, Ferrari E, Muñoz P, Paris I, Sulzer D, et al. Interactions of iron, dopamine and neuromelanin pathways in brain aging and Parkinson's disease. Prog Neurobiol. (2017) 155:96–119. doi: 10.1016/j.pneurobio.2015.09.012.
10. Visanji NP, Collingwood JF, Finnegan ME, Tandon A, House E, Hazrati LN. Iron deficiency in parkinsonism: region-specific iron dysregulation in Parkinson's disease and multiple system atrophy. J Parkinsons Dis. (2013) 3:523–37. doi: 10.3233/JPD-130197
11. Ostrerova-Golts N, Petrucelli L, Hardy J, Lee JM, Farer M, Wolozin B. The A53T alpha-synuclein mutation increases iron-dependent aggregation and toxicity. J Neurosci. (2000) 20:6048–54. doi: 10.1523/JNEUROSCI.20-16-06048.2000
12. Kim AC, Lim S, Kim YK. Metal ion effects on Aβ and tau aggregation. Int J Mol Sci. (2018) 19:128. doi: 10.3390/ijms19010128
13. Yamamoto A, Shin RW, Hasegawa K, Naiki H, Sato H, Yoshimasu F, et al. Iron (III) induces aggregation of hyperphosphorylated tau and its reduction to iron (II) reverses the aggregation: implications in the formation of neurofibrillary tangles of Alzheimer's disease. J Neurochem. (2002) 82:1137–47. doi: 10.1046/j.1471-4159.2002.t01-1-01061.x
14. Jellinger KA. Neuropathology of multiple system atrophy: new thoughts about pathogenesis. Mov Disord. (2014) 29:1720–41. doi: 10.1002/mds.26052
15. Pérez M, Valpuesta JM, de Garcini EM, Quintana C, Arrasate M, López Carrascosa JL, et al. Ferritin is associated with the aberrant tau filaments present in progressive supranuclear palsy. Am J Pathol. (1998) 152:1531–9.
16. Masaldan S, Bush AI, Devos D, Rolland AS, Moreau C. Striking while the iron is hot: Iron metabolism and ferroptosis in neurodegeneration. Free Radic Biol Med. (2018). doi: 10.1016/j.freeradbiomed.2018.09.033. [Epub ahead of print].
17. Devos D, Moreau C, Devedjian JC, Kluza J, Petrault M, Laloux C, et al. Targeting chelatable iron as a therapeutic modality in Parkinson's disease. Antioxid Redox Signal (2014) 21:195–210. doi: 10.1089/ars.2013.5593.
18. Pietracupa S, Martin-Bastida A, Piccini P. Iron metabolism and its detection through MRI in parkinsonian disorders: a systematic review. Neurol Sci. (2017) 38:2095–101. doi: 10.1007/s10072-017-3099-y
19. Lehericy S, Vaillancourt DE, Seppi K, Monchi O, Rektorova I, Antonini A, et al. The role of high-field magnetic resonance imaging in parkinsonian disorders: Pushing the boundaries forward. Mov Disord. (2017) 32:510–25. doi: 10.1002/mds.26968
20. Yan F, He N, Lin H, Li R. Iron deposition quantification: Applications in the brain and liver. J Magn Reson Imag. (2018) 48:301–17. doi: 10.1002/jmri.26161
21. Ghassaban K, Liu S, Jiang C, Haacke EM. Quantifying iron content in magnetic resonance imaging. Neuroimage (2018). doi: 10.1016/j.neuroimage.2018.04.047. [Epub ahead of print].
22. Liu C, Li W, Tong KA, Yeom KW, Kuzminski S. Susceptibility-weighted imaging and quantitative susceptibility mapping in the brain. J Magn Reson Imag. (2015) 42:23–41. doi: 10.1002/jmri.24768
23. Wang Z, Luo XG, Gao C. Utility of susceptibility-weighted imagingin Parkinson's disease and atypical Parkinsonian disorders. Transl Neurodegener (2016) 5:17. doi: 10.1186/s40035-016-0064-2
24. Langkammer C, Krebs N, Goessler W, Scheurer E, Ebner F, Yen K, et al. Quantitative MR imaging of brain iron: a postmortem validation study. Radiology (2010) 257:455–62. doi: 10.1148/radiol.10100495
25. Sun H, Walsh AJ, Lebel RM, Blevins G, Catz I, Lu JQ, et al. Validation of quantitative susceptibility mapping with Perls' iron staining for subcortical gray matter. Neuroimage (2015) 105:486–92. doi: 10.1016/j.neuroimage.2014.11.010
26. Barbosa JH, Santos AC, Tumas V, Liu M, Zheng W, Haacke EM, et al. Quantifying brain iron deposition in patients with Parkinson's disease using quantitative susceptibility mapping, R2 and R2*. Magn Reson Imag. (2015) 33:559–65. doi: 10.1016/j.mri.2015.02.021
27. Murakami Y, Kakeda S, Watanabe K, Ueda I, Ogasawara A, Moriya J, et al. Usefulness of quantitative susceptibility mapping for the diagnosis of Parkinson disease. Am J Neuroradiol. (2015) 36:1102–8. doi: 10.3174/ajnr.A4260
28. Hametner S, Endmayr V, Deistung A, Palmrich P, Prihoda M, Haimburger E, et al. The influence of brain iron and myelin on magnetic susceptibility and effective transverse relaxation - A biochemical and histological validation study. Neuroimage (2018) 179:117–33. doi: 10.1016/j.neuroimage.2018.06.007
29. Despotović I, Goossens B, Philips W. MRI segmentation of the human brain: challenges, methods, and applications. Comput Math Methods Med. (2015) 2015:450341. doi: 10.1155/2015/450341
30. Smith SM1, Jenkinson M, Woolrich MW, Beckmann CF, Behrens TE, Johansen-Berg H, et al. Advances in functional and structural MR image analysis and implementation as FSL. Neuroimage (2004) 23:S208–19. doi: 10.1016/j.neuroimage.2004.07.051
31. Kassubek J. MRI-based neuroimaging: atypical parkinsonisms and other movement disorders. Curr Opin Neurol. (2018) 31:425–30. doi: 10.1097/WCO.0000000000000578
32. Haller S, Badoud S, Nguyen D, Barnaure I, Montandon ML, Lovblad KO, et al. Differentiation between Parkinson disease and other forms of Parkinsonism using support vector machine analysis of susceptibility-weighted imaging (SWI): initial results. Eur Radiol. (2013) 23:12–9. doi: 10.1007/s00330-012-2579-y
33. Wang Y, Butros SR, Shuai X, Dai Y, Chen C, Liu M, et al. Different iron-deposition patterns of multiple system atrophy with predominant parkinsonism and idiopathetic Parkinson diseases demonstrated by phase-corrected susceptibility-weighted imaging. Am J Neuroradiol. (2012) 33:266–73. doi: 10.3174/ajnr.A2765
34. Han YH, Lee JH, Kang BM, Mun CW, Baik SK, Shin YI, et al. Topographical differences of brain iron deposition between progressive supranuclear palsy and parkinsonian variant multiple system atrophy. J Neurol Sci. (2013) 325:29–35. doi: 10.1016/j.jns.2012.11.009
35. Cerasa A, Cherubini A, Peran P. Multimodal MRI in neurodegenerative disorders. Neurol Res Int. (2012) 2012:287891. doi: 10.1155/2012/287891
36. Péran P, Cherubini A, Assogna F, Piras F, Quattrocchi C, Peppe A, et al. Magnetic resonance imaging markers of Parkinson's disease nigrostriatal signature. Brain (2010) 133:3423–33. doi: 10.1093/brain/awq212
37. Péran P, Barbagallo G, Nemmi F, Sierra M, Galitzky M, Traon AP, et al. MRI supervised and unsupervised classification of Parkinson's disease and multiple system atrophy. Mov Disord. (2018) 33:600–8. doi: 10.1002/mds.27307
38. Pfefferbaum A, Adalsteinsson E, Rohlfing T, Sullivan EV. MRI estimates of brain iron concentration in normal aging: comparison of field-dependent (FDRI) and phase (SWI) methods. Neuroimage (2009) 47:493–500. doi: 10.1016/j.neuroimage.2009.05.006
39. Bilgic B, Pfefferbaum A, Rohlfing T, Sullivan EV, Adalsteinsson E. MRI estimates of brain iron concentration in normal aging using quantitative susceptibility mapping. Neuroimage (2012) 59:2625–35. doi: 10.1016/j.neuroimage.2011.08.077
40. Harder SL, Hopp KM, Ward H, Neglio H, Gitlin J, Kido D. Mineralization of the deep gray matter with age: a retrospective review with susceptibility-weighted MR imaging. Am J Neuroradiol. (2008) 29:176–83. doi: 10.3174/ajnr.A0770
41. Lee JH, Baik SK. Putaminal hypointensity in the parkinsonian variant of multiple system atrophy: simple visual assessment using susceptibility-weighted imaging. J Mov Disord. (2011) 4:60–3. doi: 10.14802/jmd.11012
42. Péran P, Cherubini A, Luccichenti G, Hagberg G, Démonet JF, Rascol O, et al. Volume and iron content in basal ganglia and thalamus. Hum Brain Mapp. (2009) 30:2667–75. doi: 10.1002/hbm.20698
43. Lee JH, Han YH, Kang BM, Mun CW, Lee SJ, Baik SK. Quantitative assessment of subcortical atrophy and iron content in progressive supranuclear palsy and parkinsonian variant of multiple system atrophy. J Neurol. (2013) 260:2094–101. doi: 10.1007/s00415-013-6951-x
44. Sakurai K, Kawaguchi T, Kawai T, Ogino H, Hara M, Okita K, et al. Usefulness of 3D-PRESTO imaging in evaluating putaminal abnormality in parkinsonian variant of multiple system atrophy. Neuroradiology (2010) 52:809–14. doi: 10.1007/s00234-009-0621-9
45. Sakurai K, Imabayashi E, Tokumaru AM, Ito K, Shimoji K, Nakagawa M, et al. Volume of interest analysis of spatially normalized PRESTO imaging to differentiate between parkinson disease and atypical parkinsonian syndrome. Magn Reson Med Sci. (2017) 16:16–22. doi: 10.2463/mrms.mp.2015-0132
46. Sjöström H, Granberg T, Westman E, Svenningsson P. Quantitative susceptibility mapping differentiates between parkinsonian disorders. Parkinsonism Relat Disord. (2017) 44:51–57. doi: 10.1016/j.parkreldis.2017.08.029
47. Ozawa T, Paviour D, Quinn NP, Josephs KA, Sangha H, Kilford L, et al. The spectrum of pathological involvement of the striatonigral and olivopontocerebellar systems in multiple system atrophy: clinicopathological correlations. Brain (2004) 127:2657–71. doi: 10.1093/brain/awh303
48. Matsusue E, Fujii S, Kanasaki Y, Sugihara S, Miyata H, Ohama E, et al. Putaminal lesion in multiple system atrophy: postmortem MR-pathological correlations. Neuroradiology (2008) 50:559–67. doi: 10.1007/s00234-008-0381-y
49. Lee JH, Kim TH, Mun CW, Kim TH, Han YH. Progression of subcortical atrophy and iron deposition in multiple system atrophy: a comparison between clinical subtypes. J Neurol. (2015) 262:1876–82. doi: 10.1007/s00415-015-7785-5
50. Yoon RG, Kim SJ, Kim HS, Choi CG, Kim JS, Oh J, et al. The utility of susceptibility-weighted imaging for differentiating Parkinsonism-predominant multiple system atrophy from Parkinson's disease: correlation with 18F-flurodeoxyglucose positron-emission tomography. Neurosci Lett. (2015) 584:296–301. doi: 10.1016/j.neulet.2014.10.046
51. Schonhaut DR, McMillan CT, Spina S, Dickerson BC, Siderowf A, Devous MD Sr, et al. 18F-flortaucipir tau positron emission tomography distinguishes established progressive supranuclear palsy from controls and Parkinson disease: a multicenter study. Ann Neurol. (2017) 82:622–34. doi: 10.1002/ana.25060
52. Cosottini M, Frosini D, Pesaresi I, Costagli M, Biagi L, Ceravolo R, et al. MR imaging of the substantia nigra at 7 T enables diagnosis of Parkinson disease. Radiology (2014) 271:831–8. doi: 10.1148/radiol.14131448
53. Reiter E, Mueller C, Pinter B, Krismer F, Scherfler C, Esterhammer R, et al. Dorsolateral nigral hyperintensity on 3.0T susceptibility-weighted imaging in neurodegenerative Parkinsonism. Mov Disord. (2015) 30:1068–76. doi: 10.1002/mds.26171
54. Bae YJ, Kim JM, Kim E, Lee KM, Kang SY, Park HS, et al. Loss of Nigral Hyperintensity on 3 Tesla MRI of Parkinsonism: comparison with (123) I-FP-CIT SPECT. Mov Disord. (2016) 31:684–92. doi: 10.1002/mds.26584
55. Mahlknecht P, Krismer F, Poewe W, Seppi K. Meta-analysis of dorsolateral nigral hyperintensity on magnetic resonance imaging as a marker for Parkinson's disease. Mov Disord. (2017) 32:619–23. doi: 10.1002/mds.26932
56. Massey LA, Miranda MA, Al-Helli O, Parkes HG, Thornton JS, So PW, et al. 9.4 T MR microscopy of the substantia nigra with pathological validation in controls and disease. Neuroimage Clin. (2016) 13:154–63. doi: 10.1016/j.nicl.2016.11.015
57. Gupta D, Saini J, Kesavadas C, Sarma PS, Kishore A. Utility of susceptibility-weighted MRI in differentiating Parkinson's disease and atypical parkinsonism. Neuroradiology (2010) 52:1087–94. doi: 10.1007/s00234-010-0677-6
58. Sugiyama A, Ito S, Suichi T, Sakurai T, Mukai H, Yokota H, et al. Putaminal hypointensity on T2*-weighted MR imaging is the most practically useful sign in diagnosing multiple system atrophy: a preliminary study. J Neurol Sci. (2015) 349:174–8. doi: 10.1016/j.jns.2015.01.013
59. Wang N, Yang H, Li C, Fan G, Luo X. Using 'swallow-tail' sign and putaminal hypointensity as biomarkers to distinguish multiple system atrophy from idiopathic Parkinson's disease: a susceptibility-weighted imaging study. Eur Radiol. (2017) 27:3174–80. doi: 10.1007/s00330-017-4743-x
60. Hwang I, Sohn CH, Kang KM, Jeon BS, Kim HJ, Choi SH, et al. Differentiation of parkinsonism-predominant multiple system atrophy from idiopathic parkinson disease using 3T susceptibility-weighted MR imaging, focusing on putaminal change and lesion asymmetry. Am J Neuroradiol. (2015) 36:2227–34. doi: 10.3174/ajnr.A4442
61. Boelmans K, Holst B, Hackius M, Finsterbusch J, Gerloff C, Fiehler J, et al. Brain iron deposition fingerprints in Parkinson's disease and progressive supranuclear palsy. Mov Disord. (2012) 27:421–7. doi: 10.1002/mds.24926
62. Lee SH, Lyoo CH, Ahn SJ, Rinne JO, Lee MS. Brain regional iron contents in progressive supranuclear palsy. Parkinsonism Relat Disord. (2017) 45:28–32. doi: 10.1016/j.parkreldis.2017.09.020
63. Focke NK, Helms G, Pantel PM, Scheewe S, Knauth M, Bachmann CG, et al. Differentiation of typical and atypical Parkinson syndromes by quantitative MR imaging. Am J Neuroradiol. (2011) 32:2087–92. doi: 10.3174/ajnr.A2865
64. Lee MJ, Kim TH, Mun CW, Shin HK, Son J, Lee JH. Spatial correlation and segregation of multimodal MRI abnormalities in multiple system atrophy. J Neurol. (2018) 265:1540–7. doi: 10.1007/s00415-018-8874-z
65. Barbagallo G, Sierra-Peña M, Nemmi F, Traon AP, Meissner WG, Rascol O, et al. Multimodal MRI assessment of nigro-striatal pathway in multiple system atrophy and Parkinson disease. Mov Disord. (2016) 31:325–34. doi: 10.1002/mds.26471
66. Feng JY, Huang B, Yang WQ, Zhang YH, Wang LM, Wang LJ, et al. The putaminal abnormalities on 3.0T magnetic resonance imaging: can they separate parkinsonism-predominant multiple system atrophy from Parkinson's disease? Acta Radiol. (2015) 56:322–8. doi: 10.1177/0284185114524090
67. Arabia G, Morelli M, Paglionico S, Novellino F, Salsone M, Giofrè L, et al. An magnetic resonance imaging T2*-weighted sequence at short echo time to detect putaminal hypointensity in Parkinsonisms. Mov Disord. (2010) 25:2728–34. doi: 10.1002/mds.23173
68. Martin-Bastida A, Lao-Kaim NP, Loane C, Politis M, Roussakis AA, Valle-Guzman N, et al. Motor associations of iron accumulation in deep grey matter nuclei in Parkinson's disease: a cross-sectional study of iron-related magnetic resonance imaging susceptibility. Eur J Neurol. (2017) 24:357–365. doi: 10.1111/ene.13208
69. Krismer F, Seppi K, Wenning GK, Papapetropoulos S, Abler V, Goebel G, et al. Abnormalities on structural MRI associate with faster disease progression in multiple system atrophy. Parkinsonism Relat Disord. (2018). doi: 10.1016/j.parkreldis.2018.08.004. [Epub ahead of print].
70. Daugherty AM, Raz N. Accumulation of iron in the putamen predicts its shrinkage in healthy older adults: a multi-occasion longitudinal study. Neuroimage (2016) 128:11–20. doi: 10.1016/j.neuroimage.2015.12.045
71. Kikuchi Y, Shibata M, Hirayanagi K, Nagashima K, Mihara B, Ikeda Y. Putaminal iron deposition precedes MSA-P onset by 2 years. Neurology (2018) 90:1071–72. doi: 10.1212/WNL.0000000000005637
72. Matsusue E, Fujii S, Kanasaki Y, Kaminou T, Ohama E, Ogawa T. Cerebellar lesions in multiple system atrophy: Postmortem MR imaging-pathologic correlations. Am J Neuroradiol. (2009) 30:1725–30. doi: 10.3174/ajnr.A1662
Keywords: iron, neurodegeneration, magnetic resonance imaging, atypical parkinsonian syndromes, multiple system atrophy, progressive supranuclear palsy
Citation: Lee J-H and Lee M-S (2019) Brain Iron Accumulation in Atypical Parkinsonian Syndromes: in vivo MRI Evidences for Distinctive Patterns. Front. Neurol. 10:74. doi: 10.3389/fneur.2019.00074
Received: 18 October 2018; Accepted: 21 January 2019;
Published: 12 February 2019.
Edited by:
Giorgio Biasiotto, Università degli Studi di Brescia, ItalyReviewed by:
Patrice Péran, Institut National de la Santé et de la Recherche Médicale (INSERM), FranceSara Pietracupa, Sapienza University of Rome, Italy
Copyright © 2019 Lee and Lee. This is an open-access article distributed under the terms of the Creative Commons Attribution License (CC BY). The use, distribution or reproduction in other forums is permitted, provided the original author(s) and the copyright owner(s) are credited and that the original publication in this journal is cited, in accordance with accepted academic practice. No use, distribution or reproduction is permitted which does not comply with these terms.
*Correspondence: Jae-Hyeok Lee, jhlee.neuro@pusan.ac.kr
Myung-Sik Lee, mslee@yuhs.ac