 Christoph Schneider1*
 Thimo Wiewelhove1
 Christian Raeder1
 Andrew A. Flatt2
 Olaf Hoos3
 Laura Hottenrott1
 Oliver Schumbera4
 Michael Kellmann5,6
 Tim Meyer7
 Mark Pfeiffer8
 Alexander Ferrauti1
- 1Department of Training and Exercise Science, Faculty of Sport Science, Ruhr University Bochum, Bochum, Germany
- 2Department of Health Sciences and Kinesiology, Biodynamics and Human Performance Center, Georgia Southern University, Savannah, GA, United States
- 3Center for Sports and Physical Education, Julius-Maximilians-University, Würzburg, Germany
- 4Hertha Berliner Sport-Club, Berlin, Germany
- 5Unit of Sport Psychology, Faculty of Sport Science, Ruhr University Bochum, Bochum, Germany
- 6School of Human Movement and Nutrition Sciences, The University of Queensland, St. Lucia, QLD, Australia
- 7Institute of Sports and Preventive Medicine, Saarland University, Saarbrücken, Germany
- 8Department Theory and Practice of Sports, Institute of Sport Science, Johannes Gutenberg University Mainz, Mainz, Germany
Objective: In two independent study arms, we determine the effects of strength training (ST) and high-intensity interval training (HIIT) overload on cardiac autonomic modulation by measuring heart rate (HR) and vagal heart rate variability (HRV).
Methods: In the study, 37 well-trained athletes (ST: 7 female, 12 male; HIIT: 9 female, 9 male) were subjected to orthostatic tests (HR and HRV recordings) each day during a 4-day baseline period, a 6-day overload microcycle, and a 4-day recovery period. Discipline-specific performance was assessed before and 1 and 4 days after training.
Results: Following ST overload, supine HR, and vagal HRV (Ln RMSSD) were clearly increased and decreased (small effects), respectively, and the standing recordings remained unchanged. In contrast, HIIT overload resulted in decreased HR and increased Ln RMSSD in the standing position (small effects), whereas supine recordings remained unaltered. During the recovery period, these responses were reversed (ST: small effects, HIIT: trivial to small effects). The correlations between changes in HR, vagal HRV measures, and performance were weak or inconsistent. At the group and individual levels, moderate to strong negative correlations were found between HR and Ln RMSSD when analyzing changes between testing days (ST: supine and standing position, HIIT: standing position) and individual time series, respectively. Use of rolling 2–4-day averages enabled more precise estimation of mean changes with smaller confidence intervals compared to single-day values of HR or Ln RMSSD. However, the use of averaged values displayed unclear effects for evaluating associations between HR, vagal HRV measures, and performance changes, and have the potential to be detrimental for classification of individual short-term responses.
Conclusion: Measures of HR and Ln RMSSD during an orthostatic test could reveal different autonomic responses following ST or HIIT which may not be discovered by supine or standing measures alone. However, these autonomic changes were not consistently related to short-term changes in performance and the use of rolling averages may alter these relationships differently on group and individual level.
Introduction
Efficient training provides sufficient exercise stimuli to enhance athletes' performance capacities while avoiding sustained non-functional overreaching or underrecovery (Meeusen et al., 2013; Kellmann et al., 2018). Continuous athlete monitoring may provide information that can be used to balance stress and recovery, ultimately increasing the performance readiness of the athlete and minimizing the risk of illness and injury (Halson, 2014; Schwellnus et al., 2016; Soligard et al., 2016; Bourdon et al., 2017; Coutts et al., 2018; Heidari et al., 2019). A variety of tools, such as psychometric questionnaires (Kellmann, 2010; Saw et al., 2016), blood-borne markers (Urhausen et al., 1995; Fry and Kraemer, 1997; Urhausen and Kindermann, 2002; Meeusen et al., 2013), heart rate (HR)-based measures (Achten and Jeukendrup, 2003; Aubert et al., 2003; Bosquet et al., 2008; Meeusen et al., 2013; Buchheit, 2014; Bellenger et al., 2016a), and (submaximal or non-fatiguing) performance tests (Urhausen and Kindermann, 2002; Meeusen et al., 2013; Claudino et al., 2017), have been discussed for their potential as surrogate markers for assessing fatigue, recovery, or performance. Ideally, so that they can be used frequently in sports practice, these measures are non-fatiguing, easy to administer, inexpensive, and sensitive to performance changes and can provide immediate feedback (Starling and Lambert, 2018).
Monitoring the status of the autonomic nervous system (ANS) with HR-based measures [HR and HR variability (HRV) indices] is an attractive option for testing due to its non-invasiveness and time-efficiency when performed for an entire training group or team. Technological developments within the last few decades have enabled practitioners to use portable devices to obtain accurate beat-by-beat recordings (Achten and Jeukendrup, 2003; Quintana et al., 2012; Buchheit, 2014) as well as software and smart phone applications (Flatt and Esco, 2013; Perrotta et al., 2017; Plews et al., 2017) to obtain (almost) live feedback on HR and HRV indices [HR(V)] in the field. In applied sports research and practice, HR (or average R-R interval) and the time-domain HRV marker RMSSD (root mean square of successive differences between adjacent beat to beat intervals) are commonly measured in a supine, seated, or standing position and may indicate training and fatigue status (Buchheit, 2014; Schmitt et al., 2015a; Bellenger et al., 2016a; Thorpe et al., 2017). However, as ANS activity, and therefore HRV indices, are determined by multiple factors (Sandercock et al., 2005; Buchheit, 2014; Fatisson et al., 2016), it remains difficult to interpret HR(V) measures in isolation. This may contribute to the partially contradictory findings in the literature (Buchheit, 2014; Schneider et al., 2018). To overcome some of these limitations, it has been proposed that researchers use a combination of supine and standing recordings during an orthostatic test to discriminate between different fatigue patterns (Bosquet et al., 2008; Schmitt et al., 2013, 2015a,b; Hottenrott and Hoos, 2017) and use rolling averages to assess adaptation to training (Le Meur et al., 2013; Plews et al., 2014; Flatt and Esco, 2015).
Individuals' HR(V) responses likely differ with training context (i.e., training phase and history, exercise modality and intensity, and the time course of response) (Stanley et al., 2013; Buchheit, 2014; Schmitt et al., 2015a). The majority of relevant scientific reviews focus on either endurance-trained athletes (Bosquet et al., 2008; Bellenger et al., 2016a) or non-athletic populations (Kingsley and Figueroa, 2016; Bhati et al., 2018). Based on this background and to extend insights into training context-specific HR(V) responses, we conducted two independent, similarly designed training trials using whole-body strength training (ST) or high-intensity interval training (HIIT) overload microcycles in well-trained athletes. This study aims to (1) determine the mean changes in HR and HRV measures during active orthostatic tests following ST and HIIT overload and subsequent short-term recovery; (2) evaluate the association between changes in HR, HRV, and performance; (3) classify individuals' HR(V) responses; and (4) analyze whether the use of single-day vs. two-day to four-day average HR values affects the results of the three main analyses.
Materials and Methods
Participants
Initially, 55 athletes were recruited, of which 51 met the inclusion criteria and 45 competed the study (5 participants did not meet compliance criteria, one dropout due to injury). From the original samples of 23 (9 female, 14 male) individuals performing ST and 22 (11 female, 11 male) individuals performing HIIT, only 19 (7 female, 12 male) and 18 (9 female, 9 male), respectively, participants provided a sufficient quantity of resting HR recordings to be included in this investigation (we set a minimum of three baseline recordings and a maximum of one missing recording during recovery). The general subject characteristics are presented in Table 1. Preliminary health examinations, including resting and exercise electrocardiograms, confirmed the absence of cardiovascular, pulmonary, or orthopedic diseases.
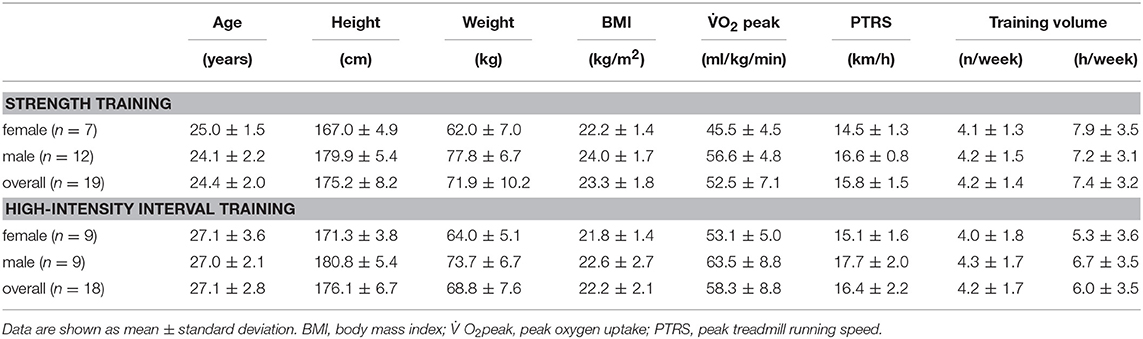
Table 1. Subject characteristics.
The following inclusion criteria were used for the ST group: estimated one-repetition maximum (1RM) for a parallel squat of at least 80% of body mass for females and 120% of body mass for males and a minimum of 3 years of lower-body strength training with at least two strength training sessions per week. The inclusion criteria for the HIIT group were as follows: peak velocity during the 30-15 Intermittent Fitness Test (VIFT) of at least 16 km/h for females and 19 km/h for males, and a minimum of 5 years of team sport training.
The investigation was approved by the ethics committee of the medical faculty of the Ruhr University Bochum and was conducted according to the guidelines of the Declaration of Helsinki. All subjects participated in the study voluntarily, were free to withdraw without penalty at any time, and provided written informed consent. Participation was rewarded with 100 € at the end of the investigation.
Experimental Design
A repeated-measures study was used to investigate the effects of short-term fatigue and recovery on resting HR and HRV measures [HR(V)]. The investigation comprised a 3-day rest period, baseline testing (Pre), a 6-day overload microcycle, and a 4-day recovery period, which included follow-up testing at 1 (Post1) and 4 (Post4) days post-training (Figure 1). Overload was induced by either intensive whole-body ST or HIIT in two independent study arms. Health examination (incl. survey of medication and nutritional supplementation), determination of peak oxygen consumption (O2peak)and familiarization trials for training and testing procedures were conducted 1 week before baseline testing. Discipline-specific maximum effort tests were used as criterion measures to assess fatigue- and recovery-related changes in performance. HR(V) measures were recorded daily during the main 14-day study period (including the rest period, overload training, and recovery). An overview of the experimental design is shown in Figure 1.
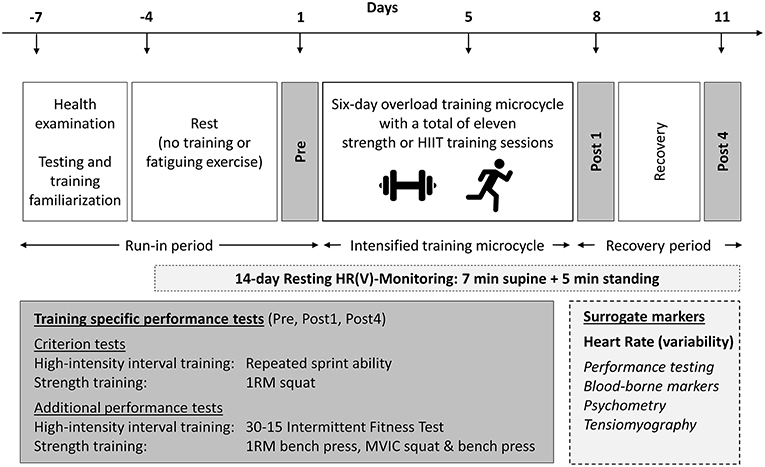
Figure 1. Experimental design. HIIT, high-intensity interval training; HR(V), heart rate (variability); MVIC, maximum voluntary isometric contraction; 1RM, one-repetition maximum. Surrogate measures in italics are measures that were published previously and are not part of this article (see Methods section).
The analyses presented below were part of an extensive investigation protocol evaluating the ability of different potential surrogate markers to assess fatigue- and recovery-related changes in criterion performance at various overload training camps (i.e., cycling-based endurance training, running-based HIIT, whole-body ST) using a consistent design. The results regarding the performance tests (Wiewelhove et al., 2015; Hammes et al., 2016; Raeder et al., 2016), blood-borne markers (Hecksteden et al., 2016), psychological measures (Hitzschke et al., 2017), and muscle mechanical properties (de Paula Simola et al., 2016) have already been published. Due to insufficient HR(V) baseline recordings, the cycling-based endurance training study arm could not be considered for analyses. Data is provided as Supplementary Material.
Training Program
The training microcycles were designed to induce functional overreaching and decrease discipline-specific criterion performance 1 day after training, with the effects reversed on the fourth day post-overload. Two training sessions were performed per day, and on the fourth day of training, the morning session was substituted by an intermediate test of surrogate measures, resulting in a total of 11 training sessions. Table 2 presents a general overview of the training schedules, and more details can be found in other reports (Wiewelhove et al., 2015; Raeder et al., 2016).
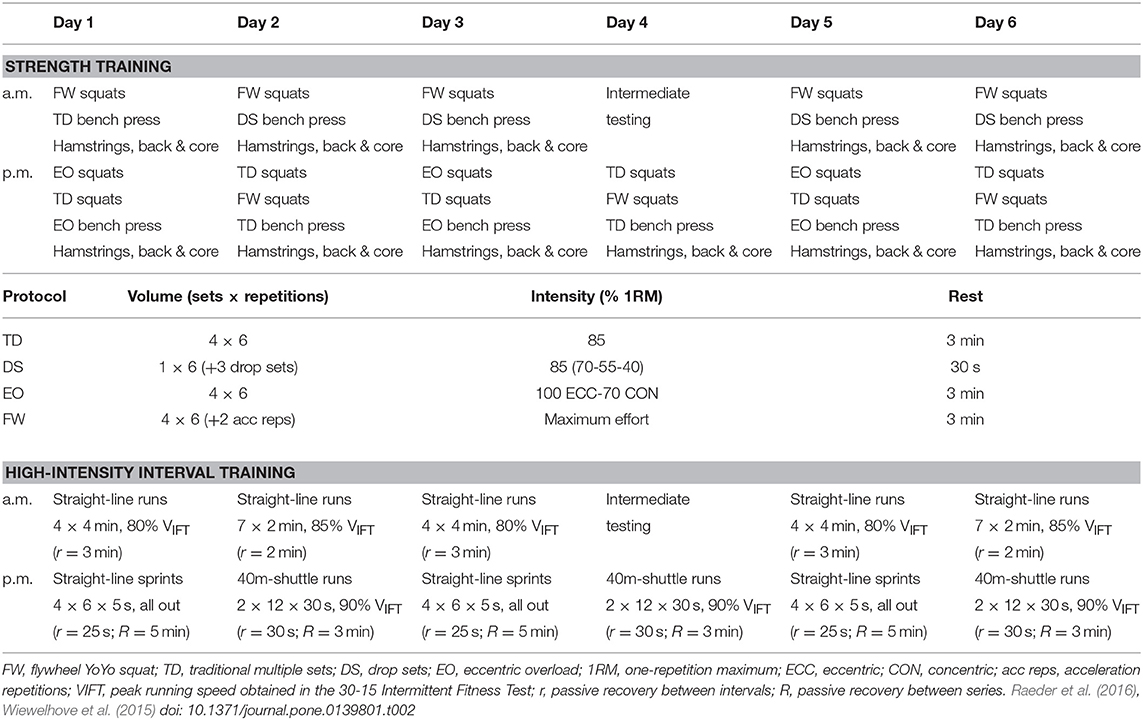
Table 2. Overload training microcycles.
ST combined multi-joint high-resistance training and maximal eccentric strength training, focusing mainly on lower-body exercises (i.e., parallel squats). The training sessions lasted approximately 90 min. They started with a standardized dynamic warm-up, followed by lower-body exercises, and ended with a combination of upper-body, core, hamstring, and back exercises. Preceding the main training exercises, participants performed specific warm-up sets of 5 to 3 repetitions at 50% and 70% of individual maximum performance, respectively. Exercise intensity was standardized in relation to the estimated maximal dynamic strength (1RM) or maximum effort (Table 2).
HIIT included straight-line runs, straight-line sprints, and shuttle runs performed on an outdoor 400 m Tartan track. Training sessions lasted approximately 35 min. They started with a standardized 10-min continuous warm-up consisting of 40-m shuttle runs at approximately 60–70% of participants' maximum HR, followed by four 40-m acceleration sprints. Exercise intensity was standardized in relation to peak velocity during the 30–15 Intermittent Fitness Test (VIFT) or maximum effort (Table 2).
Procedures
Performance Measures
A detailed description of the testing procedures can be found in the original publications regarding ST (Raeder et al., 2016) and HIIT (Wiewelhove et al., 2015). On the testing days Pre, Post1, and Post4, participants in the ST overload group were subjected to maximum dynamic and isometric strength tests. Criterion performance was measured by participants' 1RM for parallel squats. On the main testing days, participants in the HIIT overload group were subjected to maximum intermittent shuttle-run test and a repeated sprint ability (RSA) test. RSA was defined as the criterion performance measure.
Incremental treadmill test
An incremental treadmill test (Ergo ELG2, Woodway GmbH, Weil am Rhein, Germany) using a breath-by-breath gas collection system (ZAN600USB, nSpire Health GmbH, Oberthulba, Germany) was employed to measure O2peak in order to characterize the participants aerobic capacity. Initial velocity was set at 8 km/h, with 2 km/h increments introduced every 3 min and a constant incline of 0.5% until voluntary exhaustion. The highest 30 s mean value was defined as the O2peak.
Maximum voluntary isometric contraction
Participants' maximum voluntary isometric contraction (MVIC) force output for parallel squat and bench press exercises was determined using a Multitrainer 7812-000 testing device similar to a Smith machine (Kettler Profiline, Ense-Parsit, Germany) and the corresponding user software (DigiMax, version 7.X). Joint angles were set at 90° using a goniometer and the corresponding testing device position was kept constant throughout the study. Following two submaximal practice trials at ~50 and 70% of participants' MVIC, the participants were asked to produce a 3-s MVIC with initial slow force development. MVIC test performance was defined as the mean force of two attempts separated by a rest of 2 min.
One-repetition maximum
Participants' maximum dynamic strength was assessed 60 min after MVIC testing for parallel squat (ST criterion performance measure) and bench press exercises using a Smith rack machine (Technogym, Cesena, Italy). Squat depth was standardized using an integrated linear transducer that produced acoustic stimuli to mark the turning point of the motion. Participants completed two warm-up sets of 5 and 3 repetitions at 50 and 70% of their individual 5–10 RM, respectively. Using a formula by Brzycki (Maud and Foster, 2006), participants' 1RM was estimated based on the heaviest 5–10 RM lift within a maximum of three testing sets separated by rests of 3 min. Tests were stopped when the subjects were unable to raise the barbell using a proper technique or when the supervisors' help was required. The reliability of the 1RM squat test was previously investigated in our laboratory and was determined to be high [1RM (kg), n = 38, ICC = 0.96, TE 5.2 (Raeder et al., 2016)]. Participants' 1RM performance was later used to calculate the exercise intensity of the training protocols.
Repeated sprint ability
Participants' RSA (HIIT criterion performance measure) was determined using a non-motorized treadmill (Force 3.0, Woodway GmbH, Weil am Rhein, Germany). The participants completed a standardized warm-up prior to the trial. The test consisted of six 4-s maximal sprints beginning from a standing position with passive recovery of 20 s between sprints. The highest velocities measured for each sprint were recorded, and the mean peak velocity was calculated. The reliability of the RSA test was previously investigated in our laboratory and was determined to be high [mean peak velocity (m/s), n = 17, ICC = 0.92, TE 0.1 (Wiewelhove et al., 2015)].
Intermittent aerobic performance
Maximum intermittent aerobic performance was assessed based on participants' peak running speed (VIFT) during the 30-15 Intermittent Fitness Test (Buchheit, 2008). The test was conducted on an outdoor Tartan track. Participants were tasked with running back and forth between two lines set 40 m apart. The shuttle runs were 30 s with 15 s of passive recovery between each run. The initial running speed was set at 8 km/h, with stepped increases of 0.5 km/h every 45 s. Running speed was declared using audio signals, and VIFT was defined as the velocity of the last completed stage. VIFT was later used to calculate the exercise intensity of the training protocols.
Heart Rate and Heart Rate Variability
Every morning, an active orthostatic test (7 min supine, 5 min standing) was performed after participants' awoke and emptied their bladder throughout the main 14-day study period. During recordings, the participants were asked to leave their eyes open, breathe calmly, and avoid movement. A general briefing and written guidelines for the orthostatic test were provided before the beginning of the study (see Supplementary Material for details). R-R series were recorded using Polar RS800cx heart rate monitors (Polar Electro, Kempele, Finland), and the data were transferred to the software Polar Pro Trainer 5 (version 5.40.170, Polar Electro, Kempele, Finland). Polar files (.hrm) were then exported and used for further processing. HR, the natural logarithm of RMSSD (Ln RMSSD) and the Ln RMSSD to R-R interval ratio (Ln RMSSD/RR = Ln RMSSD divided by the mean R-R interval) were calculated during the last 5 min for which participants were supine and the 5-min standing measurements using Kubios (version 2.2, Biosignal Analysis and Medical Imaging Group, University of Eastern Finland, Finland) (Tarvainen et al., 2014). The Ln RMSSD, which is considered to be measure of vagal-mediated HRV (at least in the acute-term) (Malik et al., 1996; Carter et al., 2003), was chosen as the primary HRV marker because it features high reliability (Al Haddad et al., 2011) and is less affected by different breathing patterns compared to spectral analysis (Penttilä et al., 2001; Saboul et al., 2013). Additionally, average HR was calculated (Plews et al., 2013; Buchheit, 2014) to further allow comparison of whether HRV is more sensitive to overload- and recovery-related changes than HR. It remains unclear whether HRV is more sensitive than HR to changes in athletes' training status (Billman et al., 2015b; Schneider et al., 2018). Finally, as previously proposed, the Ln RMSSD/RR was determined to gain further insights into the association between HRV and average HR (Plews et al., 2013; Buchheit, 2014; Billman et al., 2015b; Trimmel et al., 2015, Editorial).
Data Analysis and Statistical Analysis
Data are presented as mean ± standard deviation (SD) unless otherwise specified. For our statistical analyses, we used Microsoft Excel 2016 (Microsoft Office 365, Version 1810, Microsoft Corp., Redmond, WA, USA) for basic calculations and descriptive statistics and the free open-source software JASP (Version 0.8.6, Amsterdam, Netherlands) (JASP Team, 2018) for inferential procedures. The Shapiro-Wilks test was used to verify the assumed normal distribution of data. Statistical analyses are provided as JASP files (.jasp) in the Supplementary Material.
The day-to-day reliability of resting HR(V) indices were assessed using specifically designed spreadsheets (Hopkins, 2015b). The typical error (TE) was selected as the reliability statistic of interest and was calculated by dividing the standard deviation (SD) of day-to-day differences (SD) by pooled for the four-day baseline period (i.e., the differences between days 1 and 2, 2 and 3, and 3 and 4) (Hopkins et al., 2001). The group-based smallest worthwhile change (SWC) was defined as 0.2 × between-subject SD for pooled baseline measurements (Hopkins et al., 2009). TE and SWC were calculated as absolute and percentage values. The spreadsheets used for the assessment are provided as Supplementary Material.
Differences between the three main time points (Pre, Post1, and Post4) were tested by repeated measures analysis of variance (ANOVA; repeated factor: time; grouping factor: sex) including sex as grouping factor to determine possible sex differences in HR(V) responses (Aubert et al., 2003; Sandercock et al., 2005). The violation of sphericity was adjusted by Greenhouse-Geisser correction. Bonferroni-adjusted p-values (pbonf) are reported for pairwise comparisons. The level of significance was set at p ≤ 0.05. Further, paired t-tests were used to calculate 90% confidence limits (CL) for the mean differences and standardized effect sizes (d). The magnitude of change (dpre) was evaluated using the between-subject Pre-test SD. Then, dpre and 90% CL were calculated in MS Excel and adjusted for the sample size using the following formula (Cumming, 2012, p. 294):
where df is the degree of freedom of the SD estimate (df = n−1). The threshold values for dpre were >0.2 (small), >0.6 (moderate), and >1.2 (large) (Hopkins et al., 2009).
To evaluate the consistency of within-subject changes (ddiff) between the different measures used within our study, mean differences were standardized according to the SD of differences (Dankel and Loenneke, 2018). Then, ddiff and 90% CL were calculated with JASP.
The Pearson correlation (r) and 90% CL were used to evaluate the associations between changes in HR(V) and performance measures as well as between HR and Ln RMSSD. In accordance with previous analyses (Plews et al., 2014), percentage changes from the previous values were correlated for changes between Pre, Post1, and Post4 with JASP. Individual HR and Ln RMSSD time series were correlated with Microsoft Excel. Threshold values for r were >0.1 (small), >0.3 (moderate), and >0.5 (large) (Hopkins et al., 2009).
The mean differences and correlations were calculated for changes in daily HR(V) measures and the 2-, 3-, and 4-day rolling averages. When the 90% confidence intervals overlapped small positive and negative values, the effects were deemed unclear (Hopkins et al., 2009).
Individual responses were classified as likely to be increased or decreased when changes exceeded the TE. Therefore, this category (i.e., “likely”) includes changes for which the approximate 50% confidence interval associated with the observed change (i.e., ±TE) does not include zero change (Hopkins, 2004; Swinton et al., 2018). If changes in ±TE occurred, individual responses were classified as unclear. Group-based TE (Wiewelhove et al., 2015; Raeder et al., 2016) was used to assess performance changes, and individual TE (i.e., 4-day baseline SD) was used to classify changes in HR(V) indices. Subsequently, 3 × 3 tables were created to descriptively evaluate the categorial agreement between changes in performance (i.e., criterion) and HR(V) measures (i.e., surrogate) as well as the agreement between changes in HR and Ln RMSSD when using single-day values or 4-day averages, respectively. The evaluation of categorical agreement (i.e., 3 × 3 tables) refers to the commonly proposed threshold-based approaches to assess individual HR(V) changes, for example using the TE or SWC as cut-off values for decision-making (Plews et al., 2013; Buchheit, 2014), and is aimed to complement the assessment of continuous association (i.e., correlations) between HR(V) and performance measures.
Results
Statistically significant sex differences were apparent (main effect of sex: p ≤ 0.05) in the performance data (ST, HIIT) as well as the standing HR (ST, HIIT) and Ln RMSSD (ST) values. In absence of clear interactions between time and sex, statistical analyses were conducted only for pooled data.
Baseline Recordings and Missing Data
During the baseline period, one supine and/or standing HR(V) recording was missing for three ST and four HIIT participants. Another HR(V) recording for the day following Post1 was missing for one ST participant. This missing data slightly affected the 3- and 4-day rolling averages, but not the degrees of freedom for the analyses.
Descriptively, the day-to-day reliability of HR and Ln RMSSD, expressed as the typical error (TE in %), was larger when the participants were standing compared to supine in the ST group (HR: +2.1%; Ln RMSSD: +1.3%), HIIT group (HR: +2.3%; Ln RMSSD: +5.1%), and pooled data of the ST and HIIT groups (HR: +2.0%; Ln RMSSD: +3.2%) (Table 3). Baseline HR (i.e., 4-day average) was slightly lower for the HIIT group compared to the ST group in a supine position [difference: −3 bpm, smallest worthwhile change (SWC): 1–2 bpm]. However, it was slightly higher when participants were in a standing position (+2 bpm). Differences in Ln RMSSD remained below the SWC (Tables 3–5).
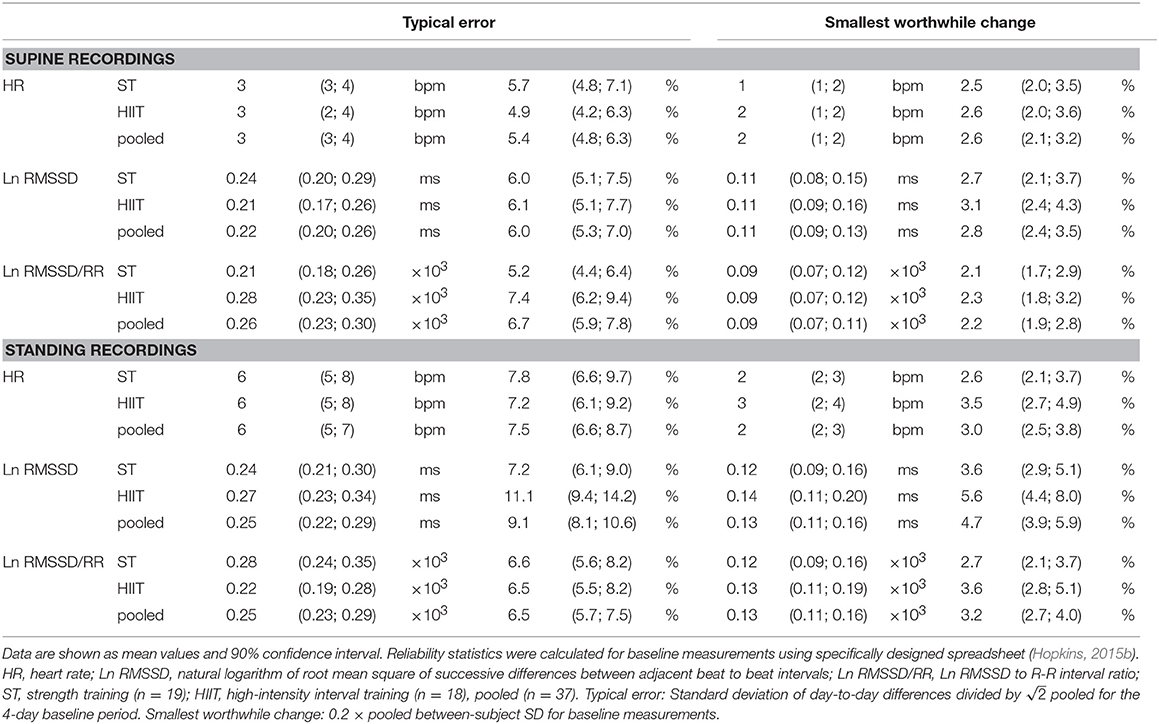
Table 3. Day-to-day reliability and smallest worthwhile change for resting heart rate (variability) measures during the 4-day baseline period.
Performance
Participants' 1RM performance in the squat exercise (i.e., criterion) was slightly decreased at Post1 by −4.4 kg (90% CL, −7.8; −1.0 kg) and was increased at Post4 by +4.0 kg (1.0; 7.1 kg). A statistically non-significant main effect was revealed for time (p = 0.097). Maximum dynamic and isometric bench press performance showed statistically significant but marginal changes over time (main time effects: p ≤ 0.005, |dpre| ≤ 0.10; Table 4). Repeated sprint ability and maximum intermittent aerobic performance showed small changes over time (main time effects: p ≤ 0.005, |dpre| ≥ 0.27). The mean peak velocity in the RSA test (i.e., criterion) was decreased at Post1 by −0.18 m/s (−0.23; −0.12 m/s) and was increased at Post4 by +0.18 m/s (0.08; 0.27 m/s; Table 5).
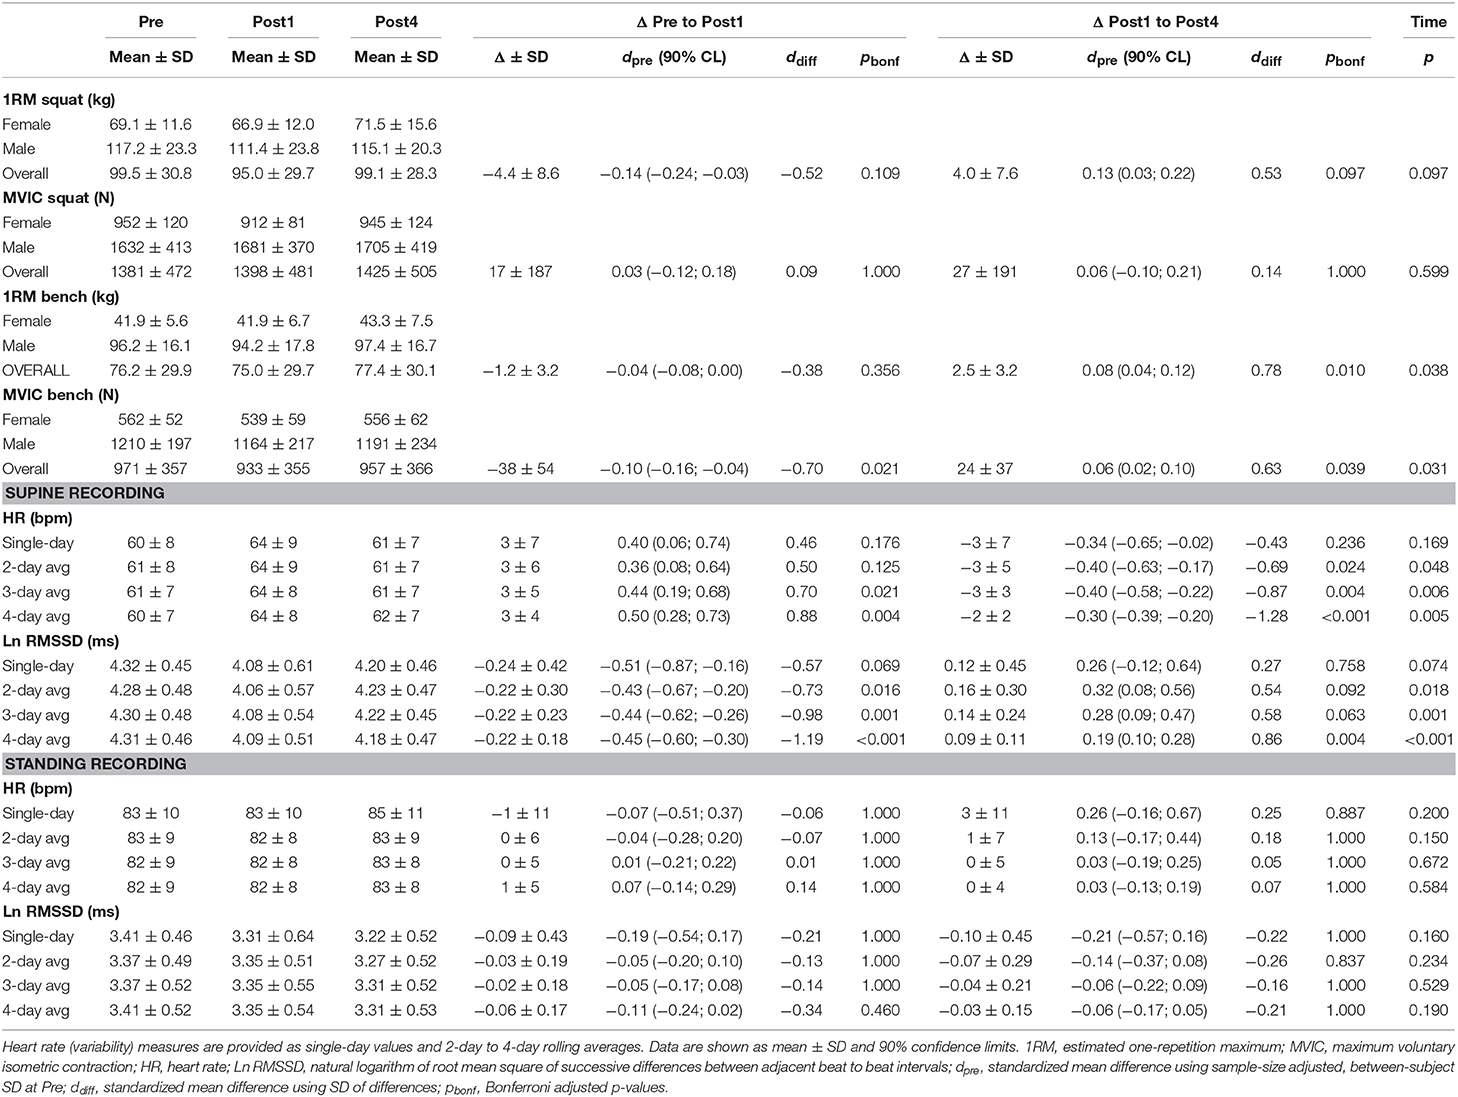
Table 4. Performance and heart rate (variability) measures at Pre, Post1, Post4, and changes between testing days for the strength training microcycle (7 female, 12 male).
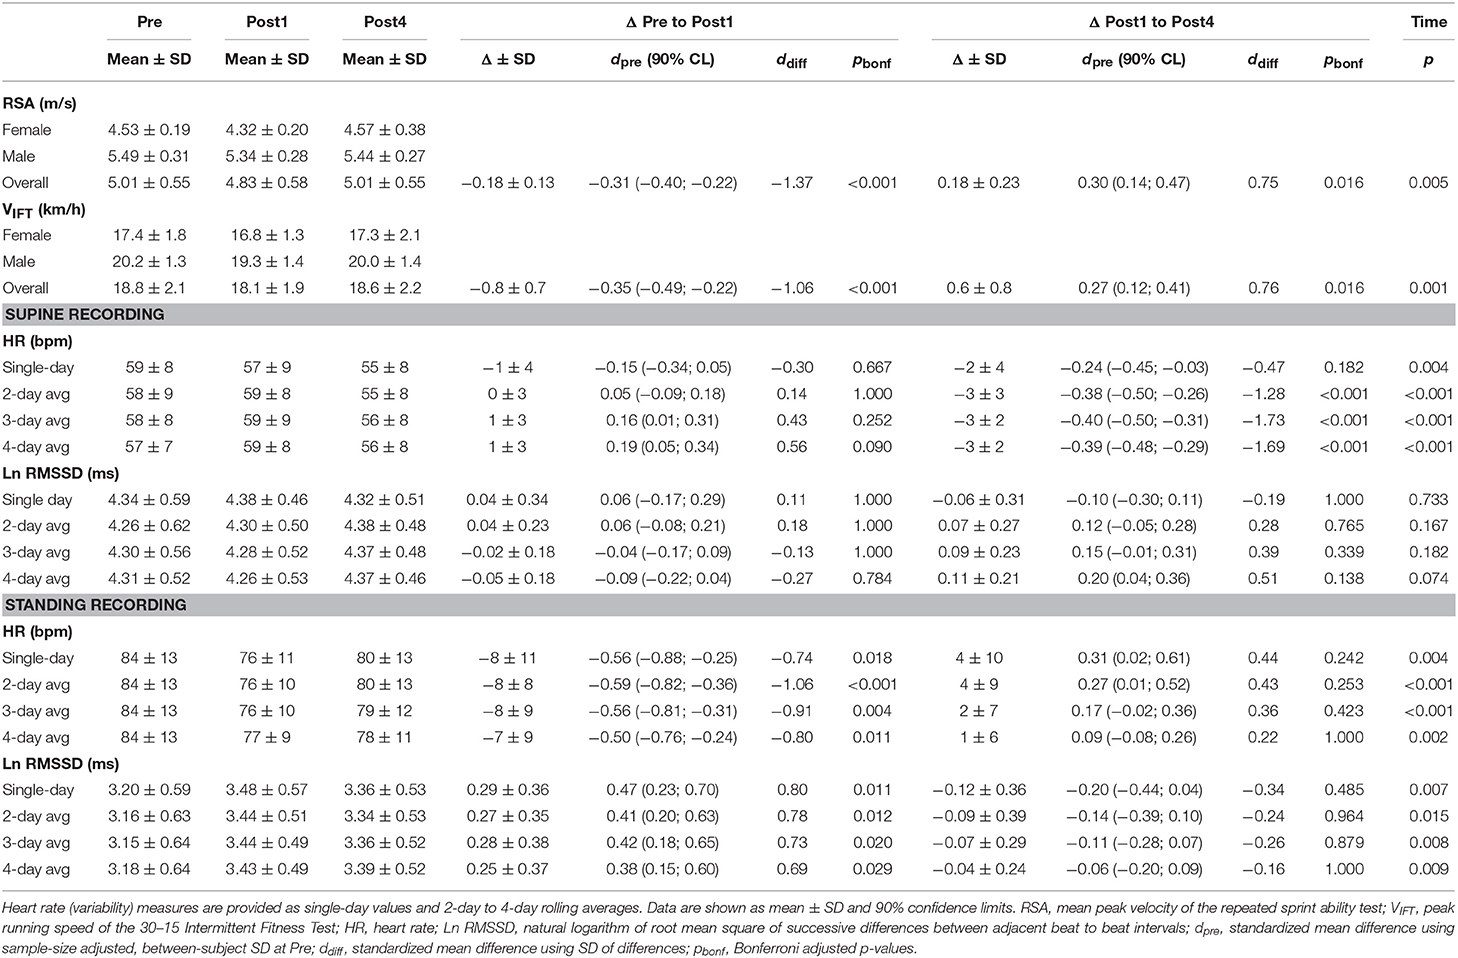
Table 5. Performance and heart rate (variability) measures at Pre, Post1, Post4, and changes between testing days for the high-intensity interval training microcycle (9 female, 9 male).
Time Course of HR(V) Measures
For the ST group, daily resting HR increased above the SWC from second day of training to Post1 when participants were in a supine position (effect magnitude range for single day and 2- to 4-day averaged values, ΔPre to Post1: dpre = 0.36 to 0.50) and decreased at Post4 (ΔPost1 to Post4: dpre = −0.30 to −0.40). The mean supine Ln RMSSD showed an inverse response (ΔPre to Post1: dpre = −0.43 to −0.51; ΔPost1 to Post4: dpre = 0.19 to 0.32; Table 4). For the HIIT group, daily HR was decreased beyond the SWC from the fourth day of training in the standing position (ΔPre to Post1: dpre = −0.50 to −0.59) and increased after Post1 (ΔPost1 to Post4: dpre = 0.09 to 0.31). The mean standing Ln RMSSD showed an inverse response (ΔPre to Post1: dpre = 0.38 to 0.47; ΔPost1 to Post4: dpre = −0.06 to −0.20; Table 5). Changes in Ln RMSSD/RR were unclear for both groups and for both recording positions (see Supplementary Tables 1, 2 for detailed results).
An overview of the time course of mean HR(V) measures is presented in Figure 2 and the mean changes are presented in Tables 4–5 (see Supplementary Tables 1–2 for extensive results). Averaged HR(V) values yielded more precise interval estimates for mean changes (i.e., smaller confidence intervals and larger ddiff) compared to single-day values (Figure 3, Tables 4–5, Supplementary Figure 1, Supplementary Tables 1, 2).
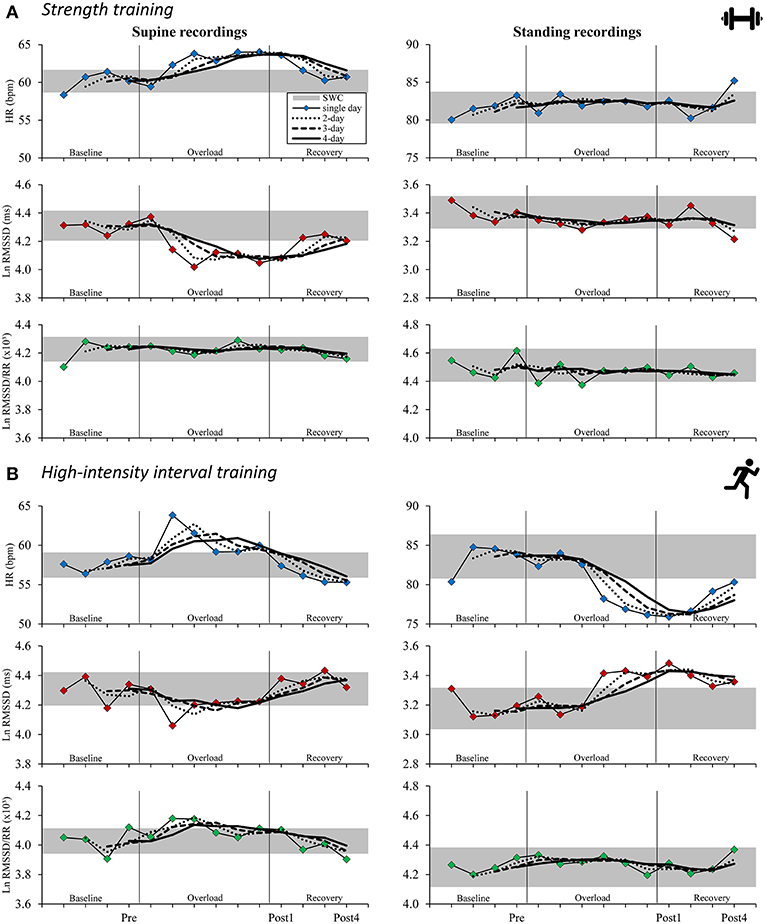
Figure 2. Time course for supine (left) and standing (right) mean resting heart rate (variability) measures in the strength training (A) and the high-intensity interval training (B) study arms for isolated daily values and rolling 2–4-day averages. Gray horizontal bar: smallest worthwhile change (0.2 × pooled between-subject SD for baseline measurements; see Table 3 for details); single-day: thin lines with colored markings; 2-day rolling average: dotted lines; 3-day rolling average: dashed lines; 4-day rolling average: bold lines. HR, heart rate; Ln RMSSD, natural logarithm of root mean square of successive differences between adjacent beat to beat intervals; Ln RMSSD/RR, Ln RMSSD to R-R interval ratio.
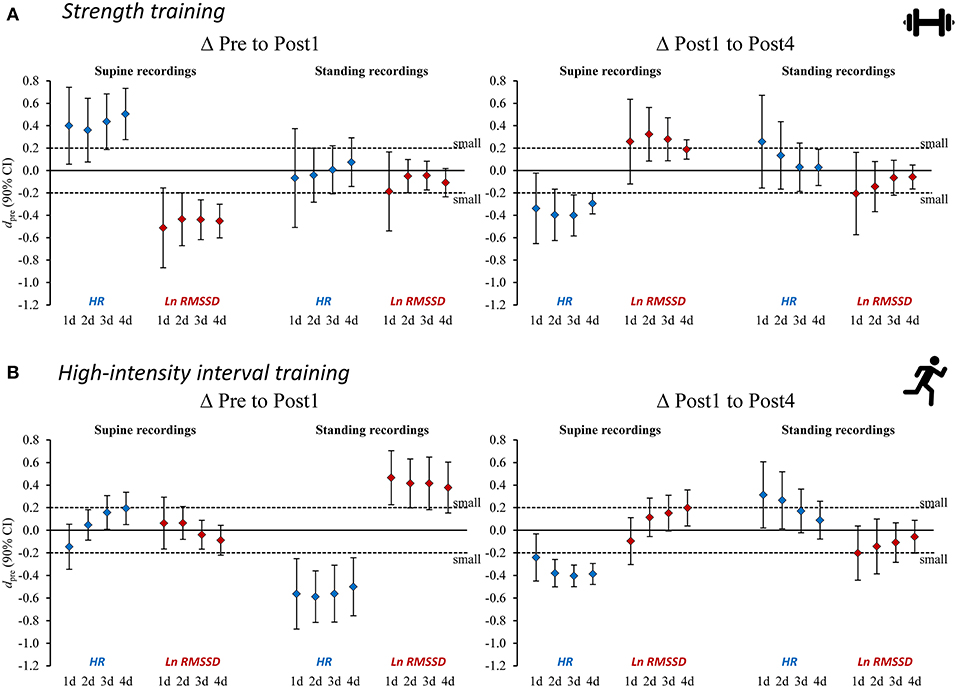
Figure 3. Standardized mean differences (dpre) for changes in heart rate (variability) measures from Pre to Post1 and from Post 1 to Post4 for (A) strength training and (B) high-intensity interval training. Heart rate (variability) measures are provided as single-day values and 2–4-day rolling averages. HR, heart rate; Ln RMSSD, natural logarithm of root mean square of successive differences between adjacent beat to beat intervals.
Association Between Changes in Performance and HR(V)
For both the ST and HIIT groups, the majority of correlation analyses between performance and HR(V) changes were unclear, or inconsistent for changes from Pre to Post1 compared to changes from Post1 to Post4. Moreover, the effect of using average HR(V) values compared to single-day values remained unclear for estimate precision (confidence intervals) and the magnitude (r) of correlations. The detailed results of the analyses are presented in Supplementary Figures 2, 3 and Supplementary Tables 3, 4.
Individual HR(V) Responses
Individual HR(V) responses are presented as single-day and 4-day average values and in reference to the TE as a threshold for response classification for the recording position that was sensitive to group changes (ST: supine recordings; HIIT: standing recordings).
Within the ST group (supine recordings, n = 19), Pre to Post1 changes in single-day HR were likely (i.e., beyond ± individual TE) increased in 10 athletes and likely decreased in 3 athletes. Ln RMSSD was likely decreased in 9 athletes and increased in 1 athlete. Of the 10 athletes whose squat 1RM (criterion performance) decreased below group-based TE (4.9%), 5 had likely increased HR and 5 had likely decreased Ln RMSSD. Regarding Pre to Post1 changes in 4-day HR(V) averages, 10 athletes showed likely increased HR and 1 athlete showed likely decreased HR. Ln RMSSD was likely decreased in 8 athletes. Of the 10 athletes whose squat 1RM decreased, 6 had likely increased HR and 4 had likely decreased Ln RMSSD. When classifying individual responses in three categories (likely increased, unclear, likely decreased), changes in squat 1RM and HR(V) agreed with the direction of group changes in the HR of 8 and 9 athletes (single-day and 4-day average, respectively) and in the Ln RMSSD of 9 and 7 athletes (single-day and 4-day average, respectively). In Table 6, blue and gray values represent agreement.
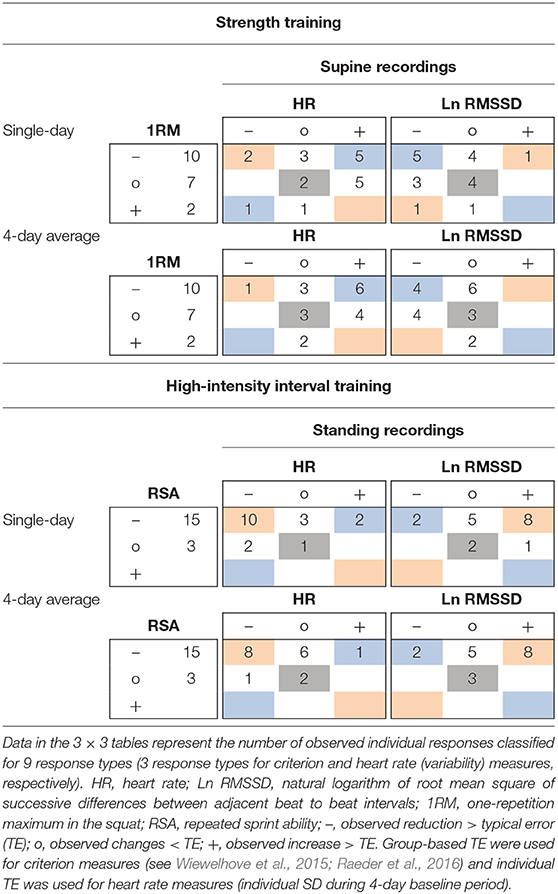
Table 6. Example 3 × 3 tables for individual response classification for changes from Pre to Post1 of criterion performance and resting heart rate (variability) measures using single-day and 4-day average values.
For the HIIT group (standing recordings, n = 18), Pre to Post1 changes in single-day HR was likely decreased in 12 athletes and likely increased in 2 athletes. Ln RMSSD was likely increased in 9 athletes and decreased in 2 athletes. Of the 15 athletes whose RSA (criterion performance) decreased below group-based TE (1.8%), 10 had likely decreased HR and 8 had likely increased Ln RMSSD. Regarding Pre to Post1 changes in 4-day average HR(V), 9 athletes showed likely decreased HR and 1 athlete showed likely increased HR. Ln RMSSD was likely increased in 8 athletes and likely decreased in 2 athletes. Of the 15 athletes whose RSA decreased, 8 had likely decreased HR and 8 had likely increased Ln RMSSD. When classifying individual responses in three categories (likely increased, unclear, likely decreased), changes in RSA and HR(V) agreed with the direction of group changes in the HR of 11 and 10 athletes (single-day and 4-day average, respectively) and in the Ln RMSSD of 10 and 11 athletes (single-day and 4-day average, respectively). In Table 6, red and gray values represent agreement. Individual responses within the HIIT group (standing recordings) are detailed in Figure 4.
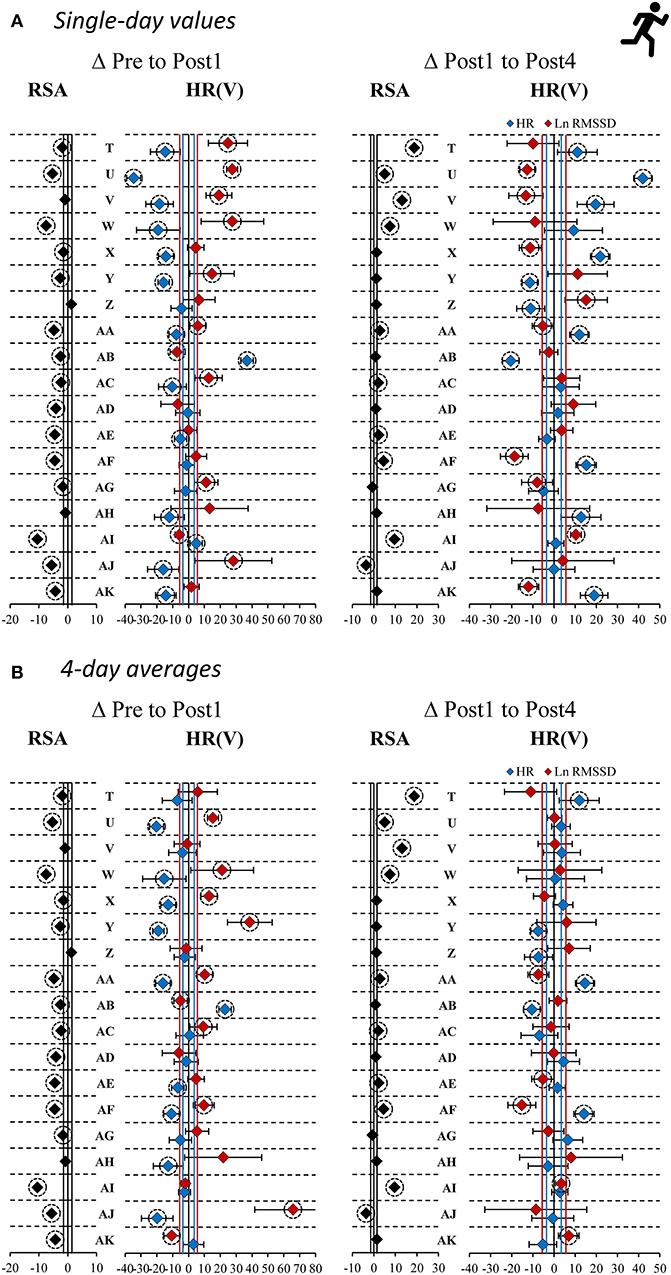
Figure 4. Individual responses as percentage changes in criterion performance and standing heart rate (variability) measures [HR(V)] for high-intensity interval training overload. HR(V) measures are provided as as (A) single-day values and (B) 4-day rolling averages. RSA, repeated sprint ability; HR, heart rate; Ln RMSSD, natural logarithm of root mean square of successive differences between adjacent beat to beat intervals. Vertical lines: group-based typical error (TE) for RSA (black), smallest worthwhile change (see Table 3) in HR (blue), and Ln RMSSD (red). Error bars: individual TE (4-day baseline SD). Dashed circles: changes exceed ±TE.
In the ST group (supine recordings), categorial associations between changes in HR and Ln RMSSD showed agreement (i.e., likely increased HR and likely decreased Ln RMSSD, and vice versa) for 11 of 19 athletes (ΔPre to Post1, ΔPost1 to Post4) according to single-day measures. The correlations between HR and Ln RMSSD were moderate to large for changes between main testing days (r = −0.33 to −0.77) and large for individual time series (mean r = −0.61 to −0.67). In the HIIT group (standing recordings), categorial associations between changes in single-day HR and Ln RMSSD showed agreement for 13 of 18 athletes (ΔPre to Post1) and 12 of 18 athletes (ΔPost1 to Post4). Correlations between HR and Ln RMSSD were trivial to moderate for changes in supine recordings (r = −0.35 to 0.06), large for changes in standing recordings (r = −0.58 to −0.76), and large for individual time series (mean r = −0.50 to −0.78). Most of the time, use of 4-day averages resulted in higher overall categorial agreement and mostly increased agreement for unclear changes (i.e., HR and Ln RMSSD changes within ±TE). In Table 7, blue and gray values indicate agreement. A full account of individual responses is provided in the Supplementary Figures 4, 5 and Supplementary Tables 5–7.
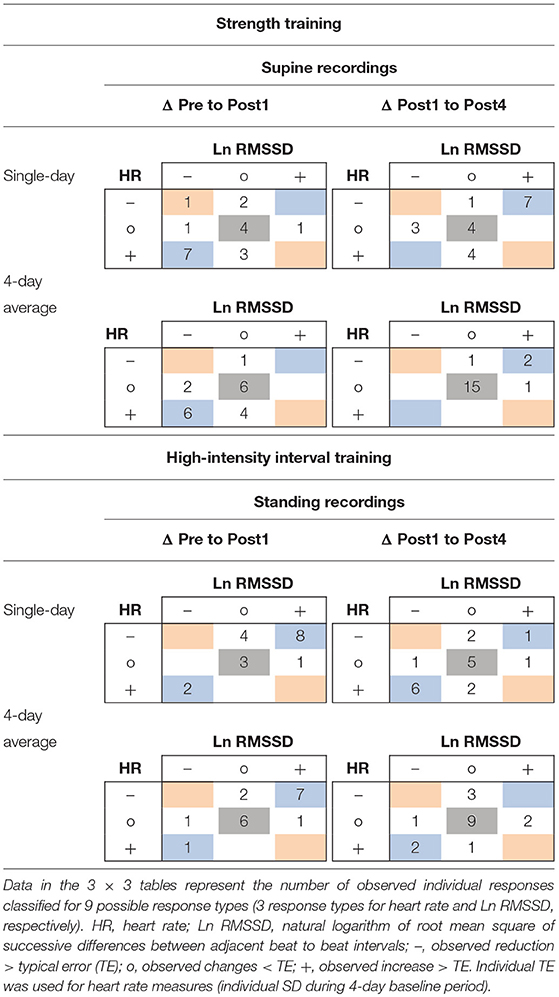
Table 7. Example of 3 × 3 tables for individual response classification for changes from Pre to Post1 and Post1 to Post4 of resting heart rate and Ln RMSSD using single-day and 4-day average values.
Discussion
The purpose of this study was to characterize changes in HR and vagal HRV in response to ST and HIIT overload and short-term recovery. The main finding was that the HR(V) patterns identified during active orthostatic testing displayed altered supine HR(V) following ST while standing measures remained stable. Following HIIT, standing HR(V) measures were deflected while supine measures remained unchanged. Both continuous and categorical associations between changes in HR(V) indices and performance changes were weak or unclear. Further, our data suggested that the use of rolling averages may improve statistical sensitivity to group changes compared to the use of single-day HR(V). However, in the present study, average values appeared to be detrimental for assessing individual short-term responses when using the TE as a response threshold, as the magnitude of day-to-day changes was reduced. This may compromise sensitivity by decreasing signal-to-noise ratio, resulting in a decreased magnitude of change compared to the baseline variability.
Evidence of Autonomic Modulation in Response to Short-Term ST and HIIT Overload
During ST overload, on average, supine HR increased, and supine Ln RMSSD decreased. The effects were reversed during the recovery period. Standing HR(V) recordings remained unchanged. These observations suggest small, reversible, decreased parasympathetic activity (increased HR and decreased Ln RMSSD) for the supine resting condition. However, autonomic responsiveness to orthostatic stress remained unaffected suggesting that ST overload did not impair parasympathetic withdrawal and/or sympathetic activation in response to standing up. As previously reported, overload induced substantial changes in perceived stress and recovery (Hitzschke et al., 2017), creatine kinase and c-reactive protein (Hecksteden et al., 2016), and jump performance (Raeder et al., 2016). The findings concerning the supine recordings align with the results of a recent review on the effects of resistance exercise and training on HRV (Kingsley and Figueroa, 2016). This suggests a prolonged decrease in parasympathetic modulation in young, healthy adults following acute whole-body resistance exercise. For example, vagal HRV (i.e., high frequency power) was reduced for at least 24 h after trained weightlifters performed whole-body resistance exercises for 2 h (Chen et al., 2011). In addition, the weightlifters had impaired weightlifting performance and increased creatine kinase concentrations. Unfortunately, previous studies on HRV responses to acute resistance exercise in strength-trained subjects have either used substantially less session volume (González-Badillo et al., 2016; Pareja-Blanco et al., 2017) or reported only acute effects within a few hours after exercising (Kingsley et al., 2014; Figueiredo et al., 2015a; Figueiredo et al., 2015b).
In response to the HIIT microcycle, supine HR(V) recordings remained unchanged on average. However, standing HR decreased and standing Ln RMSSD increased, with reverse changes occurring during recovery. Similar to ST, HIIT overload induced substantial changes in perceived stress and recovery (Hitzschke et al., 2017), creatine kinase (Hecksteden et al., 2016), and jump performance (Wiewelhove et al., 2015), as previously reported. In combination with stable HR(V) in a supine position, the changes associated with a standing position reflect an attenuated dynamic cardiovascular response to quickly changing from a supine to standing position. These findings may be attributed to the so-called saturation phenomenon that occurs in the supine position and reduced vagal withdrawal and/or reduced sympathetic activity during orthostatic stress. The saturation phenomenon indicates a loss of the relationship between HR and vagal HRV. It was suggested to be ascribed to saturation of acetylcholine receptors at the myocyte level, which may further suppress respiratory heart modulation and thus reduce vagal HRV measures at low HR (Buchheit, 2014). The saturation phenomenon is generally associated with low HR—it can occur at an HR of ~60 bpm or lower (Kiviniemi et al., 2004; Plews et al., 2012, 2013). Additionally, it may be partially related to aerobic capacity (Kiviniemi et al., 2004). This hypothesis (i.e., the presence of saturation in the supine position) is supported by the supine baseline HR of 57 bpm (i.e., 4-day average) for the group and the fact that 14 of 18 athletes showed supine baseline HR below 60 bpm. The evidence indicated that HRV saturation was likely in four athletes (athletes U, Z, AA, AF), as both supine HR and Ln RMSSD were decreased post-overload, but not in a standing position (Supplementary Table 6, Supplementary Figure 4). Although it has been suggested that parasympathetic reactivation is primarily intensity-dependent and it may take at least 48 h for vagal HRV to be fully restored after high-intensity aerobic exercise, higher aerobic fitness may accelerate post-exercise cardiac autonomic recovery (Stanley et al., 2013). For example, vagal HRV following a HIIT session (i.e., 6 × 3 min intervals above ventilatory threshold 2) returned to the pre-exercise level within a few hours in trained and highly trained subjects (O2max: 60 ± 5, and 72 ± 5 ml/min/kg, respectively) (Seiler et al., 2007). This suggests that vagal HRV indices might even overcompensate within the hours or days following very intense or prolonged exercise (Hottenrott and Hoos, 2017). This hypothesis is supported by previous studies, where increased Ln RMSSD were observed after 2 to 3 weeks of endurance-based overload training (Le Meur et al., 2013; Bellenger et al., 2016b), where average between-session recovery was likely smaller than 24 h. Another possible explanation for the reduced HR and increased Ln RMSSD in standing position following overload, could be altered sympathetic nervous system activity (e.g., due to reduced catecholamine excretion or desensitization of cardiac beta-adrenergic receptors) (Lehmann et al., 1998), which would become more evident after an increase in sympathetic activity in response to orthostatic stress.
The results agree with a meta-analysis (Bellenger et al., 2016a) on the effects of adaptation to endurance training on markers of autonomic HR regulation. Similar to the effects in the HIIT group, this meta-analysis reported a small increase in RMSSD following short training periods (i.e., 2 or 3 weeks), which led to decreased exercise performance. In addition, previous studies reported that standing HRV may be more sensitive to training-related changes compared to supine HRV as orthostatic stress may overcome possible saturation effects (Le Meur et al., 2013; Bellenger et al., 2016b).
To our knowledge, this is the first study to report HR(V) responses to ST and HIIT overload and subsequent short-term recovery measured with daily active orthostatic tests. We observed different HR(V) patterns during the orthostatic tests in response to the two different training modes, which might reflect activity- and/or fatigue-specific autonomic modulations (Schmitt et al., 2015a). Changing from a supine position to an active standing position causes a stress response due to the gravitational shift of blood from the central venous system to the lower extremities. This leads to severe vagal withdrawal as well as an increase in sympathetic-mediated vasomotor activity in order to preserve arterial blood pressure and avoid cerebral hypoperfusion (Buchheit et al., 2009a; Hottenrott and Hoos, 2017). Since supine and standing HR and HRV measures are influenced by the involvement of different cardiopulmonary receptors, we performed both supine and standing recordings. The postural HR(V) profiles were fully independent and non-exchangeable in elite endurance athletes (Schmitt et al., 2015a,b). Our observations provide some support for these arguments, as only combining supine and standing recordings enabled us to identify possible vagal saturation during HIIT overload and to describe different autonomic modulations depending on the training modes.
In summary, the observed differences in within-group HR(V) changes between study arms could be caused by various factors. On the one hand, differences in demands and in acute responses between training modalities may be responsible for different HR(V) patterns. In general, endurance-based (dynamic) exercise is suggested to mainly induce volume load on the cardiac cavities, whereas ST (i.e., static exercise) induces mainly pressure load (Aubert et al., 2003; Barbier et al., 2006). Further, HIIT is characterized by substantially greater amount of aerobic metabolism compared to ST (Barbier et al., 2006), and we assume higher total energy expenditure in response to HIIT. It was also suggested that HIIT exercise reduces arterial stiffness, while vigorous ST exercise increases arterial stiffness (Li et al., 2015; Way et al., 2019). HIIT may also induce acute plasma volume expansion (Green et al., 1984; Buchheit et al., 2009b). From a plausibility point of view, the described training responses could explain the observed within-group changes and between-group differences in orthostatic HR(V) regulation to some degree. However, we are not aware of studies providing direct evidence for such relationships, and overload training studies using active orthostatic tests in ST-trained subjects are entirely missing (see Kingsley and Figueroa, 2016; Bhati et al., 2018). On the other hand, the between-group differences could also be ascribed to differences in subject characteristics between study arms, such as higher average aerobic capacity in HIIT participants (Table 1) and possible additional training-specific functional (e.g., autonomic regulation) or structural adaptations (e.g., cardiac hypertrophy or changes in intrinsic HR) (Dickhuth et al., 1987; Achten and Jeukendrup, 2003; Billman et al., 2015a; Boyett et al., 2017; Flannery et al., 2017). In general, training-related HRV changes are frequently considered to be a result of altered autonomic HR regulation. However, in the absence of supportive physiological measurements, it remains speculative whether and to which degree the observed changes within our study were caused by different functional changes in response to varying exercise demands, or differences in training history-related adaptation and aerobic fitness between study groups.
Lack of a Clear Association Between Changes in Performance and HR(V) After ST and HIIT Overload Microcycles
Overall, the continuous associations (i.e., correlations) between changes in HR, HRV and performance were mainly unclear (i.e., the confidence intervals display a substantial overlap with positive and negative effects) or inconsistent in direction from Pre to Post1 and Post1 to Post4. Categorical associations (i.e., 3 × 3 tables) also showed weak agreement between changes in HR(V) and criterion performance when using the TE as a threshold value. Therefore, short-term changes in HR(V) may be a poor surrogate marker for discipline-specific performance following strenuous ST or HIIT microcycles at the individual level. These findings seem plausible for several reasons. First, previously reported correlation analyses between criterion performance and other possible surrogate measures (i.e., perceived stress and recovery, blood-borne markers, muscle contractile properties, and non-fatiguing performance tests) also revealed unclear (i.e., not statistically significant) associations (Wiewelhove et al., 2015; Hecksteden et al., 2016; Raeder et al., 2016; Hitzschke et al., 2017), and these measures show a more direct theoretical relationship to discipline-specific performance compared to HR(V). Secondly, Plews et al. (2014) observed only moderate correlations between changes in Ln RMSSD and running performance in trained triathletes following a three-week overload period. Thus, we conclude that either the overload training stimulus was too low or short in duration or that the selected (criterion) performance tests were too noisy (i.e., they had a suboptimal signal-to-noise ratio) to reveal clear associations.
In summary, HR(V) measures may indeed reflect training- and recovery-induced autonomic modulations, which could affect athletes' performance. In addition, it has been proposed that cardiac vagal modulation may rather indicate an athlete's capacity to adapt to (aerobic) exercise stimuli and is therefore a prerequisite for performance-related adaptation (Hautala et al., 2009). However, an athlete's ANS status is only one factor contributing to the complex nature of fatigue and performance, and it is unlikely that a single marker can accurately display changes in such multidimensional constructs (Meeusen et al., 2013; Bourdon et al., 2017; Coutts et al., 2018; Kellmann et al., 2018; Schneider et al., 2018).
Using Rolling HR(V) Averages May Attenuate Sensitivity to Individual Short-Term Changes in Autonomic Modulation
The use of average HR(V) improved the sensitivity to group changes compared to the use of single-day values, as indicated by the reduced width of confidence intervals for the dpre and increased ddiff effect sizes (Figure 3, Tables 4, 5, Supplementary Figure 1, Supplementary Tables 1, 2). This supports previous proposals to use rolling averages (Le Meur et al., 2013; Plews et al., 2014). Visual inspection of the individual HR(V) response panels (Figure 4, Supplementary Figures 4–5) suggests lower percentage changes in average values for several athletes. In addition, the number of athletes showing both unchanged HR and Ln RMSSD for average values was increased (Table 7, Supplementary Table 6). The approach we used to classify the HR(V) response indicated inverse effects at the individual level compared to the group level. Although this finding relies solely on descriptive evaluation, it appears reasonable, as averaging daily values attenuates day-to-day change. However, this can cause important information to be lost, especially since cardiac autonomic recovery may occur within 24 h in trained athletes (Seiler et al., 2007; Stanley et al., 2013). On the other hand, however, averaging HR(V) may be necessary to reduce the measurement error for daily HR(V) changes. This controversial issue could be explored by future studies.
Limitations and Strengths of the Study
Several factors limit the generalizability of results beyond the utilized study model. We primarily focused on determining the changes in HR(V) that occur following ST and HIIT overload in trained subjects. It remains unclear whether HR(V) also provides valuable information in more moderate, normal training environments or in highly trained athletes, as training and recovery responses may be diminished and accelerated, respectively, in these circumstances. In addition, adaptive responses to intensified training may be characterized by changes in the magnitude of day-to-day fluctuation in Ln RMSSD (Flatt and Howells, 2019), but this was not assessed in the current study. Further, as previously discussed in detail (Hecksteden et al., 2016), the comparability of HR(V) responses to ST vs. HIIT is constrained by the generic challenge of matching workload and fatigue levels between the different modes of exercise. Moreover, recruitment of performance-matched control groups for the (in total) three different study arms was not feasible due to limited time and resources. To verify our findings, randomized (crossover) trials with a priori optimized sample size are desired. Another limitation is that, despite an initial survey of medication and nutritional supplementation, it was neither possible for us to control the intake of HR(V) influencing medication throughout the study period, nor the consumption of caffeinated beverages immediately prior to orthostatic testing. Finally, as HR(V) is an indirect measure of cardiac autonomic modulation, interpretations regarding underlying physiological mechanisms should be treated with caution.
We tried to overcome several limitations by assessing the fatigue responses using criterion performance tests and utilizing repeated testing [i.e., daily HR(V) recordings] with a single-subject A-B-A withdrawal design (Kinugasa et al., 2004; Barker et al., 2011). The latter enabled us to describe HR(V) changes more precisely by considering individual day-to-day variation, which is not possible in a simple pre-post design. Furthermore, week-to-week reliability was determined beforehand in our laboratory (Wiewelhove et al., 2015; Raeder et al., 2016). It indicates random variation in criterion performance and may partially be a substitute for the presence of control groups (Hopkins, 2015a; Hecksteden et al., 2018). To our knowledge, comparative assessment of daily resting HR(V) for ST and HIIT during active orthostatic tests in a methodologically consistent design is a unique approach that offers novel insights into HR(V) responses.
Conclusion
Daily HR(V) monitoring with active orthostatic tests displayed altered supine HR(V) measures for ST- and altered standing HR(V) measures for HIIT short-term overload. HR(V) measures remained unchanged in the respective other recording position. These autonomic patterns may not be discovered by supine or standing measures alone. However, HR(V) changes were not consistently related to short-term performance changes, which limits their usefulness as surrogate measures for ST or HIIT performance in overload microcycles. Moreover, the use of rolling averages may attenuate the sensitivity to individual short-term autonomic modulations, despite improving sensitivity at the group level. To provide further guidance for sports practice, future studies should utilize repeated intervention designs (Hecksteden et al., 2015) with appropriate baseline recordings to determine the consistency of acute and short-term HR(V) responses, as previously done for long-term adaptation to training (Plews et al., 2013).
Practical Applications
The combined assessment of HR(V) measures in supine rest and following quickly standing up using orthostatic tests can provide unique and more comprehensive insights into athletes' autonomic HR regulation compared to either supine or standing recordings in isolation. Although divergent autonomic patterns might be observed following various training demands, it should be acknowledged that HR(V) measures may not mimic individual short-term performance changes. Furthermore, based on our results, we encourage practitioners to (also) analyze single-day HR(V) measures when assessing short-term training responses. Finally, day-to-day variability and training response varies substantially between athletes, which further complicates HR(V)-guided training prescription. In summary, we believe that it is still advisable first to gain experience at an individual level through pure observation in order to avoid inappropriate training adjustments due to overly simplistic training-response models.
Ethics Statement
The investigation was approved by the ethics committee of the medical faculty of the Ruhr University Bochum and was conducted according to the guidelines of the Declaration of Helsinki. All subjects participated in the study voluntarily, were free to withdraw without penalty at any time, and provided written informed consent.
Author Contributions
CS prepared the original manuscript, figures and tables and analyzed the data. CS, AAF, and OH interpreted the results. TW, CR, AAF, OH, LH, and AF assisted with writing and editing the manuscript, figures and tables. TW and CR performed the experiment. OS calculated the heart rate variability indices from raw data files. TW, CR, MK, TM, MP, and AF conceived and designed the experiment.
Funding
The present study was initiated and funded by the German Federal Institute of Sport Science. The research was realized within the project REGman–Optimization of Training and Competition: Management of Regeneration in Elite Sports (IIA1-081901/12-16). We acknowledge support by the DFG Open Access Publication Funds of the Ruhr-Universität Bochum.
Conflict of Interest Statement
The authors declare that the research was conducted in the absence of any commercial or financial relationships that could be construed as a potential conflict of interest.
Acknowledgments
The authors thank Dr. James A. J. Heathers for his comments during the preparation of the manuscript. We would also like to thank the athletes who participated in this demanding experiment. Preliminary analyzes of the heart rate variability datasets were presented at national and international conferences and abstracts were published in the relevant Book of Abstracts (Schneider et al., 2015a,b, 2017a,b) and mentioned in Schneider et al. (2018, Table 1).
Supplementary Material
The Supplementary Material for this article can be found online at: https://www.frontiersin.org/articles/10.3389/fphys.2019.00582/full#supplementary-material
Table 1.xlsx. Supplementary Tables.
Data Sheet 1.xlsx. Data Sheet.
Data Sheet 2.zip. Data analysis and statistical analysis.
Data Sheet 3.docx. Instructions heart rate recordings.
Image 1.pdf. Supplementary Figures.
Abbreviations
1RM, one-repetition maximum; ANS, Autonomic nervous system; CL, Confidence limits; ddiff, standardized mean difference using SD of differences; dpre, standardized mean difference using between-subject Pre-test SD; HIIT, High-intensity interval training; HR, Heart rate; HRV, Heart rate variability; HR(V), Heart rate and heart rate variability; Ln RMSSD, Natural logarithm of the RMSSD; Ln RMSSD/RR, Ln RMSSD to R-R interval ratio; MVIC, Maximum voluntary isometric contraction; Pre, Baseline testing 1 day prior training microcycle; Post1, Follow-up testing 1 day post overload; Post4, Follow-up testing 4 days post overload; RMSSD, square root of the mean squared differences of successive normal R-R intervals; RSA, Repeated sprint ability; SD, Standard deviation; ST, Strength training; SWC, Smallest worthwhile change; TE, Typical error; VIFT, Peak velocity during the 30-15 Intermittent Fitness Test.
References
Achten, J., and Jeukendrup, A. E. (2003). Heart rate monitoring: applications and limitations. Sports Med. 33, 517–538. doi: 10.2165/00007256-200333070-00004
Al Haddad, H., Laursen, P. B., Chollet, D., Ahmaidi, S., and Buchheit, M. (2011). Reliability of resting and postexercise heart rate measures. Int. J. Sports Med. 32, 598–605. doi: 10.1055/s-0031-1275356
Aubert, A. E., Seps, B., and Beckers, F. (2003). Heart rate variability in athletes. Sports Med. 33, 889–919. doi: 10.2165/00007256-200333120-00003
Barbier, J., Ville, N., Kervio, G., Walther, G., and Carré, F. (2006). Sports-specific features of athlete's heart and their relation to echocardiographic parameters. Herz 31, 531–543. doi: 10.1007/s00059-006-2862-2
Barker, J., McCarthy, P., Jones, M., and Moran, A. (2011). Single Case Research Methods in Sport and Exercise Psychology. Abingdon England, New York, NY: Routledge.
Bellenger, C. R., Fuller, J. T., Thomson, R. L., Davison, K., Robertson, E. Y., and Buckley, J. D. (2016a). Monitoring athletic training status through autonomic heart rate regulation: a systematic review and meta-analysis. Sports Med. 46, 1461–1486. doi: 10.1007/s40279-016-0484-2
Bellenger, C. R., Karavirta, L., Thomson, R. L., Robertson, E. Y., Davison, K., and Buckley, J. D. (2016b). Contextualizing parasympathetic hyperactivity in functionally overreached athletes with perceptions of training tolerance. Int. J. Sports Physiol. Perform. 11, 685–692. doi: 10.1123/ijspp.2015-0495
Bhati, P., Moiz, J. A., Menon, G. R., and Hussain, M. E. (2018). Does resistance training modulate cardiac autonomic control? A systematic review and meta-analysis. Clin. Auton. Res. 29, 75–103. doi: 10.1007/s10286-018-0558-3
Billman, G. E., Cagnoli, K. L., Csepe, T., Li, N., Wright, P., Mohler, P. J., et al. (2015a). Exercise training-induced bradycardia: Evidence for enhanced parasympathetic regulation without changes in intrinsic sinoatrial node function. J Appl Physiol 118, 1344–1355. doi: 10.1152/japplphysiol.01111.2014
Billman, G. E., Huikuri, H. V., Sacha, J., and Trimmel, K. (2015b). An introduction to heart rate variability: methodological considerations and clinical applications. Front. Physiol. 6:55. doi: 10.3389/fphys.2015.00055
Bosquet, L., Merkari, S., Arvisais, D., and Aubert, A. E. (2008). Is heart rate a convenient tool to monitor over-reaching? A systematic review of the literature. Br. J. Sports Med. 42, 709–714. doi: 10.1136/bjsm.2007.042200
Bourdon, P. C., Cardinale, M., Murray, A., Gastin, P., Kellmann, M., Varley, M. C., et al. (2017). Monitoring athlete training loads: consensus statement. Int. J. Sports Physiol. Perform. 12, S2161–S2170. doi: 10.1123/IJSPP.2017-0208
Boyett, M. R., Wang, Y., Nakao, S., Ariyaratnam, J., Hart, G., Monfredi, O., et al. (2017). Point: exercise training-induced bradycardia is caused by changes in intrinsic sinus node function. J Appl Physiol 123, 684–685. doi: 10.1152/japplphysiol.00604.2017
Buchheit, M. (2008). The 30-15 intermittent fitness test: accuracy for individualizing interval training of young intermittent sport players. J. Strength Cond. Res. 22, 365–374. doi: 10.1519/JSC.0b013e3181635b2e
Buchheit, M. (2014). Monitoring training status with HR measures: do all roads lead to Rome? Front. Physiol. 5:73. doi: 10.3389/fphys.2014.00073
Buchheit, M., Al Haddad, H., Laursen, P. B., and Ahmaidi, S. (2009a). Effect of body posture on postexercise parasympathetic reactivation in men. Exp. Physiol. 94, 795–804. doi: 10.1113/expphysiol.2009.048041
Buchheit, M., Laursen, P. B., Al Haddad, H., and Ahmaidi, S. (2009b). Exercise-induced plasma volume expansion and post-exercise parasympathetic reactivation. Eur. J. Appl. Physiol. 105, 471–481. doi: 10.1007/s00421-008-0925-1
Carter, J. B., Banister, E. W., and Blaber, A. P. (2003). Effect of endurance exercise on autonomic control of heart rate. Sports Med. 33, 33–46. doi: 10.2165/00007256-200333010-00003
Chen, J.-L., Yeh, D.-P., Lee, J.-P., Chen, C.-Y., Huang, C.-Y., Lee, S.-D., et al. (2011). Parasympathetic nervous activity mirrors recovery status in weightlifting performance after training. J. Strength Cond. Res. 25, 1546–1552. doi: 10.1519/JSC.0b013e3181da7858
Claudino, J. G., Cronin, J., Mezêncio, B., McMaster, D. T., McGuigan, M., Tricoli, V., et al. (2017). The countermovement jump to monitor neuromuscular status: a meta-analysis. J. Sci. Med. Sport 20, 397–402. doi: 10.1016/j.jsams.2016.08.011
Coutts, A. J., Crowcroft, S., and Kempton, T. (2018). “Developing athlete monitoring systems: theoretical basis and practical applications,” in Sport, Recovery and Performance: Interdisciplinary Insights, ed. M. Kellmann (Abingdon: Routledge), 19–32.
Cumming, G. (2012). Understanding the New Statistics: Effect Sizes, Confidence Intervals, and Meta-Analysis. New York, NY: Routledge.
Dankel, S. J., and Loenneke, J. P. (2018). Effect sizes for paired data should use the change score variability rather than the pre-test variability. J. Strength Cond. Res. doi: 10.1519/JSC.0000000000002946. [Epub ahead of print].
de Paula Simola, R. Á., Raeder, C., Wiewelhove, T., Kellmann, M., Meyer, T., Pfeiffer, M., et al. (2016). Muscle mechanical properties of strength and endurance athletes and changes after one week of intensive training. J. Electromyogr. Kinesiol. 30, 73–80. doi: 10.1016/j.jelekin.2016.05.005
Dickhuth, H. H., Lehmann, M., Auch-Schwelk, W., Meinertz, T., and Keul, J. (1987). Physical training, vegetative regulation, and cardiac hypertrophy. J. Cardiovasc. Pharmacol. 10, S71–S78. doi: 10.1097/00005344-198700106-00009
Fatisson, J., Oswald, V., and Lalonde, F. (2016). Influence diagram of physiological and environmental factors affecting heart rate variability: an extended literature overview. Heart Int. 11, e32–e40. doi: 10.5301/heartint.5000232
Figueiredo, T., Rhea, M. R., Peterson, M., Miranda, H., Bentes, C. M., dos Reis, V. M., et al. (2015a). Influence of number of sets on blood pressure and heart rate variability after a strength training session. J. Strength Cond. Res. 29, 1556–1563. doi: 10.1519/JSC.0000000000000774
Figueiredo, T., Willardson, J. M., Miranda, H., Bentes, C. M., Reis, V. M., and Simão, R. (2015b). Influence of load intensity on postexercise hypotension and heart rate variability after a strength training session. J. Strength Cond. Res. 29, 2941–2948. doi: 10.1519/JSC.0000000000000954
Flannery, D., Howden, E. J., La Gerche, A., Hughson, R. L., Leicht, A. S., Boullosa, D. A., et al. (2017). Commentaries on Point:Counterpoint: Exercise training-induced bradicardia. J Appl Physiol 123, 692–693. doi: 10.1152/japplphysiol.00546.2017
Flatt, A. A., and Esco, M. R. (2013). Validity of the ithlete smart phone application for determining ultra-short-term heart rate variability. J. Hum. Kinet. 39, 85–92. doi: 10.2478/hukin-2013-0071
Flatt, A. A., and Esco, M. R. (2015). Smartphone-derived heart-rate variability and training load in a women's soccer team. Int. J. Sports Physiol. Perform. 10, 994–1000. doi: 10.1123/ijspp.2014-0556
Flatt, A. A., and Howells, D. (2019). Effects of varying training load on heart rate variability and running performance among an Olympic rugby sevens team. J. Sci. Med. Sport 22, 222–226. doi: 10.1016/j.jsams.2018.07.014
Fry, A. C., and Kraemer, W. J. (1997). Resistance exercise overtraining and overreaching: neuroendocrine responses. Sports Med. 23, 106–129. doi: 10.2165/00007256-199723020-00004
González-Badillo, J. J., Rodríguez-Rosell, D., Sánchez-Medina, L., Ribas, J., López-López, C., Mora-Custodio, R., et al. (2016). Short-term recovery following resistance exercise leading or not to failure. Int. J. Sports Med. 37, 295–304. doi: 10.1055/s-0035-1564254
Green, H. J., Thomson, J. A., Ball, M. E., Hughson, R. L., Houston, M. E., and Sharratt, M. T. (1984). Alterations in blood volume following short-term supramaximal exercise. J Appl Physiol. 56, 145–149. doi: 10.1152/jappl.1984.56.1.145
Halson, S. L. (2014). Monitoring training load to understand fatigue in athletes. Sports Med. 44, S139–S147. doi: 10.1007/s40279-014-0253-z
Hammes, D., Skorski, S., Schwindling, S., Ferrauti, A., Pfeiffer, M., Kellmann, M., et al. (2016). Can the Lamberts and Lambert Submaximal Cycle Test indicate fatigue and recovery in trained cyclists? Int. J. Sports Physiol. Perform. 11, 328–336. doi: 10.1123/ijspp.2015-0119
Hautala, A. J., Kiviniemi, A. M., and Tulppo, M. P. (2009). Individual responses to aerobic exercise: the role of the autonomic nervous system. Neurosci. Biobehav. Rev. 33, 107–115. doi: 10.1016/j.neubiorev.2008.04.009
Hecksteden, A., Kraushaar, J., Scharhag-Rosenberger, F., Theisen, D., Senn, S., and Meyer, T. (2015). Individual response to exercise training - a statistical perspective. J Appl Physiol. 118, 1450–1459. doi: 10.1152/japplphysiol.00714.2014
Hecksteden, A., Pitsch, W., Rosenberger, F., and Meyer, T. (2018). Repeated testing for the assessment of individual response to exercise training. J Appl Physiol. 124, 1567–1579. doi: 10.1152/japplphysiol.00896.2017
Hecksteden, A., Skorski, S., Schwindling, S., Hammes, D., Pfeiffer, M., Kellmann, M., et al. (2016). Blood-borne markers of fatigue in competitive athletes - results from simulated training camps. PLoS ONE 11:e0148810. doi: 10.1371/journal.pone.0148810
Heidari, J., Beckmann, J., Bertollo, M., Brink, M., Kallus, W., Robazza, C., et al. (2019). Multidimensional monitoring of recovery status and implications for performance. Int. J. Sports Physiol. Perform. 14, 2–8. doi: 10.1123/ijspp.2017-0669
Hitzschke, B., Wiewelhove, T., Raeder, C., Ferrauti, A., Meyer, T., Pfeiffer, M., et al. (2017). Evaluation of psychological measures for the assessment of recovery and stress during a shock-microcycle in strength and high-intensity interval training. Perform. Enhanc. Health 5, 147–157. doi: 10.1016/j.peh.2017.08.001
Hopkins, W. G. (2004). How to interpret changes in an athletic performance test. Sportsci. 8, 1–7. Retrieved from: http://www.sportsci.org/jour/04/wghtests.pdf.
Hopkins, W. G. (2015a). Individual responses made easy (Editorial). J Appl Physiol 118, 1444–1446. doi: 10.1152/japplphysiol.00098.2015
Hopkins, W. G. (2015b). Spreadsheets for analysis of validity and reliability. Sportsci. 19, 36–42. Retrieved from: http://sportsci.org/2015/ValidRely.htm.
Hopkins, W. G., Marshall, S. W., Batterham, A. M., and Hanin, J. (2009). Progressive statistics for studies in sports medicine and exercise science. Med. Sci. Sports Exerc. 41, 3–12. doi: 10.1249/MSS.0b013e31818cb278
Hopkins, W. G., Schabort, E. J., and Hawley, J. A. (2001). Reliability of power in physical performance tests. Sports Med. 31, 211–234. doi: 10.2165/00007256-200131030-00005
Hottenrott, K., and Hoos, O. (2017). “Heart rate variability analysis in exercise physiology,” in ECG Time Series Variability Analysis: Engineering and Medicine, eds. H. F. Jelinek, D. J. Cornforth, and A. H. Khandoker (Boca Raton, FL: CRC Press), 249–279. doi: 10.4324/9781315372921-11
Kellmann, M. (2010). Preventing overtraining in athletes in high-intensity sports and stress/recovery monitoring. Scand. J. Med. Sci. Sports 20(Suppl. 2), 95–102. doi: 10.1111/j.1600-0838.2010.01192.x
Kellmann, M., Bertollo, M., Bosquet, L., Brink, M., Coutts, A. J., Duffield, R., et al. (2018). Recovery and performance in sport: consensus statement. Int. J. Sports Physiol. Perform. 13, 240–245. doi: 10.1123/ijspp.2017-0759
Kingsley, J. D., and Figueroa, A. (2016). Acute and training effects of resistance exercise on heart rate variability. Clin. Physiol. Funct. Imaging 36, 179–187. doi: 10.1111/cpf.12223
Kingsley, J. D., Hochgesang, S., Brewer, A., Buxton, E., Martinson, M., and Heidner, G. (2014). Autonomic modulation in resistance-trained individuals after acute resistance exercise. Int. J. Sports Med. 35, 851–856. doi: 10.1055/s-0034-1371836
Kinugasa, T., Cerin, E., and Hooper, S. (2004). Single-subject research designs and data analyses for assessing elite athletes' conditioning. Sports Med. 34, 1035–1050. doi: 10.2165/00007256-200434150-00003
Kiviniemi, A. M., Hautala, A. J., Seppänen, T., Mäkikallio, T. H., Huikuri, H. V., and Tulppo, M. P. (2004). Saturation of high-frequency oscillations of R-R intervals in healthy subjects and patients after acute myocardial infarction during ambulatory conditions. Am. J. Physiol. Heart Circ. Physiol. 287, H1921–H1927. doi: 10.1152/ajpheart.00433.2004
Le Meur, Y., Pichon, A., Schaal, K., Schmitt, L., Louis, J., Gueneron, J., et al. (2013). Evidence of parasympathetic hyperactivity in functionally overreached athletes. Med. Sci. Sports Exerc. 45, 2061–2071. doi: 10.1249/MSS.0b013e3182980125
Lehmann, M., Foster, C., Dickhuth, H. H., and Gastmann, U. (1998). Autonomic imbalance hypothesis and overtraining syndrome. Med. Sci. Sports Exerc. 30, 1140–1145. doi: 10.1097/00005768-199807000-00019
Li, Y., Hanssen, H., Cordes, M., Rossmeissl, A., Endes, S., and Schmidt-Trucksäss, A. (2015). Aerobic, resistance and combined exercise training on arterial stiffness in normotensive and hypertensive adults: a review. Eur. J. Sport Sci. 15, 443–457. doi: 10.1080/17461391.2014.955129
Malik, M., Bigger, J. T., Camm, A. J., Kleiger, R. E., Malliani, A., Moss, A. J., et al. (1996). Heart rate variability: Standards of measurement, physiological interpretation, and clinical use. Eur. Heart J. 17, 354–381. doi: 10.1093/oxfordjournals.eurheartj.a014868
Maud, P. J., and Foster, C. (eds.) (2006). Physiological Assessment of Human Fitness. Champaign, IL: Human Kinetics.
Meeusen, R., Duclos, M., Foster, C., Fry, A., Gleeson, M., Nieman, D., et al. (2013). Prevention, diagnosis, and treatment of the overtraining syndrome: joint consensus statement of the European College of Sport Science and the American College of Sports Medicine. Med. Sci. Sports Exerc. 45, 186–205. doi: 10.1249/MSS.0b013e318279a10a
Pareja-Blanco, F., Rodríguez-Rosell, D., Sánchez-Medina, L., Ribas-Serna, J., López-López, C., Mora-Custodio, R., et al. (2017). Acute and delayed response to resistance exercise leading or not leading to muscle failure. Clin. Physiol. Funct. Imaging 37, 630–639. doi: 10.1111/cpf.12348
Penttilä, J., Helminen, A., Jartti, T., Kuusela, T., Huikuri, H. V., Tulppo, M. P., et al. (2001). Time domain, geometrical and frequency domain analysis of cardiac vagal outflow: effects of various respiratory patterns. Clin. Physiol. 21, 365–376. doi: 10.1046/j.1365-2281.2001.00337.x
Perrotta, A. S., Jeklin, A. T., Hives, B. A., Meanwell, L. E., and Warburton, D. E.R. (2017). Validity of the Elite HRV smart phone application for examining heart rate variability in a field based setting. J. Strength Cond. Res. 31, 2296–2302. doi: 10.1519/JSC.0000000000001841
Plews, D. J., Laursen, P. B., Kilding, A. E., and Buchheit, M. (2012). Heart rate variability in elite triathletes, is variation in variability the key to effective training? A case comparison. Eur. J. Appl. Physiol. 112, 3729–3741. doi: 10.1007/s00421-012-2354-4
Plews, D. J., Laursen, P. B., Le Meur, Y., Hausswirth, C., Kilding, A. E., and Buchheit, M. (2014). Monitoring training with heart rate-variability: How much compliance is needed for valid assessment? Int. J. Sports Physiol. Perform. 9, 783–790. doi: 10.1123/ijspp.2013-0455
Plews, D. J., Laursen, P. B., Stanley, J., Kilding, A. E., and Buchheit, M. (2013). Training adaptation and heart rate variability in elite endurance athletes: opening the door to effective monitoring. Sports Med. 43, 773–781. doi: 10.1007/s40279-013-0071-8
Plews, D. J., Scott, B., Altini, M., Wood, M., Kilding, A. E., and Laursen, P. B. (2017). Comparison of heart-rate-variability recording with smartphone photoplethysmography, Polar H7 chest strap, and electrocardiography. Int. J. Sports Physiol. Perform. 12, 1324–1328. doi: 10.1123/ijspp.2016-0668
Quintana, D. S., Heathers, J. A., and Kemp, A. H. (2012). On the validity of using the Polar RS800 heart rate monitor for heart rate variability research. Eur. J. Appl. Physiol. 112, 4179–4180. doi: 10.1007/s00421-012-2453-2
Raeder, C., Wiewelhove, T., Simola, R. Á. D. P., Kellmann, M., Meyer, T., Pfeiffer, M., et al. (2016). Assessment of fatigue and recovery in male and female athletes after 6 days of intensified strength training. J. Strength Cond. Res. 30, 3412–3427. doi: 10.1519/JSC.0000000000001427
Saboul, D., Pialoux, V., and Hautier, C. (2013). The impact of breathing on HRV measurements: implications for the longitudinal follow-up of athletes. Eur. J. Sport Sci. 13, 534–542. doi: 10.1080/17461391.2013.767947
Sandercock, G. R., Bromley, P. D., and Brodie, D. A. (2005). Effects of exercise on heart rate variability: inferences from meta-analysis. Med. Sci. Sports Exerc. 37, 433–439. doi: 10.1249/01.MSS.0000155388.39002.9D
Saw, A. E., Main, L. C., and Gastin, P. B. (2016). Monitoring the athlete training response: subjective self-reported measures trump commonly used objective measures: a systematic review. Br. J. Sports Med. 50, 281–291. doi: 10.1136/bjsports-2015-094758
Schmitt, L., Regnard, J., Desmarets, M., Mauny, F., Mourot, L., Fouillot, J.-P., et al. (2013). Fatigue shifts and scatters heart rate variability in elite endurance athletes. PLoS ONE 8:e71588. doi: 10.1371/journal.pone.0071588
Schmitt, L., Regnard, J., and Millet, G. P. (2015a). Monitoring fatigue status with HRV measures in elite athletes: an avenue beyond RMSSD? Front. Physiol. 6:343. doi: 10.3389/fphys.2015.00343
Schmitt, L., Regnard, J., Parmentier, A. L., Mauny, F., Mourot, L., Coulmy, N., et al. (2015b). Typology of “Fatigue” by heart rate variability analysis in elite nordic-skiers. Int. J. Sports Med. 36, 999–1007. doi: 10.1055/s-0035-1548885
Schneider, C., Hanakam, F., Wiewelhove, T., Döweling, A., Kellmann, M., Meyer, T., et al. (2018). Heart rate monitoring in team sports—a conceptual framework for contextualizing heart rate measures for training and recovery prescription. Front. Physiol. 9:639. doi: 10.3389/fphys.2018.00639
Schneider, C., Schumbera, O., Raeder, C., Wiewelhove, T., and Ferrauti, A. (2015a). “Effect of an intensive strength training microcycle on resting heart rate variability,” in Book of Abstracts of the 20th Annual Congress of the European College of Sport Science, Malmö - Sweden, 24th−27th June 2015, eds. A. Radmann, S. Hedenborg, and E. Tsolakidis (Malmö), 198.
Schneider, C., Schumbera, O., Raeder, C., Wiewelhove, T., and Ferrauti, A. (2015b). “Einfluss eines intensiven Krafttrainings-Mikrozyklus auf die Herzfrequenzvariabilität unter Ruhebedingungen,” in Abstactband dvs-Tagung der Sektion Trainingswissenschaft: Krafttraining: ≪Kraftvoll durchs Leben≫, ed. Deutsche Vereinigung für Sportwissenschaft (Potsdam), 45.
Schneider, C., Wiewelhove, T., Raeder, C., Döweling, A., and Ferrauti, A. (2017a). “Heart rate measures during a HIIT shock microcycle - a methodological comparison,” in Book of Abstracts of the 22nd Annual Congress of the European College of Sport Science: 5th - 8th July 2017, MetropolisRuhr - Germany, eds. A. Ferrauti, P. Platen, E. Grimminger-Seidensticker, T. Jaitner, U. Bartmus, L. Becher, A. Ferrauti, P. Platen, E. Grimminger-Seidensticker, T. Jaitner, U. Bartmus, L. Becher, M. de Marées, T. Mühlbauer, A. Schauerte, T. Wiewelhove, E. Tsolakidis (Essen), 443.
Schneider, C., Wiewelhove, T., Raeder, C., Döweling, A., and Ferrauti, A. (2017b). “HRV-Monitoring während eines HIIT Schock-Mikrozyklus – Möglichkeiten der uni- und multivariaten Datenanalyse,” in Training im Sport - Jahrestagung der dvs-Sektion Trainingswissenschaft: Tagungsband & Abstracts, eds. R. Collette, S. Endler, T. Pelzer, C. Rasche, C. Winter, and M. Pfeiffer (Mainz: Zentraldruckerei der Johannes Gutenberg-Universität Mainz), 80–81.
Schwellnus, M., Soligard, T., Alonso, J. M., Bahr, R., Clarsen, B., Dijkstra, H. P., et al. (2016). How much is too much? (Part 2) International Olympic Committee consensus statement on load in sport and risk of illness. Br. J. Sports Med. 50, 1043–1052. doi: 10.1136/bjsports-2016-096572
Seiler, S., Haugen, O., and Kuffel, E. (2007). Autonomic recovery after exercise in trained athletes: Intensity and duration effects. Med. Sci. Sports Exerc. 39, 1366–1373. doi: 10.1249/mss.0b013e318060f17d
Soligard, T., Schwellnus, M., Alonso, J.-M., Bahr, R., Clarsen, B., Dijkstra, H. P., et al. (2016). How much is too much? (Part 1) International Olympic Committee consensus statement on load in sport and risk of injury. Br. J. Sports Med. 50, 1030–1041. doi: 10.1136/bjsports-2016-096581
Stanley, J., Peake, J. M., and Buchheit, M. (2013). Cardiac parasympathetic reactivation following exercise: implications for training prescription. Sports Med. 43, 1259–1277. doi: 10.1007/s40279-013-0083-4
Starling, L. T., and Lambert, M. I. (2018). Monitoring rugby players for fitness and fatigue: what do coaches want? Int. J. Sports Physiol. Perform. 13, 777–782. doi: 10.1123/ijspp.2017-0416
Swinton, P. A., Hemingway, B. S., Saunders, B., Gualano, B., and Dolan, E. (2018). A statistical framework to interpret individual response to intervention: paving the way for personalized nutrition and exercise prescription. Front. Nutr. 5:41. doi: 10.3389/fnut.2018.00041
Tarvainen, M. P., Niskanen, J.-P., Lipponen, J. A., Ranta-Aho, P. O., and Karjalainen, P. A. (2014). Kubios HRV-heart rate variability analysis software. Comput. Methods Programs Biomed. 113, 210–220. doi: 10.1016/j.cmpb.2013.07.024
Thorpe, R. T., Atkinson, G., Drust, B., and Gregson, W. (2017). Monitoring fatigue status in elite team-sport athletes: implications for practice. Int. J. Sports Physiol. Perform. 12, S227–S234. doi: 10.1123/ijspp.2016-0434
Trimmel, K., Sacha, J., and Huikuri, H. V. (eds.). (2015). Heart Rate Variability: Clinical Applications and Interaction Between HRV and Heart Rate. Lausanne: Frontiers Media. doi: 10.3389/978-2-88919-652-4
Urhausen, A., Gabriel, H., and Kindermann, W. (1995). Blood hormones as markers of training stress and overtraining. Sports Med. 20, 251–276. doi: 10.2165/00007256-199520040-00004
Urhausen, A., and Kindermann, W. (2002). Diagnosis of overtraining: what tools do we have? Sports Med. 32, 95–102. doi: 10.2165/00007256-200232020-00002
Way, K. L., Sultana, R. N., Sabag, A., Baker, M. K., and Johnson, N. A. (2019). The effect of high Intensity interval training versus moderate intensity continuous training on arterial stiffness and 24h blood pressure responses: a systematic review and meta-analysis. J. Sci. Med. Sport 22, 385–391. doi: 10.1016/j.jsams.2018.09.228
Keywords: orthostatic test, cardiac autonomic nervous system, fatigue, recovery, individual response, multivariate analysis, resistance training, overreaching
Citation: Schneider C, Wiewelhove T, Raeder C, Flatt AA, Hoos O, Hottenrott L, Schumbera O, Kellmann M, Meyer T, Pfeiffer M and Ferrauti A (2019) Heart Rate Variability Monitoring During Strength and High-Intensity Interval Training Overload Microcycles. Front. Physiol. 10:582. doi: 10.3389/fphys.2019.00582
Received: 31 January 2019; Accepted: 25 April 2019;
Published: 22 May 2019.
Edited by:
Alessandro Moura Zagatto, Universidade Estadual Paulista Júlio de Mesquita Filho (UNESP), BrazilReviewed by:
Tiago Peçanha, University of São Paulo, BrazilDavid Herzig, Bern University Hospital, Switzerland
Diego Christofaro, São Paulo State University, Brazil
Copyright © 2019 Schneider, Wiewelhove, Raeder, Flatt, Hoos, Hottenrott, Schumbera, Kellmann, Meyer, Pfeiffer and Ferrauti. This is an open-access article distributed under the terms of the Creative Commons Attribution License (CC BY). The use, distribution or reproduction in other forums is permitted, provided the original author(s) and the copyright owner(s) are credited and that the original publication in this journal is cited, in accordance with accepted academic practice. No use, distribution or reproduction is permitted which does not comply with these terms.
*Correspondence: Christoph Schneider, christoph.schneider-a5c@ruhr-uni-bochum.de