 Angela M. Otto
- Munich School of BioEngineering, Technical University of Munich, Garching, Germany
The metabolism of cancer cells is an issue of dealing with fluctuating and limiting levels of nutrients in a precarious microenvironment to ensure their vitality and propagation. Glucose and glutamine are central metabolites for catabolic and anabolic metabolism, which is in the limelight of numerous diagnostic methods and therapeutic targeting. Understanding tumor metabolism in conditions of nutrient depletion is important for such applications and for interpreting the readouts. To exemplify the metabolic network of tumor cells in a model system, the fate 13C6-glucose was tracked in a breast cancer cell line growing in variable low glucose/low glutamine conditions. 13C-glucose-derived metabolites allowed to deduce the engagement of metabolic pathways, namely glycolysis, the TCA-cycle including glutamine and pyruvate anaplerosis, amino acid synthesis (serine, glycine, aspartate, glutamate), gluconeogenesis, and pyruvate replenishment. While the metabolic program did not change, limiting glucose and glutamine supply reduced cellular metabolite levels and enhanced pyruvate recycling as well as pyruvate carboxylation for entry into the TCA-cycle. Otherwise, the same metabolic pathways, including gluconeogenesis, were similarly engaged with physiologically saturating as with limiting glucose and glutamine. Therefore, the metabolic plasticity in precarious nutritional microenvironment does not require metabolic reprogramming, but is based on dynamic changes in metabolite quantity, reaction rates, and directions of the existing metabolic network.
Introduction—Cancer Cells in a Limiting Nutritional Microenvironment
Cancers consist of a plethora of cells with different metabolic phenotypes in a microenvironment of fluctuating nutrient availability, along with other changes in physico-chemical variables supporting or jeopardizing cell survival (Figure 1). This cellular heterogeneity poses a challenge for metabolic imaging, diagnosis and chemo-therapeutic targeting in the clinic. It is also a challenge for designing analytical conditions, namely, appropriate cell cultivation systems laid out for drug screening and preclinical testing. It is thus imperative from different perspectives to understand how the metabolism of cancer cells responds to changes in a precarious microenvironment (3).
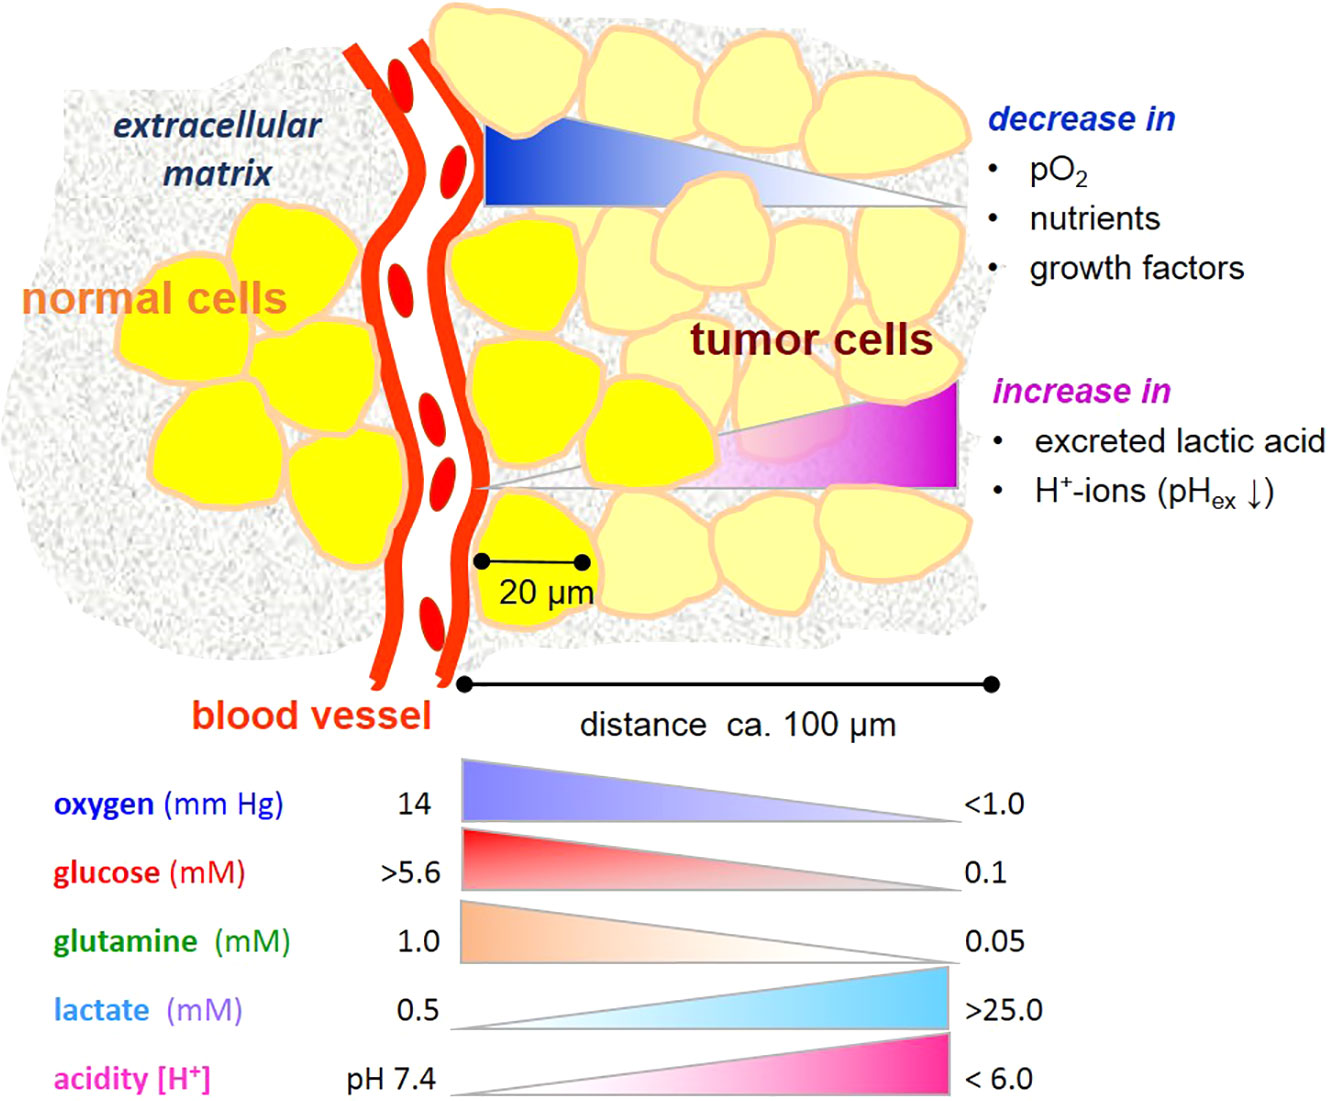
Figure 1 Gradients microenvironmental variables affecting metabolism of tumor cells. Note that the gradients are unlikely to be linear. Values are taken from references (1, 2).
Considering that numerous views and reviews have been written on cancer metabolism (3–6), each highlighting a different angle of the biochemistry and molecular biology of uncontrollable growth of cancer cells—which new perspective will be taken here? Our basic understanding of cancer metabolism has been shaped by studying cancer cells cultured mainly in saturating nutrient conditions, i.e. those resembling a well-fed, even diabetic physiology. However, metabolic plasticity of cancer cells is a feature for adapting to varying, often limiting levels of nutrients. How does a limiting supply of nutrients affect cancer metabolism? Is it a matter of metabolite quantity or of metabolic reprogramming?
In physiological conditions, blood contains about 0.6 mM glutamine and 5–11 mM glucose, depending on the nutritional state (7, 8). Within most cancers, and also in many normal tissues, these levels markedly decrease with increasing distance from a blood vessel and consumption by neighboring cells (Figure 1). On the other hand, cells may release metabolic products, e.g. amino acids and lactate, useful to neighboring cells. Even though the “Warburg effect”, i.e. aerobic glycolysis producing lactate, is considered to be one of the hallmarks of cancer (9), it is not unique to tumor cells, being also typical of several other cell types with high energy metabolism and/or proliferative propensity (10). Moreover, deviant glycolytic activity leading to excess lactate production is not the only inception for metabolic rearrangement in tumor cells. Metabolic plasticity is a survival trait for tumor cells in a microenvironment becoming increasingly depleted of nutrients. Few studies have addressed effects of glucose and glutamine deprivation in this context, and these indeed show that the limitation of either glucose or glutamine has profound effects on cancer cell growth (11), depending on the cell type and its oncogenic genotype, such as the expression of the tumor suppressor gene CC3/TIP30 (12), c-myc expression (13), and K-ras transfection (14). Also, a misbalance of glucose and glutamine levels adversely impacts glycolysis and can jeopardize cell viability (15), as will be further elucidated below.
The question here is thus: how does the metabolic phenotype change in tumor cells when both glucose and glutamine are limiting, as may occur in a precarious tumor microenvironment? In this review, I will track the fate of 13C6-labeled glucose and its derived metabolites in conditions of different levels of glutamine in MCF-7 cells, a low-malignant cell line expressing estrogen and progesterone receptors as well as the oncogenes p53 and c-myc (16, 17). Metabolite detection by gas chromatography with mass spectrometry (GC-MS) allows to identify and semi-quantify a number of metabolites with regards to 1) their cellular levels; 2) their 13C-enrichment, which is a product of the metabolite pool and metabolic flux; and 3) 13C-isotope profiles, which provide information on different metabolic roads taken by 13C-glucose-derived metabolites (18–21). These analyses attest pyruvate a key role in metabolic plasticity.
The Glycolytic Road to the Pyruvate Junction
Glucose and Glutamine—A Metabolic Affair
The degradation of glucose to pyruvate requires nine enzymatic steps. Firstly, however, glucose must be taken up by the cell. MCF-7 cells express the glucose transporters GLUT1 and GLUT3, whose levels are increased in hypoglycemic conditions and are rate limiting for glycolysis (22). GLUT1 is prominent in most cells, having a KM in the range of 2–3 mM in MCF-7 cells (23). The high affinity of this transporter ensures that low glucose is taken up avidly. The first intracellular enzyme encountered is hexokinase (KM = 0.1 mM), which rapidly phosphorylates glucose and is one of the flux-controlling enzymes of glycolysis (24). Maximal glycolytic activity is thus initiated with glucose well below normal physiological blood concentrations. The glycolytic flux is further regulated by the rate-limiting enzymes phosphofructokinase and, ultimately, monocarboxylate transporter 4 (MCT4) (24), responsible for expelling excess lactate out of the cell (25, 26). The observation that the expression of lactate dehydrogenase (LDH) did not show a flux-regulating effect is supported by data showing that its activities correlate poorly with other glycolytic parameters [see below (15, 27)].
Even though glutamine is not an essential amino acid for human cells, its extracellular level has a profound influence on glucose metabolism (28), and the balance of extracellular glucose to glutamine is a fundamental metabolic parameter (15). In cell cultures, the amount of glucose removed from the medium is a measure for cellular consumption, which depends on glucose availability as well as the cell’s metabolic demand; and this is co-dependent on the concentration of glutamine. Compared to other limiting conditions, MCF-7 cells were more viable with a balanced combination of low glutamine (0.1 mM) and 2.5 mM glucose than with the misbalanced combination of saturating glutamine (1 mM) and 1 mM glucose; the latter attenuated glycolytic activities, reduced NAD+/NADH ratio, and resulted in cell death (15). Therefore, coherent with a similar observation with MDA-MB231 cells (14), glutamine could not rescue these cells from glucose deprivation. Thus, an imbalance of glycolysis and glutaminolysis invokes metabolic distress.
Turnoff to Serine and Glycine Synthesis
Along the glycolytic path, 3-phosphoglycerate is at the turn off to serine and glycine synthesis, which is intimately related to glycolytic activity (29). The extracellular level of serine (in cell culture medium) is usually 400 µM, and thus saturating for its transporter ASCT2, which has a KM of approximately 20 µM (30); intracellular and extracellular concentrations are reported to be in equilibrium (31). Nevertheless, the intracellular levels of serine and glycine in MCF-7 cells varied depending also on the combinations of low glucose/glutamine. Notably, the serine pool was not any higher with 25 mM than with 2.5 mM glucose. However, the 13C-labeling of serine and glycine from 13C6-glucose indicates that they are also synthesized de novo, albeit at a very low level of 1%–3% (27), which may be essential for one-carbon metabolism (29). Moreover, the enrichment of 13C-glycine stands out in that it is 3–5-fold higher in the saturating than in low glucose conditions, which may reflect the enhanced requirements for one-carbon metabolism of proliferative cells in high glucose/glutamine conditions. Altogether, these results illustrate how the availability of glucose and glutamine affect serine synthesis (32).
The Pyruvate Junction
The end product of glycolysis is pyruvate (Figure 2A). The final enzymatic step converting phosphoenol pyruvate (PEP) to pyruvate is controlled by pyruvate kinase (PK), the reaction being virtually irreversible due its ATP production. Increased expression of the PKM2 isoform is found in many cancer cells, albeit often in its dimeric less active state (33); and being an allosteric enzyme, several metabolites regulate its activity, including alanine and serine (29, 34). In extracts of MCF-7 cells, PK activity was about 2-3 fold lower in limiting than in saturating glucose/glutamine conditions (27). However, cells in low (2.5. mM) glucose had a higher PK activity with 0.1 mM than with 1 mM glutamine. This is again evidence for glutamine in misbalance with glucose suppressing glycolysis (15).
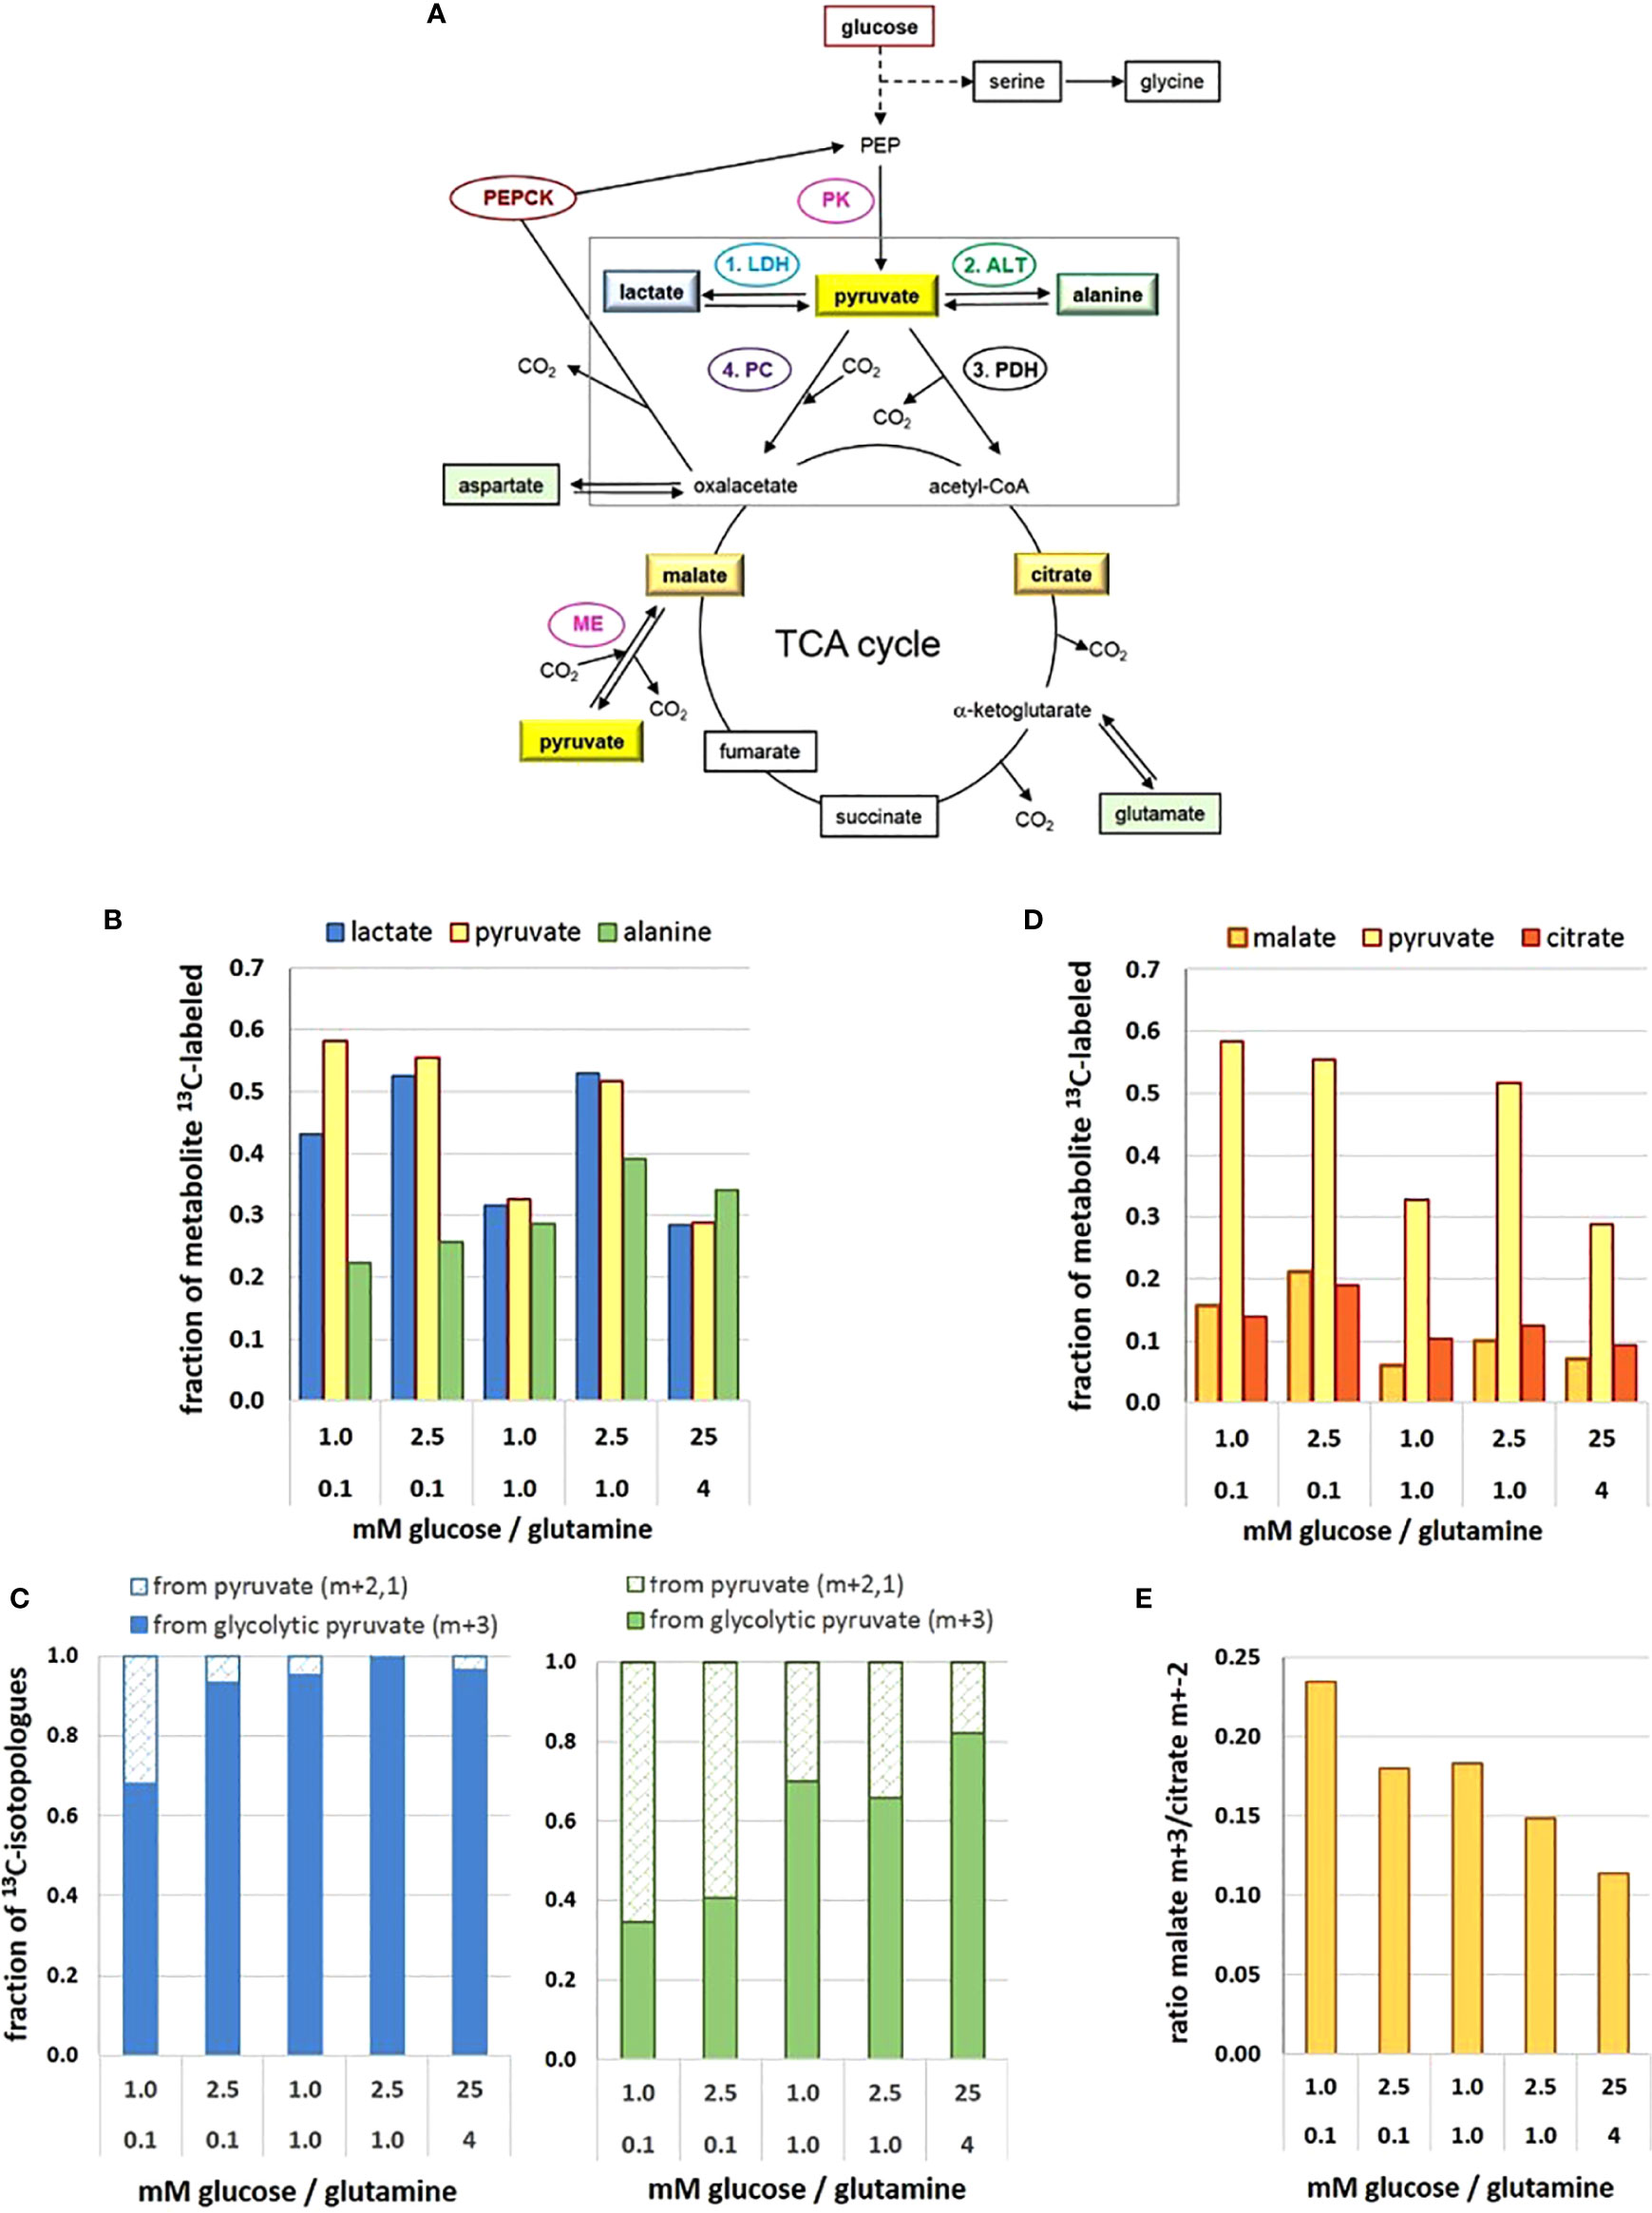
Figure 2 Metabolic flux and pathways to and from the pyruvate junction depend on glucose/glutamine concentrations. (A) Pathways of 13C-glucose-derived metabolites and the pyruvate junction. (B) 13C-enrichment of pyruvate, lactate, and alanine pools; (C) changes in the fraction of 13C-isotopologue profiles of lactate (left) and alanine (right) derived from either glycolytic (m+3) or replenished (m+2,1) 13C-pyruvate; (D) 13C-enrichment of pyruvate, malate and citrate pools; (E) changes in the ratio of 13C3-pyruvate carboxylation versus decarboxylation as indicated by the 13C-malate m+3/13C-citrate m+2 ratio. The figure is based on data obtained following a 2h 13C6-glucose incubation, retrieved and calculated from (27). Detected 13C-labeled metabolites are framed. ALT, alanine aminotransferase; LDH, lactate dehydrogenase; ME, malic enzyme; PDH, pyruvate dehydrogenase complex; PC, pyruvate carboxylase; PK, pyruvate kinase.
In comparison to a range of other glucose-derived metabolites in MCF-7 cells, the level of pyruvate in cell extracts was remarkably low, estimated at 10–100 µM (35), with little variation in the different limiting conditions, but being about 3-fold higher in the 25 mM glucose conditions (27). However, upon incubation with 13C6-glucose, 13C-enrichment of pyruvate amounted up to about 60% in the different low glucose/glutamine conditions (Figure 2B), with the exception of the misbalanced 1 mM glucose/1 mM glutamine combination, where 13C-enrichment was only about 30%. The unexpectedly low 13C-enrichment with 25 mM 13C6-glucose is explained by a high intracellular metabolite level and thus limited glucose uptake. The differences in 13C-enrichment values corresponded well with the respective PK activities (27). Thus at the terminus of glycolysis, enrichment of 13C3-pyruvate reflects differences in glycolytic flux resulting from differences in low glucose and glutamine concentrations.
Metabolic Decisions at the Pyruvate Junction
Pyruvate constitutes a metabolic junction with different options: 1) NADH-mediated reduction to lactate, 2) glutamine-mediated amination to alanine, 3) carboxylation to oxaloacetate, and 4) decarboxylation to acetyl-CoA (Figure 2A). The road taken will depend on the metabolic needs of the cell, thereby endowing the cells with high metabolic plasticity.
Conversion to Lactate
In cancer cells, most of the glycolytic pyruvate is rapidly converted to lactate in the cytosol, catalyzed by lactate dehydrogenase of type A (LDH-A). However, the metabolic differences of MCF-7 cells in the different glucose/glutamine conditions were not mirrored in their LDH-A activity. Moreover, in MCF-7 cells, activity of LDH-A was lower than that of pyruvate kinase—an observation which cannot be generalized for other cell types. Indeed, LDH-A is not considered to be a flux controlling enzyme in glycolysis and for lactate export (24). Instead, MCT4 appears to be the controlling element for lactate release (26) and responsible for maintaining a constant intracellular lactate level. The amounts of lactate released in the different conditions (within 72 h) showed only small variations, ranging from about 0.5 to 0.8 µmol/10e5 cells for media initially containing 1 to 5.6 mM glucose, respectively (27); this amounted to an accumulation of lactate between 1 and 5 mM, increasing with the cell number. Thus, lactate release is not affected by its extracellular level, but rather managed by the efflux activity of MCTs (26).
In the intracellular compartment, the level of lactate was about 45- to 70-fold higher than that of pyruvate, depending on the glucose/glutamine combination. Lactate maintained a basal level of about 2–4 mM, showing little variation with respect to different limiting glucose/glutamine conditions, with the exception of temporal increases up to 20 mM with the balanced combination of 2.5 mM glucose/0.1 mM glutamine. Also, in saturating conditions (25 mM glucose) the basal lactate level of MCF-7 cells was enhanced up to about 40 mM (27), which might be explained by the saturation of export capacity for lactate in relation to its production rate. Notably, there appears to be no direct quantitative relationship between available glucose and the corresponding intracellular lactate levels.
The 13C-enrichment of 13C-lactate was very similar to that of 13C-pyruvate, as to be expected for its rapid turnover by LDH-A (Figure 2B). This suggests that pyruvate is a metabolite which is not stored by the cell and fosters the idea that lactate serves as a reservoir for rapidly providing pyruvate when needed (27). The 13C-tracer experiments indicate that the main flux of 13C-pyruvate was to 13C- lactate, but this depended on the levels of glucose and glutamine. Moreover, analyzing the 13C- isotopologues m+3,2,1 (m = number of 13C per molecule) showed that in standard high glucose conditions, 99% of 13C-lactate was m+3, that is, derived from 13C3 –pyruvate directly from glycolysis (denoted here as “glycolytic pyruvate”). In contrast, in the most precarious conditions (1 mM glucose/0.1 mM glutamine) only 75% of 13C3- lactate came from glycolytic pyruvate (Figure 2C). The increased fraction of the pyruvate and lactate isotopologues with m+2,1, however, indicates that these molecules were no longer a direct product of glycolysis. Instead, 13C2-pyruvate can result from a 1. round of the TCA-cycle providing 13C2-malate, which is decarboxylated to 13C2-pyruvate via the mitochondrial malic enzyme (36). Isotopologues of m+1 can also evolve depending on the availability of 13C-pyruvate or 13C-oxaloacetate in further TCA-cycles. Either way, glycolytic pyruvate can be replenished via the TCA-cycle.
Conversion to Alanine
The direct amination of pyruvate via the (glutamine-dependent) alanine aminotransferase (ALT) leads to alanine. Its cellular levels were generally much lower than those of lactate, but very sensitive to different low glucose/glutamine concentrations; also, alanine was 10-fold higher in the standard than the most limiting glucose conditions (27). Remarkably, 13C- enrichment of alanine derived from 13C6-glucose did not reflect that of 13C-pyruvate, as might be expected from a direct amination reaction (Figure 2B). With increasing nutrient availability 13C-alanine enrichment showed only moderate increases, implying that sufficient alanine levels could be achieved with low glucose and glutamine. Interestingly, in conditions with 0.1 mM glutamine, the 13C-enrichment kinetics of alanine (up to 20 h) resembled those of 13C-labeled TCA-metabolites (27), suggesting its conversion via the mitochondrial ALT2, which has high pyruvate affinity (37). At higher glutamine concentrations, however, 13C-alanine flux resembled that of pyruvate and lactate, suggesting a cytosolic conversion by ALT1. The isotopologues profiles of alanine with a low fraction of m+3, particularly in limiting glutamine conditions (Figure 2C), suggests that glycolytic pyruvate may not be the major precursor for alanine (Figure 2C), as will be discussed further below.
Decarboxylation to Acetyl-CoA
The most efficient way for pyruvate serving the cells’ energy and anabolic needs is its entry into the TCA cycle (Figure 2A). The mitochondrial import carrier (MPC) has a KM for pyruvate of about 150 µM (38), and for its decarboxylation the allosteric enzyme complex pyruvate dehydrogenase (PDH) has a KM of 17–36 µM (39), suggesting that pyruvate uptake is not rate-limiting for PDH activity. The level of citrate was found to be similarly low as that of pyruvate, being almost invariable in the different conditions (27). In contrast, the flux of 13C- metabolites in the TCA cycle was both glucose and glutamine dependent (Figure 2D), 13C-enrichment being up to 20% with low glucose/glutamine conditions, but < 10% with saturating glutamine conditions. Such reduced 13C-levels were most evident for 13C-glutamate, 13C-succinate, 13C-fumarate, 13C-malate and 13C-aspartate, indicative of glutamine anaplerosis via alpha-ketoglutarate. Moreover, similarities in glucose/glutamine dependent 13C-enrichment patterns for these metabolites suggest that there is no reprogramming of the canonical progression through the TCA-cycle, but rather a change in the flux rate depending on metabolite levels. Analyzing the 13C- isotopologues from the 1. round TCA-cycle revealed that in the various limiting conditions about 35%–48% of citrate (m+2) came from glycolytic pyruvate (m+3), while in saturating conditions the utilization of the glycolytic pyruvate for citrate exceeded 60% (27). This increased demand for glycolytic pyruvate could be explained by a higher metabolic flux for oxidative and anabolic metabolism to support enhanced cell proliferation.
Carboxylation to Oxaloacetate
Another function of pyruvate is to feed the TCA-cycle by being carboxylated to oxaloacetate via the mitochondrial pyruvate carboxylase (PC), thereby also contributing the precursor for its acetylation to citrate as well as for other metabolic pathways (40). Since oxaloacetate was not detectable in the experimental setup, 13C- glucose-derived oxalate was estimated indirectly via 13C-malate, (Figure 2D) (27). 13C-enrichment of malate was almost 20% in conditions with 0.1 mM glutamine, in contrast to ≤ 10% for cells with higher glutamine levels, reflecting the influence of glutamine anaplerosis. However, isotopologue profiling, showed that 13C-malate had not only the expected m+2 signature, but also a higher fraction of m+3 isotopologues than 13C-succinate. This indicates carboxylation of glycolytic 13C3-pyruvate (Figure 2A).
Both pyruvate carboxylation and decarboxylation taking place in the mitochondria calls for a metabolic decision. In this cellular model, the 13C-isotopologue profiles of citrate and malate revealed that pyruvate decarboxylation to acetyl-CoA was preferred over pyruvate carboxylation to oxaloacetate by a factor of about 4–10, whereby cells in limiting glucose/glutamine had a 2-fold higher preference for channeling glycolytic pyruvate to oxaloacetate than the satiated cells (Figure 2E). This illustrates how nutritional availability can change the port of entry for pyruvate into the TCA-cycle.
Roundabouts for Glucose-Derived Metabolites
Pyruvate Replenishment
Not only glycolytic 13C3-pyruvate but also 13C-pyruvate replenished from the TCA-cycle can serve as a substrate for 13C-alanine and 13C-lactate (27). The isotopologue fractions m+2,1 of 13C-lactate and 13C-alanine varied between 5% and 45%, depending on the glucose/glutamine conditions (Figures 2C, D). While over 95% of 13C-lactate came directly from glycolytic 13C-pyruvate in saturating conditions, this applied to only 70% in the most limiting glucose/glutamine conditions. Even more pronounced, in limiting glucose/glutamine conditions over 60% of 13C- alanine originated from replenished pyruvate (Figure 2C), while in saturating conditions, it was less than 20%. There are various reports suggesting a metabolic compartmentation of pyruvate (41, 42); the differential conversion of pyruvate supports such a concept. Moreover, the isotopologue profiles suggest that pyruvate comes from different metabolic backgrounds. Thus pyruvate metabolism is at the hub of metabolic plasticity.
Gluconeogenesis
Recent work has established gluconeogenesis as a fundamental element of glucose metabolism in cancer cells, with the activity of phosphoenolpyruvate kinase (PEPCK) converting oxaloacetate to phosphoenolpyruvate (PEP), especially with glucose deprivation (43–46) (Figure 2A). Evidence for gluconeogenesis being involved in different nutrient conditions is provided by the isotopologue distribution of 13C-serine which, along with the expected glycolytic m+3, has an approximately 50% fraction of m+2,1 (27). This corroborates reports on gluconeogenesis contributing to serine synthesis (46, 47). The highest value of the combined m+2,1 fractions of over 70% was actually found with high glucose conditions, suggesting that the reversal of the glycolytic pathway is not reserved for precarious nutrient conditions.
Concluding Thoughts
This narrative of tracking the fate of 13C-glucose illustrates how tumor cells in a microenvironment of fluctuating glucose and glutamine levels can employ a remarkably conservative metabolic program, but use it with high flexibility when rapidly adapting to limiting nutrient conditions. This adaptation employs dynamic modes in tuning metabolite levels, enzyme activities, flux rates, and bi-directionality of metabolic pathways. Here, pyruvate is a central metabolite for different metabolic paths, with pyruvate anaplerosis and replenishment having key roles by sustaining and regulating processes for a coordinated glucose and glutamine metabolism. Such metabolic plasticity constitutes a challenge for developing targeted and reliable diagnostic tools and therapeutic strategies in cancer.
Author Contributions
The author confirms being the sole contributor of this work and has approved it for publication.
Funding
The author’s work was funded by the German Research Council (2012.094.1) (DFG OT 92/3-2) and the Wilhelm Sander-Stiftung (2012.094.1), Munich, Germany.
Conflict of Interest
The author declares that the research was conducted in the absence of any commercial or financial relationships that could be construed as a potential conflict of interest.
Acknowledgments
I thank Wolfgang Eisenreich for fruitful discussion and reading the manuscript.
References
1. Kallinowski F, Runkel S, Fortmeyer HP, Forster H, Vaupel P. L-glutamine: a major substrate for tumor cells in vivo? J Cancer Res Clin Oncol (1987) 113(3):209–15. doi: 10.1007/BF00396375
2. Schaefer C, Mayer WK, Kruger W, Vaupel P. Microregional distributions of glucose, lactate, ATP and tissue pH in experimental tumours upon local hyperthermia and/or hyperglycaemia. J Cancer Res Clin Oncol (1993) 119(10):599–608. doi: 10.1007/BF01372723
3. Vander Heiden MG, DeBerardinis RJ. Understanding the Intersections between Metabolism and Cancer Biology. Cell (2017) 168(4):657–69. doi: 10.1016/j.cell.2016.12.039
4. Icard P, Lincet H. A global view of the biochemical pathways involved in the regulation of the metabolism of cancer cells. Biochim Biophys Acta - Rev Cancer (2012) 1826(2):423–33. doi: 10.1016/j.bbcan.2012.07.001
5. Alfarouk KO, Ibrahim ME, Gatenby RA, Brown JS. Riparian ecosystems in human cancers. Evol Appl (2013) 6(1):46–53. doi: 10.1111/eva.12015
6. Reshkin SJ, Cardone RA, Harguindey S. Na+-H+ Exchanger, pH Regulation and Cancer. Rec Pat Anti Canc Drug Dis (2013) 8(1):85–99. doi: 10.2174/1574892811308010085
7. Gullino PM, Clark SH, Grantham FH. The interstitial fluid of solid tumors. Cancer Res (1964) 24:780–94.
8. Felig P, Wahren J, Raf L. Evidence of inter-organ amino-acid transport by blood cells in humans. Proc Natl Acad Sci USA (1973) 70(6):1775–9. doi: 10.1073/pnas.70.6.1775
9. Hanahan D, Weinberg RA. Hallmarks of cancer: the next generation. Cell (2011) 144:646–74. doi: 10.1016/j.cell.2011.02.013
10. Stark H, Fichtner M, Konig R, Lorkowski S, Schuster S. Causes of upregulation of glycolysis in lymphocytes upon stimulation. A comparison with other cell types. Biochimie (2015) 118:185–94. doi: 10.1016/j.biochi.2015.09.017
11. Dang CV. Glutaminolysis Supplying carbon or nitrogen or both for cancer cells? Cell Cycle (2010) 9(19):3884–6. doi: 10.4161/cc.9.19.13302
12. Chen V, Shtivelman E. CC3/TIP30 regulates metabolic adaptation of tumor cells to glucose limitation. Cell Cycle (2010) 9(24):4941–53. doi: 10.4161/cc.9.24.14230
13. Yuneva M, Zamboni N, Oefner P, Sachidanandam R, Lazebnik Y. Deficiency in glutamine but not glucose induces MYC-dependent apoptosis in human cells. J Cell Biol (2007) 178(1):93–105. doi: 10.1083/jcb.200703099
14. Gaglio D, Metallo CM, Gameiro PA, Hiller K, Danna LS, Balestrieri C, et al. Oncogenic K-Ras decouples glucose and glutamine metabolism to support cancer cell growth. Mol Syst Biol (2011) 7:523. doi: 10.1038/msb.2011.56
15. Otto AM, Hintermair J, Janzon C. NADH-Linked Metabolic Plasticity of MCF-7 Breast Cancer Cells Surviving in a Nutrient-Deprived Microenvironment. J Cell Biochem (2015) 116:822–35. doi: 10.1002/jcb.25038
16. Takahashi K, Sumimoto H, Suzuki K, Ono T. Protein-synthesis dependent cytoplasmic translocation of p53 protein after serum stimulation of growth-arrested MCF-7 cells. Mol Carcinogenesis (1993) 8(1):58–66. doi: 10.1002/mc.2940080112
17. Dubik D, Dembinski TC, Shiu RP. Stimulation of c-myc oncogene expression associated with estrogen-induced proliferation of human breast cancer cells. Cancer Res (1987) 47(24 Pt 1):6517–21.
18. Yang C, Richardson AD, Osterman A, Smith JW. Profiling of central metabolism in human cancer cells by two-dimensional NMR, GC-MS analysis, and isotopomer modeling. Metabolomics (2008) 4(1):13–29. doi: 10.1007/s11306-007-0094-y
19. Le A, Lane AN, Hamaker M, Bose S, Gouw A, Barbi J, et al. Glucose-Independent Glutamine Metabolism via TCA Cycling for Proliferation and Survival in B Cells. Cell Metab (2012) 15(1):110–21. doi: 10.1016/j.cmet.2011.12.009
20. Buescher JM, Antoniewicz MR, Boros LG, Burgess SC, Brunengraber H, Clish CB, et al. A roadmap for interpreting 13C metabolite labeling patterns from cells. Curr Opin Biotechnol (2015) 34:189–201. doi: 10.1016/j.copbio.2015.02.003
21. Dong W, Keibler MA, Stephanopoulos G. Review of metabolic pathways activated in cancer cells as determined through isotopic labeling and network analysis. Metab Eng (2017) 43(Pt B):113–24. doi: 10.1016/j.ymben.2017.02.002
22. Marín-Hernández A, López-Ramírez SY, Del Mazo-Monsalvo I, Gallardo-Pérez JC, Rodríguez-Enríquez S, Moreno-Sánchez R, et al. Modeling cancer glycolysis under hypoglycemia, and the role played by the differential expression of glycolytic isoforms. FEBS J (2014) 281(15):3325–45. doi: 10.1111/febs.12864
23. Zamora-Leon SP, Golde DW, Concha II, Rivas CI, DelgadoLopez F, Baselga J, et al. Expression of the fructose transporter GLUT5 in human breast cancer. Proc Natl Acad Sci U States America (1996) 93(5):1847–52. doi: 10.1073/pnas.93.5.1847
24. Tanner LB, Goglia AG, Wei MH, Sehgal T, Parsons LR, Park JO, et al. Four Key Steps Control Glycolytic Flux in Mammalian Cells. Cell Syst (2018) 7(1):49–62.e8. doi: 10.1016/j.cels.2018.06.003
25. Ganapathy V, Thangaraju M, Gopal E, Martin PM, Itagaki S, Miyauchi S, et al. Sodium-coupled monocarboxylate transporters in normal tissues and in cancer. AAPS J (2008) 10(1):193–9. doi: 10.1208/s12248-008-9022-y
26. Contreras-Baeza Y, Sandoval P, Alarcón R, Galaz A, Cortés-Molina F, Alegría K, et al. Monocarboxylate transporter 4 (MCT4) is a high affinity transporter capable of exporting lactate in high-lactate microenvironments. J Biol Chem (2019) 294:20135–47. doi: 10.1074/jbc.RA119.009093
27. Gkiouli M, Biechl P, Eisenreich W, Otto AM. Diverse Roads Taken by 13C-Glucose-Derived Metabolites in Breast Cancer Cells Exposed to Limiting Glucose and Glutamine Conditions. Cells (2019) 8(10):1113. doi: 10.3390/cells8101113
28. Dang CV. Rethinking the Warburg Effect with Myc Micromanaging Glutamine Metabolism. Cancer Res (2010) 70(3):859–62. doi: 10.1158/0008-5472.CAN-09-3556
29. Chaneton B, Hillmann P, Zheng L, Martin ACL, Maddocks ODK, Chokkathukalam A, et al. Serine is a natural ligand and allosteric activator of pyruvate kinase M2. Nature (2012) 491(7424):458–62. doi: 10.1038/nature11540
30. UtsunomiyaTate N, Endou H, Kanai Y. Cloning and functional characterization of a system ASC-like Na+-dependent neutral amino acid transporter. J Biol Chem (1996) 271(25):14883–90. doi: 10.1074/jbc.271.25.14883
31. Possemato R, Marks KM, Shaul YD, Pacold ME, Kim D, Birsoy K, et al. Functional genomics reveal that the serine synthesis pathway is essential in breast cancer. Nature (2011) 476:346. doi: 10.1038/nature10350
32. Newman AC, Maddocks ODK. Serine and Functional Metabolites in Cancer. Trends Cell Biol (2017) 27(9):645–57. doi: 10.1016/j.tcb.2017.05.001
33. Mazurek S, Grimm H, Boschek CB, Vaupel P, Eigenbrodt E. Pyruvate kinase type M2: a crossroad in the tumor metabolome. Br J Nutr (2002) 87:S23–S9. doi: 10.1079/BJN2001454
34. Jimenez de Asua L, Rozengurt E, Devalle JJ, Carminatti H. Some kinetic differences between the M isoenzymes of pyruvate kinase from liver and muscle. Biochim Biophys Acta (1971) 235(2):326–34. doi: 10.1016/0005-2744(71)90211-7
35. Zhang MM, Pan YD, Tang DH, Dorfman RG, Xu L, Zhou Q, et al. Low levels of pyruvate induced by a positive feedback loop protects cholangiocarcinoma cells from apoptosis. Cell Communication Signaling (2019) 17:23. doi: 10.1186/s12964-019-0332-8
36. Vacanti Nathaniel M, Divakaruni Ajit S, Green Courtney R, Parker Seth J, Henry Robert R, Ciaraldi Theodore P, et al. Regulation of Substrate Utilization by the Mitochondrial Pyruvate Carrier. Mol Cell (2014) 56(3):425–35. doi: 10.1016/j.molcel.2014.09.024
37. Glinghammar B, Rafter I, Lindstrom AK, Hedberg JJ, Andersson HB, Lindblom P, et al. Detection of the mitochondrial and catalytically active alanine aminotransferase in human tissues and plasma. Intl J Mol Med (2009) 23(5):621–31. doi: 10.3892/ijmm_00000173
38. Halestrap AP. The mitochondrial pyruvate carrier. Kinetics and specificity for substrates and inhibitors. Biochem J (1975) 148(1):85–96. doi: 10.1042/bj1480085
39. Lazo PA, Sols A. Pyruvate dehydrogenase complex of ascites tumour. Activation by AMP and other properties of potential significance in metabolic regulation. Biochem J (1980) 190(3):705–10. doi: 10.1042/bj1900705
40. Phannasil P, Ansari I-u, El Azzouny M, Longacre MJ, Rattanapornsompong K, Burant CF, et al. Mass spectrometry analysis shows the biosynthetic pathways supported by pyruvate carboxylase in highly invasive breast cancer cells. Biochim Biophys Acta (BBA) - Mol Basis Dis (2017) 1863(2):537–51. doi: 10.1016/j.bbadis.2016.11.021
41. Groen AK, Sips HJ, Vervoorn RC, Tager JM. Intracellular Compartmentation and Control of Alanine Metabolism in Rat Liver Parenchymal Cells. Eur J Biochem (1982) 122(1):87–93. doi: 10.1111/j.1432-1033.1982.tb05851.x
42. Zwingmann C, Richter-Landsberg C, Leibfritz D. 13C isotopomer analysis of glucose and alanine metabolism reveals cytosolic pyruvate compartmentation as part of energy metabolism in astrocytes. Glia (2001) 34(3):200–12. doi: 10.1002/glia.1054
43. Leithner K, Hrzenjak A, Trotzmuller M, Moustafa T, Kofeler HC, Wohlkoenig C, et al. PCK2 activation mediates an adaptive response to glucose depletion in lung cancer. ONCOGENE (2015) 34(8):1050–44. doi: 10.1038/onc.2014.47
44. Méndez-Lucas A, Hyroššová P, Novellasdemunt L, Viñals F, Perales JC. Mitochondrial Phosphoenolpyruvate Carboxykinase (PEPCK-M) Is a Pro-survival, Endoplasmic Reticulum (ER) Stress Response Gene Involved in Tumor Cell Adaptation to Nutrient Availability. J Biol Chem (2014) 289(32):22090–102. doi: 10.1074/jbc.M114.566927
45. Montal Emily D, Dewi R, Bhalla K, Ou L, Hwang Bor J, Ropell Ashley E, et al. PEPCK Coordinates the Regulation of Central Carbon Metabolism to Promote Cancer Cell Growth. Mol Cell (2015) 60:571–83. doi: 10.1016/j.molcel.2015.09.025
46. Vincent EE, Sergushichev A, Griss T, Gingras MC, Samborska B, Ntimbane T, et al. Mitochondrial Phosphoenolpyruvate Carboxykinase Regulates Metabolic Adaptation and Enables Glucose-Independent Tumor Growth. Mol Cell (2015) 60(2):195–207. doi: 10.1016/j.molcel.2015.08.013
Keywords: nutrient deprivation, 13C-glucose tracing, glycolysis, glutamine, TCA-cycle, anaplerosis, pyruvate replenishment, metabolic network
Citation: Otto AM (2020) Metabolic Constants and Plasticity of Cancer Cells in a Limiting Glucose and Glutamine Microenvironment—A Pyruvate Perspective. Front. Oncol. 10:596197. doi: 10.3389/fonc.2020.596197
Received: 18 August 2020; Accepted: 21 October 2020;
Published: 08 December 2020.
Edited by:
Fatima Baltazar, University of Minho, PortugalReviewed by:
Khalid Omer Alfarouk, Alfarouk Biomedical Research LLC, United StatesAngela Ostuni, University of Basilicata, Italy
Copyright © 2020 Otto. This is an open-access article distributed under the terms of the Creative Commons Attribution License (CC BY). The use, distribution or reproduction in other forums is permitted, provided the original author(s) and the copyright owner(s) are credited and that the original publication in this journal is cited, in accordance with accepted academic practice. No use, distribution or reproduction is permitted which does not comply with these terms.
*Correspondence: Angela M. Otto, otto@tum.de