 Lei Wang1†
 Hongbing Zhang2†
 Chaohu Pan3,4,5,6†
 Jian Yi3†
 Xiaoli Cui3
 Na Li3
 Jiaqian Wang3Zhibo Gao3
 Dongfang Wu3*
 Jun Chen2*
 Jizong Jiang1*
 Qian Chu1
- 1Department of Oncology, Tongji Hospital, Tongji Medical College, Huazhong University of Science and Technology, Wuhan, China
- 2Department of Lung Cancer Surgery, Tianjin Lung Cancer Institute, Tianjin Medical University General Hospital, Tianjin, China
- 3Department of Medicine, YuceBio Technology Co., Ltd, Shenzhen, China
- 4The First Affiliated Hospital, Jinan University, Guangzhou, China
- 5Zhuhai Institute of Translational Medicine, Zhuhai People’s Hospital (Zhuhai Hospital Affiliated with Jinan University), Jinan University, Zhuhai, China
- 6The Biomedical Translational Research Institute, Faculty of Medical Science, Jinan University, Guangzhou, China
Due to the complex mechanisms affecting anti-tumor immune response, a single biomarker is insufficient to identify patients who will benefit from immune checkpoint inhibitors (ICIs) treatment. Therefore, a comprehensive predictive model is urgently required to predict the response to ICIs. A total of 162 non-small-cell lung cancer (NSCLC) patients undergoing ICIs treatment from three independent cohorts were enrolled and used as training and test cohorts (training cohort = 69, test cohort1 = 72, test cohort2 = 21). Eight genomic markers were extracted or calculated for each patient. Ten machine learning classifiers, such as the gaussian process classifier, random forest, and support vector machine (SVM), were evaluated. Three genomic biomarkers, namely tumor mutation burden, intratumoral heterogeneity, and loss of heterozygosity in human leukocyte antigen were screened out, and the SVM_poly method was adopted to construct a durable clinical benefit (DCB) prediction model. Compared with a single biomarker, the DCB multi-feature model exhibits better predictive value with the area under the curve values equal to 0.77 and 0.78 for test cohort1 and cohort2, respectively. The patients predicted to have DCB showed improved median progression-free survival (mPFS) and median overall survival (mOS) than those predicted to have non-durable clinical benefit.
1 Introduction
Lung cancer is one of the most commonly diagnosed malignant tumors, the majority of which are non-small-cell lung cancers (NSCLCs) (1). Among all cancer types, the incidence and mortality of lung cancer are ranked second and first, respectively (2). Immune checkpoint inhibitors (ICIs), including anti-cytotoxic T lymphocyte-associated antigen-4 (CTLA4) and anti-programmed cell death protein 1 (PD-1)/programmed death-ligand 1 (PD-L1), have dramatically altered the treatment landscape of NSCLC (3–8). However, only a small subset of patients benefit from ICIs treatment, and some may even suffer from immune-related adverse events, requiring treatment discontinuation (9–12). Therefore, identification of more effective predictive biomarkers that can guide the treatment decision making with ICIs is significantly important and urgent.
Multiple clinical trials have verified that both PD-L1 expression level and tumor mutation burden (TMB) can predict the efficacy of ICIs in NSCLC (13–18). Recently, several novel genome-related biomarkers such as intratumoral heterogeneity (ITH), tumor neoantigen burden (TNB), loss of heterozygosity in human leukocyte antigen (HLA LOH), and HLA-I evolutionary divergence (HED), have been demonstrated to be associated with response to ICIs in patients (19–23). These single indicators can distinguish responders from non-responders to a certain extent, although their sensitivity and accuracy need to be further improved. For instance, some NSCLC patients with high TMB cannot benefit from immunotherapy (24).
Our objective was to construct a robust predictive model to predict durable response to ICIs in NSCLC patients based on multiple genomic features, and to assess its potential for clinical decision-making guidance in cancer treatment with ICIs.
2 Materials and Methods
2.1 Study Cohorts
Genomic and clinical data of 69 and 72 NSCLC patients undergoing ICIs treatments were obtained from published cohorts, of which 69 NSCLC patients were used as the training cohort and 72 NSCLC patients were used as the test cohort1 (19, 25).
To further evaluate the accuracy and effectiveness of the multi-feature model, 21 patients treated with ICIs, collected from January 2018 to May 2020, were enrolled in this study and used as test cohort2.
Durable clinical benefit (DCB) was defined as complete response (CR), partial response (PR), or stable disease (SD) that lasted for ≥ 24 weeks, and non-durable benefit (NDB) was defined as progressive disease (PD) or SD that lasted for < 24 weeks.
Among the 162 NSCLC patients included in this study, 69% (111/162) were lung adenocarcinoma. The number of patients with DCB and NDB was 61 and 101, respectively. Detailed clinical information of patients is summarized in Supplementary Tables 1–3.
In addition, genomic and clinical data of 120 melanoma patients undergoing ICIs treatments were obtained from published cohort to further evaluate the accuracy and effectiveness of the multi-feature model (26). The patients with CR or PR were 55, and the patients with PD were 65. DCB was defined as CR and PR, and NDB was defined as PD. Detailed clinical information of patients is summarized in Supplementary Table 4.
2.2 Next-Generation Sequencing (NGS) and Mutation Analysis
Genomic profiling was performed on tumor tissues and matched peripheral blood samples. First, we used the GeneReadDNA FFPE kit (Qiagen) and Qiagen DNA blood mini kit (Qiagen) to extract DNA from tumor specimens and blood, respectively. Then, the extracted DNA was amplified, purified, and analyzed using an NGS panel (YuceOne™ Plus, Yucebio, China).
Sequencing reads with > 10% N rate and/or > 10% bases with a quality score < 20 were filtered using SOAPnuke (Version 1.5.6) (27). Somatic single nucleotide variants and insertions and deletions (indels) were detected using VarScan (Version 2.4) (28). Next, an in-house method was applied to filter possible false-positive mutations. Finally, SnpEff (Version 4.3) was used to functionally annotate the mutations detected in the tumor samples (29).
2.3 Evaluation of Genomic Biomarkers
2.3.1 Evaluation of Tumor Mutation Burden
TMB was determined as the number of all nonsynonymous mutations and indels per megabase of the genome examined, and the cut-off value for TMB-high and TMB-low was defined as the median TMB.
2.3.2 Evaluation of HLA Typing, HED, and Somatic HLA Loss
HLA typing of the paired peripheral blood and tumor samples was performed from whole-exome sequencing data using POLYSOLVER (v1.0) (30) and OptyType (v1.3.2) (31). A scoring algorithm was then used to integrate the results that were used for further analysis (32). HED was calculated as previously described (33). The mean HED of patients was calculated as the mean of divergences at HLA_A, HLA_B, and HLA_C, and the bioinformatic tool LOHHLA with the default program settings was used to determine their maintenance or loss in the tumor (21).
2.3.3 Evaluation of TNB
All nonsynonymous mutations and indels were translated into 21-mer peptide sequences using in-house software centered on the mutated amino acid. Then, the 21-mer peptide was used to create a 9- to 11-mer peptide via a sliding window approach for the prediction of MHC class I binding affinity. Next, NetMHCpan (v3.0) was used to predict the binding strength of the mutated peptides to patient-specific HLA alleles (34). A peptide with predicted binding affinity to any HLA allele with an IC50 < 500 nM was selected. If several selected peptides were generated from the same mutation, they were counted as one neoantigen. TNB was determined as the number of putative neoantigens per megabase of the genome.
2.3.4 Calculation of Copy Number Variants (CNV) and ITH
CNVs were called using CNVkit (v0.8.1) to compare the exome-wide profile between tumors and matched peripheral blood (35). Allele-specific copy number and tumor purity were assessed using the ascatNgs (v3.1.0). PyClone (v0.13.0) was used to infer the cancer cell fraction (CCF) of mutations in tumors. ITH was calculated using a previously developed method (19).
2.4 Construction of the Multi-Feature Model
Ten classifiers, including K-Nearest Neighbors (KNN), Logistic Regression (LR), Random Forest (RF), Gradient Boosting Classifier (GBC), Decision Tree Classifier (DTC), Extra Tree Classifier (ETC), Gaussian Process Classifier (GPC), support vector machine (SVM)_poly, SVM_rbf, and SVM_liner, were evaluated to construct a multi-feature model with three genomic biomarkers to predict the efficacy of ICIs in the training cohort. The GridSearchCV and cross_val_score packages in Sklearn (version 0.24.1.) were used to iteratively optimize the RF, GBC, and DTC algorithms. The default parameters were adopted for the other algorithms. The predicted efficacy of these algorithms was calculated using the area under the receiver operating characteristic (ROC) curve. In addition, we evaluated the accuracy, specificity, sensitivity, positive predictive value, and negative predictive value of these algorithms in the training cohort.
2.5 Statistical Methods
An ROC curve was generated to evaluate diagnostic accuracy and the area under the curve was calculated to measure the discriminatory ability of potential biomarkers. Progression-free survival (PFS) was analyzed using the Kaplan–Meier method and log-rank test.
3 Results
3.1 Single Biomarker Has Limited Ability to Distinguish the Responders From the Non-Responders
To evaluate the predictive ability of a single biomarker for ICIs response, eight genomic biomarkers (TMB, TNB, ITH, HLA LOH, HED, HED_A, HED_B and HED_C) were analyzed, respectively. First, we winsorized and normalized the data in the training cohort (Supplementary Figure 1). The receiver operating characteristic (ROC) curves of the individual biomarkers were plotted and their predictive ability was measured using the area under the curve (AUC) value. As shown in Figures 1A–H, the accuracy and effectiveness of TMB, TNB, and ITH (AUC = 0.70, 0.67, and 0.68, respectively) were higher than those of HLA LOH, HED, HED_A, HED_B, and HED_C (AUC = 0.58, 0.51, 0.54, 0.51, and 0.49, respectively); however, none of these values exceeded 0.7, suggesting that a single biomarker was not effective enough to precisely distinguish responders from non-responders treated with ICIs.
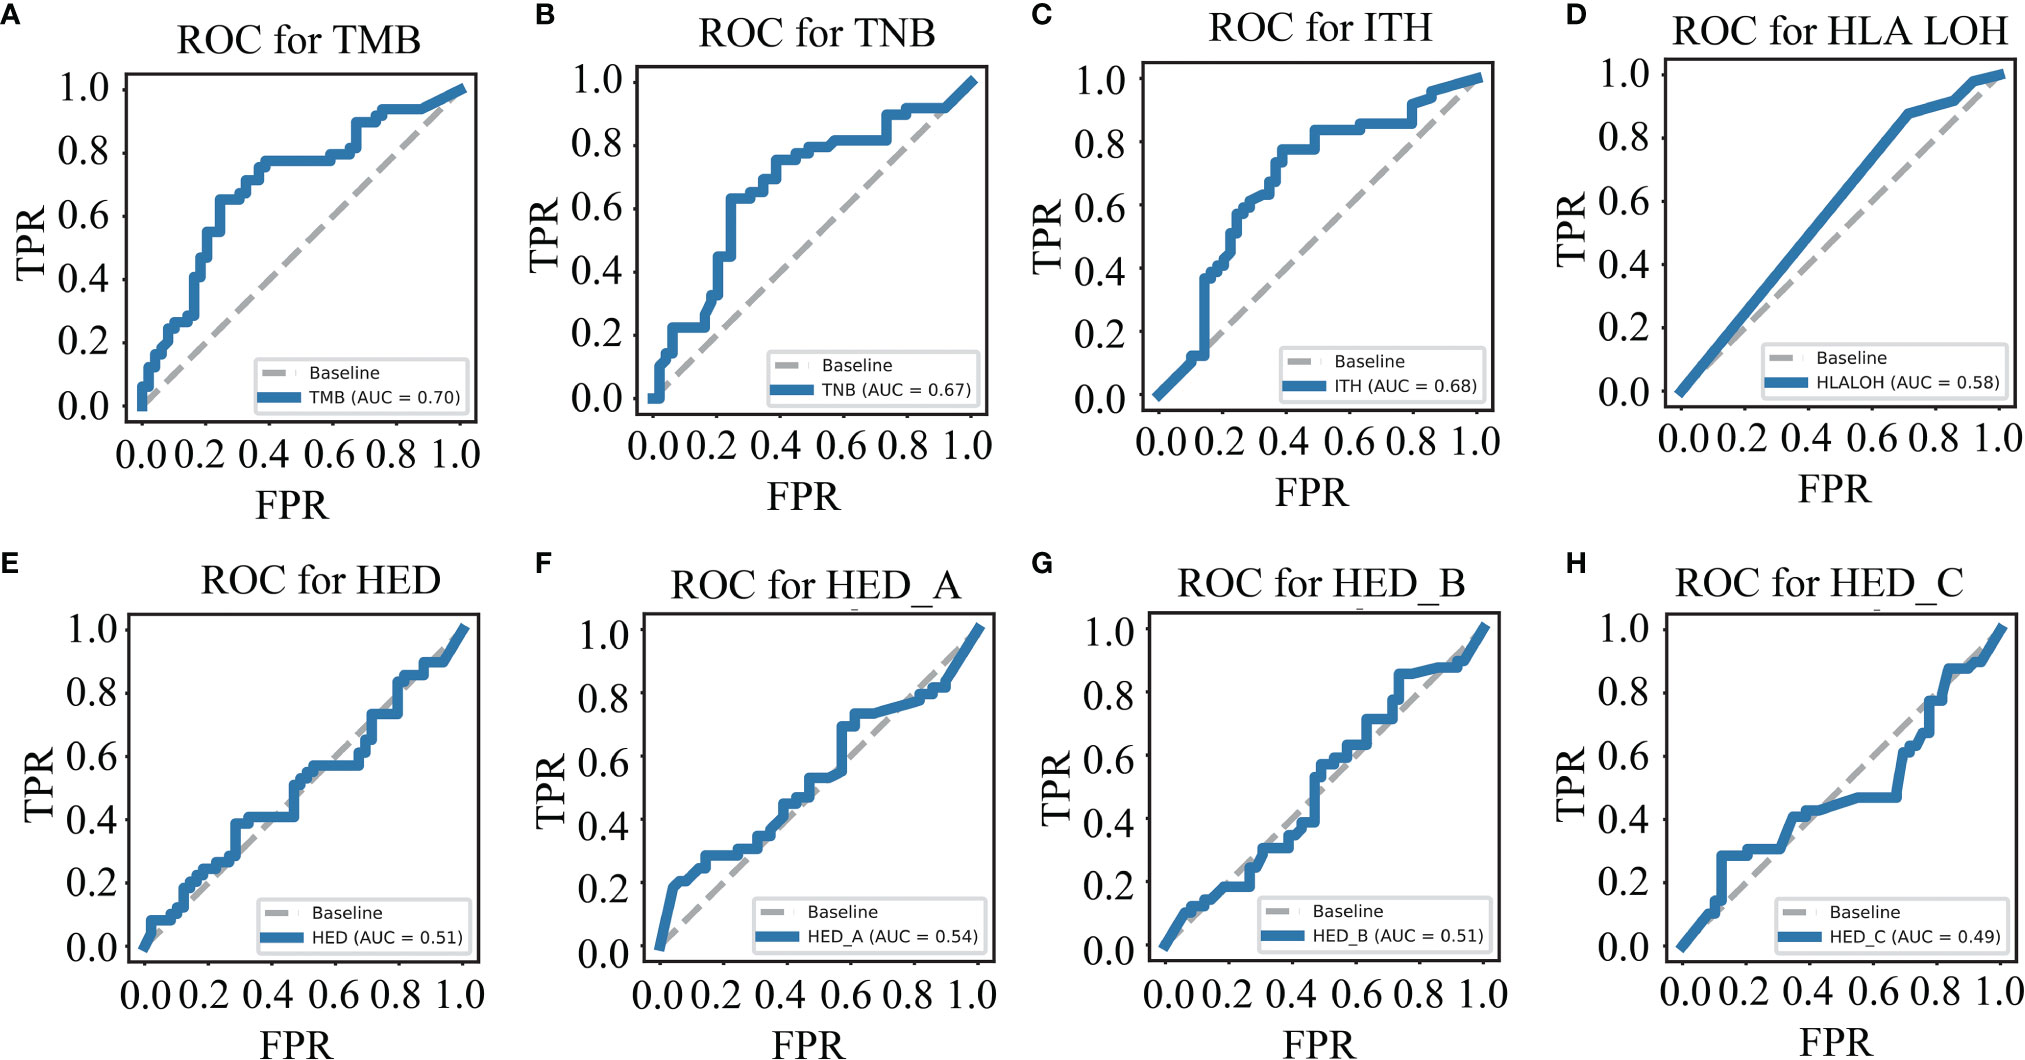
Figure 1 Single biomarker has limited ability to distinguish the responders from the non-responders. ROC curves for TMB (A), TNB (B), ITH (C), HLA LOH (D), HED (E), HED_A (F), HED_B (G), and HED_C (H) in the training cohort. TMB, tumor mutation burden; ITH, intratumoral heterogeneity; HLA LOH, loss of heterozygosity in human leukocyte antigen; HFD, HLA-I evolutionary divergence; ROC, receiver operating characteristic.
3.2 Feature Selection and Model Evaluation
Due to the limited predictive ability of a single biomarker, the predictive ability of the multi-feature model was further investigated and the detailed processes were shown in Figure 2A.
To avoid model overfitting, cross-validated recursive feature elimination was applied to select features from eight biomarkers (TMB, TNB, ITH, HLA LOH, HED, HED_A, HED_B, and HED_C). As shown in Figure 2B and Table 1, three of them, TMB, ITH, and HLA LOH, were screened to predict the efficacy of ICIs in the training cohort.
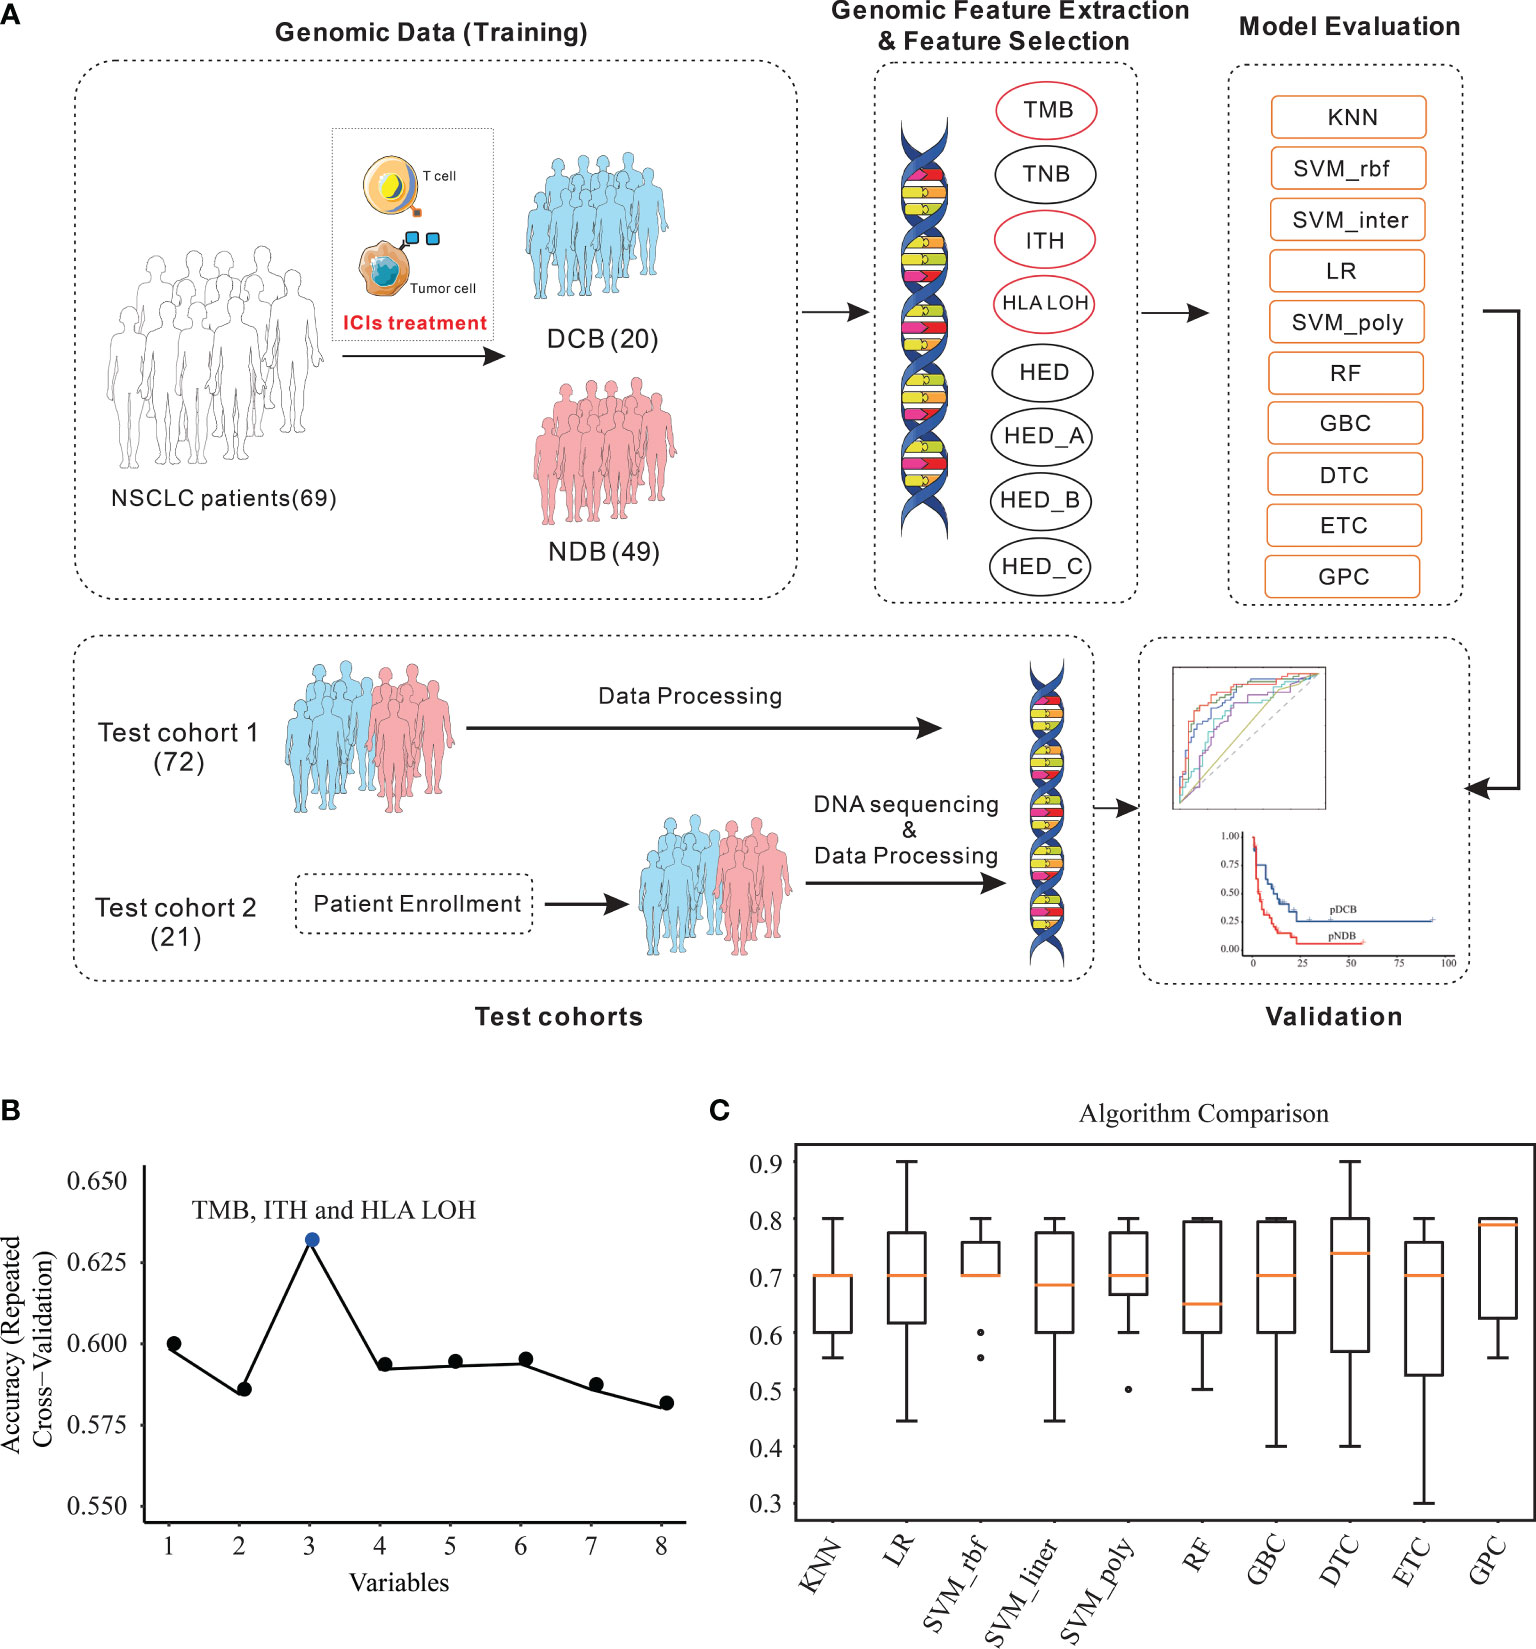
Figure 2 Feature combination selection and performance evaluation. (A) Workflow of the study. (B) Feature combination selection with 10-fold cross-validation. (C) Comparison of the efficacy of different algorithms in the training cohort with the selected features. KNN, K-nearest neighbors; LR, logistic regression; RF, random forest; GBC, gradient boosting classifier; DTC, decision tree classifier; ETC, extra tree classifier; GPC, Gaussian process classifier; SVM, support vector machine.

Table 1 List of the optimal combination from eight features.
Based on the three selected features, the efficacy of different algorithms (KNN, LR, SVM_rbf, SVM_ linear, SVM_poly, RF, GBC, DTC, ETC, and GPC) were evaluated and compared. The best-performing hyperparameters were determined by 10-fold cross-validation in the training cohort. As shown in Figure 2C and Table 2, the top four algorithms for accuracy were GPC, DTC, SVM_rbf, and SVM_poly, while the top four algorithms for variance were KNN, SVM_rbf, SVM_poly, and GPC. After comprehensive consideration of the accuracy and variance, the GPC, SVM_rbf, and SVM_poly algorithms were selected for further analysis.
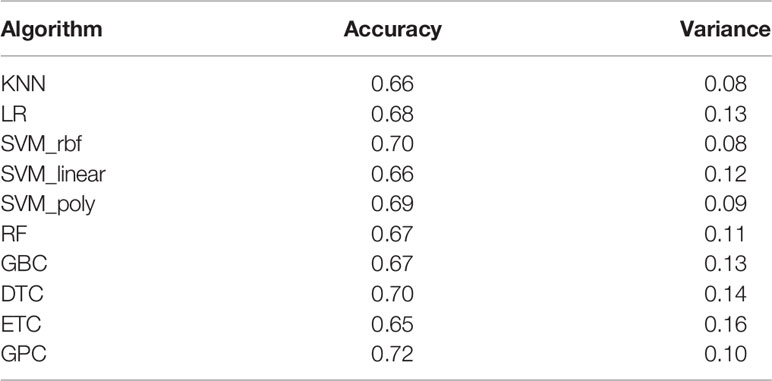
Table 2 List of the accuracy and variance of different algorithms with 10-fold cross-validation in the training cohort.
3.3 Algorithm Selection for Multi-Feature Model Construction
The algorithms of GPC, SVM_rbf, and SVM_poly were next assessed by their ability to predict the efficacy of patients with ICIs in the training cohort and test cohort1. As shown in Figures 3A, B, the AUC values of GPC, SVM_rbf, and SVM_poly algorithms were higher than those predicted by a single biomarker. Moreover, compared with the GPC and SVM_rbf algorithms, the SVM_poly algorithm was stabler in the training cohort and test cohort1, and thus was more suitable to be selected to construct the multi-feature model.
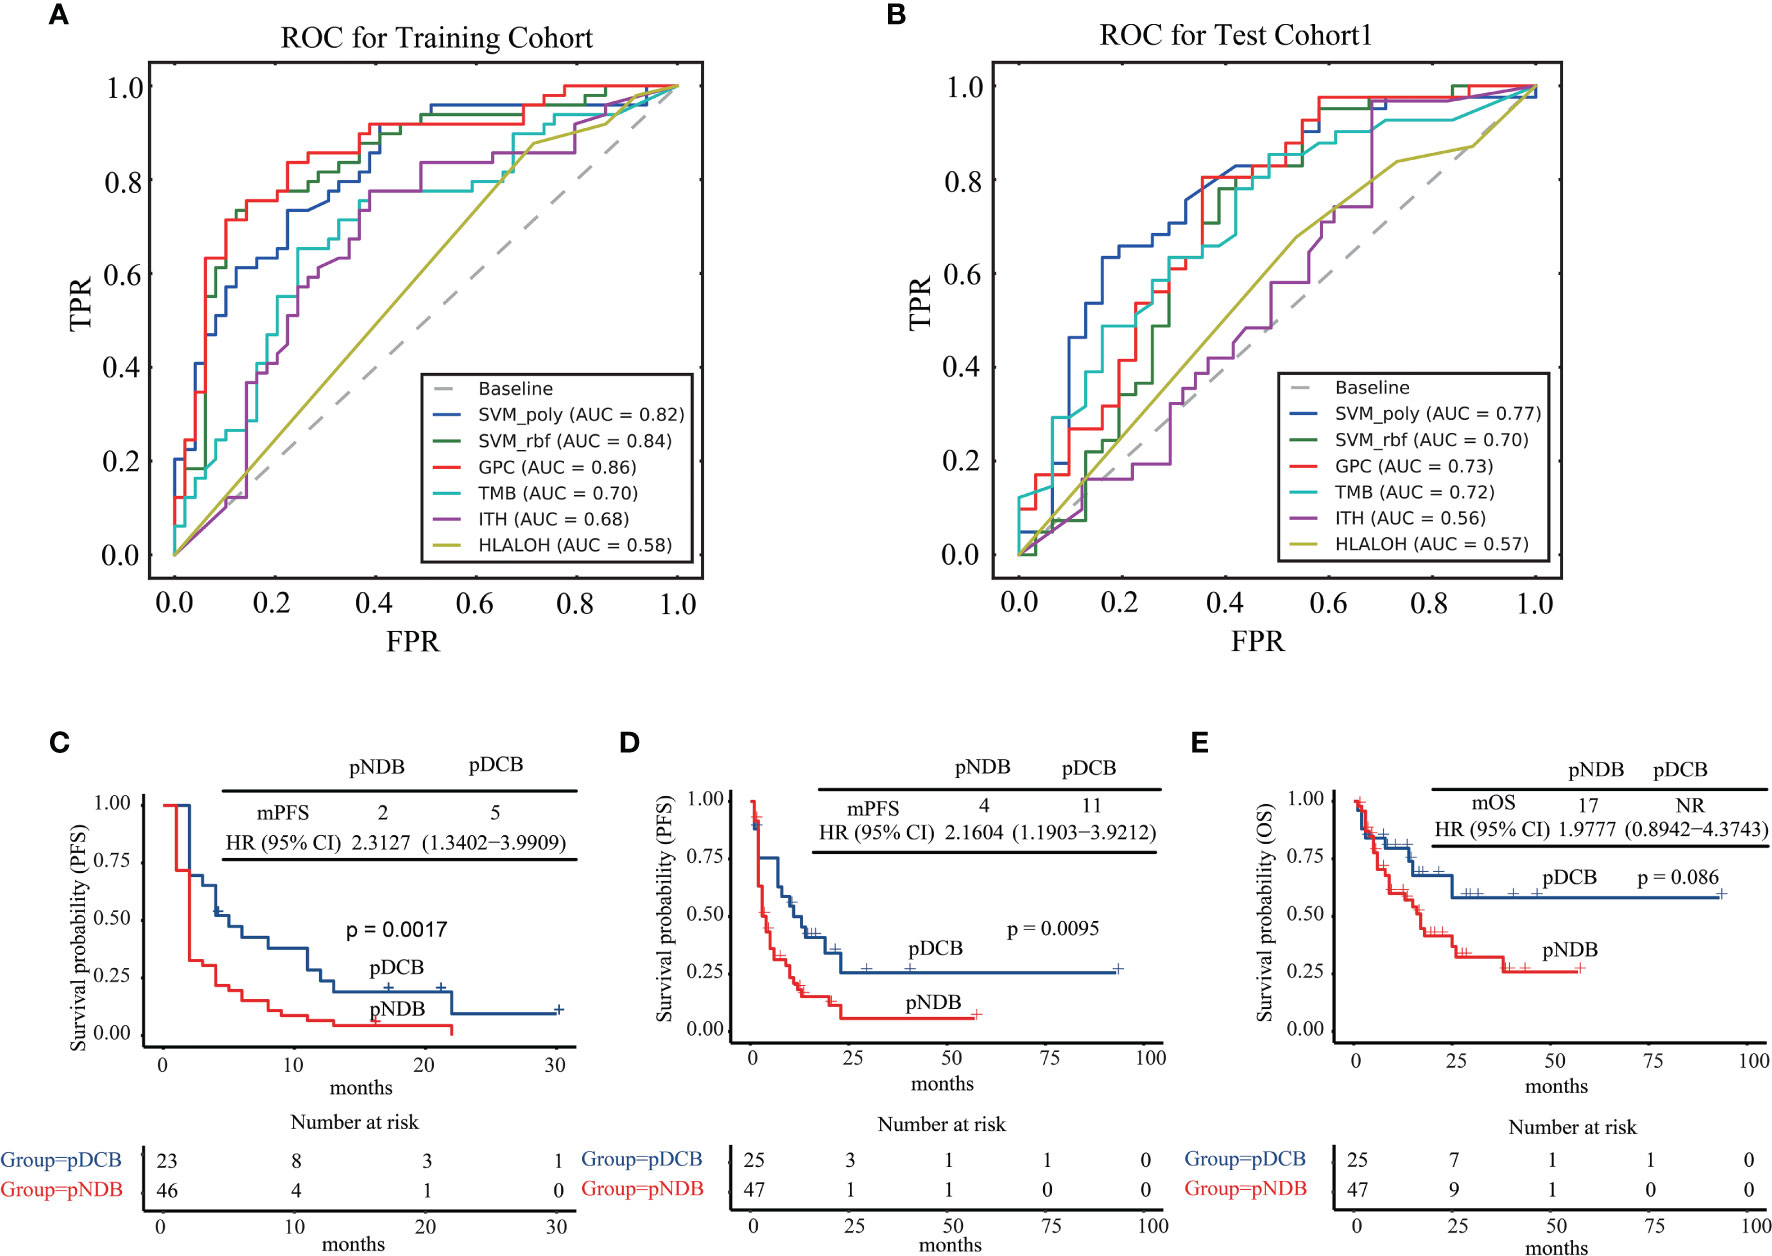
Figure 3 Algorithm selection for multi-feature model construction. (A) ROC curves for SVM_poly, SVM_rbf, GPC, TMB, ITH, and HLA LOH in the training cohort. (B) ROC curves for SVM_poly, SVM_rbf, GPC, TMB, ITH, and HLA LOH in test cohort1. (C) Kaplan–Meier curves of PFS comparing pDCB with pNDB in the training cohort. (D) Kaplan–Meier curves of PFS comparing pDCB with pNDB in test cohort1. (E) Kaplan–Meier curves of OS comparing pDCB with pNDB in test cohort1. pDCB, patients predicted to have durable clinical benefit; pNDB, patients predicted to have no durable benefit; PFS, progression-free survival; OS, overall survival.
Next, the median progression-free survival (mPFS) and median overall survival (mOS) in the training cohort and test cohort1 were analyzed with the multi-feature model. The results showed that patients who were predicted to have durable clinical benefit (pDCB) had longer mPFS and mOS than those predicted to have no durable benefit (pNDB) (Figures 3C–E).
3.4 Validation of the Multi-Feature Model in Patients Enrolled in Test Cohort2
Twenty-one NSCLC patients treated with ICIs enrolled in this study were used for further validation of the multi-feature model. Consistent with the above results, the AUC value predicted by the multi-feature model was higher than those predicted by single biomarker (Figure 4A). Furthermore, the mPFS of the pDCB subgroup was significantly longer than that of the pNDB subgroup (Figure 4B). In conclusion, the multi-feature model is able to distinguish pDCB from pNDB.
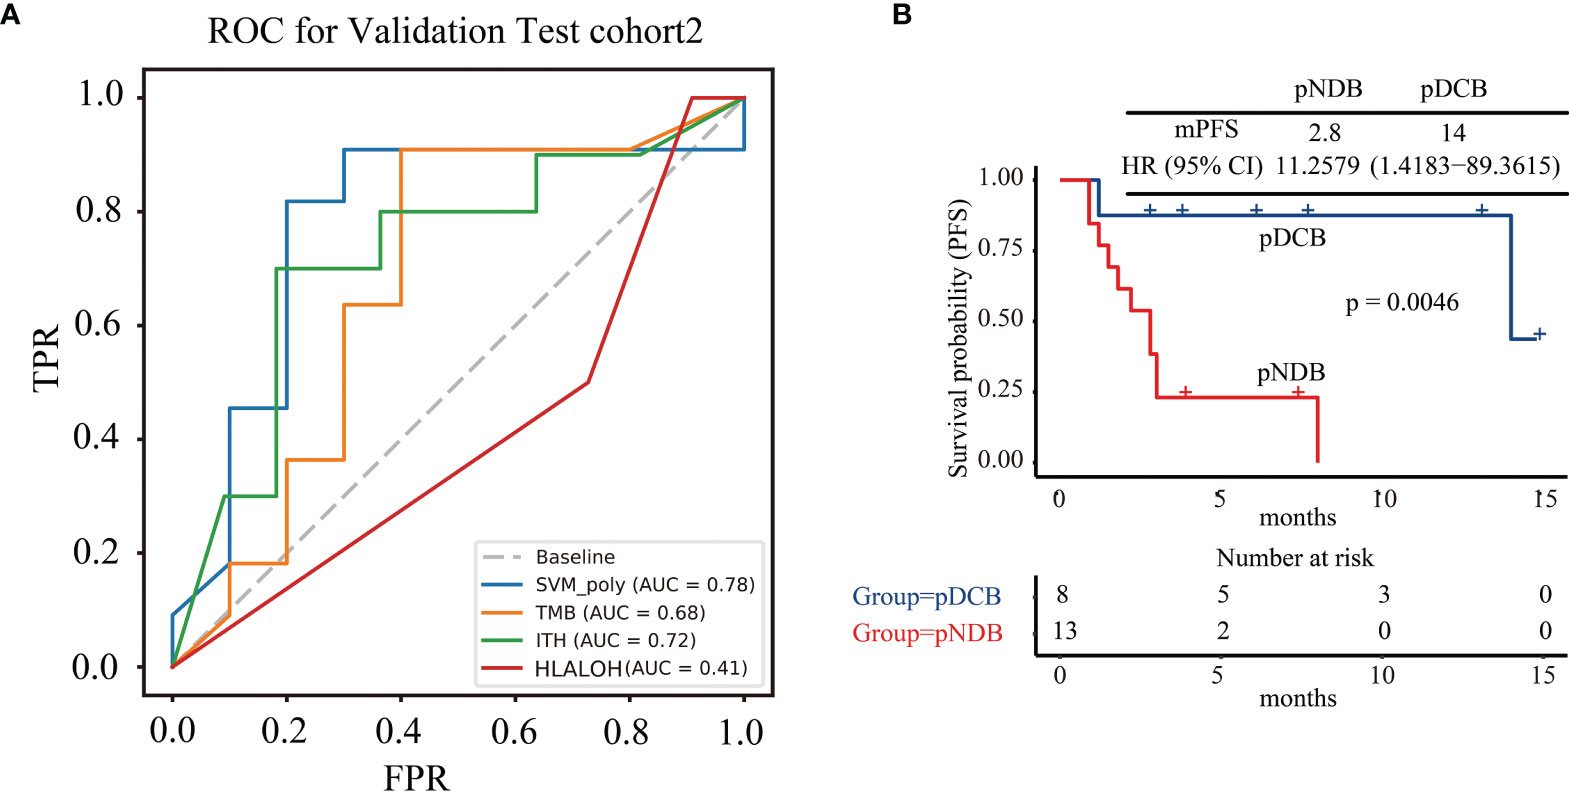
Figure 4 The multi-feature model could effectively predict response to ICIs treatment in test cohort2. (A) ROC curves for multi-feature model, TMB, ITH, and HLA LOH in test cohort2. (B) Kaplan–Meier curves of PFS comparing pDCB with pNDB in test cohort2.
4 Discussion
ICIs have achieved great success in the treatment of NSCLC, and several biomarkers have been developed to help clinicians make treatment choices; however, the predictive accuracy of these biomarkers is finite (24, 36). In this study, a comprehensive analysis of NSCLC samples was carried out to investigate the role of a multi-feature model composed of TMB, ITH, and HLA LOH in determining the response to ICIs. Our study showed that the accuracy of this multi-feature model was higher than that of any single biomarker, and the mPFS and mOS of pDCB patients were longer than those of pNDB patients predicted by the multi-feature model. Finally, whole-exome sequencing data from 21 NSCLC patients treated with ICIs were applied to further validate the model, and the same results were obtained.
Several studies have integrated multiple indicators to predict the efficacy of ICIs in NSCLC patients. Shi et al. integrated genomic profiling, TMB, and the expression level of PD-L1 to predict the efficacy of ICIs and reported that KMT2C/KRAS/TP53 co-mutation could serve as a biomarker to identify the best responders to ICIs therapy; however, the percentage of durable clinical benefit was only about 50% (37). Lin et al. also constructed a comprehensive predictive classifier model based on epidermal growth factor receptor and AT‐rich interaction domain 1B status, smoking history, treatment type, and PD-L1 score and found that patients with low-risk scores showed improved PFS compared to those with high-risk scores, while the AUC value of 6-month PFS was only 0.75 (38). In addition, these prediction models required multiple detection techniques, such as targeted panel sequencing and IHC of PD-L1, which need more tumor samples and costs. Therefore, in terms of the availability of clinical samples and the costs of treatment, we hoped that multiple features could be obtained through one detection technology. Targeted panel sequencing has been demonstrated in clinical application. As the costs of sequencing decreased, the clinical application of targeted panel sequencing gradually increased. More importantly, from targeted panel sequencing, multiple genomic features could be analyzed. Therefore, the multi-feature model based on genomic markers was developed. In our study, the AUC values of the multi-feature model in the training cohort, test cohort1 and test cohort2 were 0. 82, 0.77, and 0.78, respectively, which proved that our model is more effective in predicting the efficacy of NSCLC patients treated with ICIs. In order to further expand the application of this model, the predictive ability of this model in melanoma was also analyzed. As shown in Figure S2, the AUC value was 0.6, which indicated that the model may be unsuitable for melanoma.
In summary, we have constructed a multi-feature model that can effectively predict the efficacy of NSCLC patients treated with ICIs, which can help in clinical decision-making. In addition, patients with pDCB could be considered as more suitable candidates for treatment with ICIs. Ongoing intense work, especially prospective large cohorts, is needed to further validate and optimize our model.
Data Availability Statement
The datasets presented in this study can be found in online repositories, via the following link: https://ngdc.cncb.ac.cn/gsa-human/browse/HRA001966.
Ethics Statement
The studies involving human participants were reviewed and approved by YuceBio Ethics Committee for research in health. The patients/participants provided their written informed consent to participate in this study.
Author Contributions
Conceptualization, DW, JC, JJ, QC and ZG. Methodology, LW, HZ, CP, JY and JW. Data analysis, LW, HZ, CP, JY and XC. Wrote the manuscript, LW, HZ, CP, JY and XC. Revised the manuscript, LW, HZ, CP and NL. All authors contributed to the article and approved the submitted version.
Funding
This study was supported by Natural Science Foundation of China (NO. 62131009 and 82072597).
Conflict of Interest
Author CP, JY, XC, NL, JW, ZG and DW were employed by the company YuceBio Technology Co., Ltd.
The remaining authors declare that the research was conducted in the absence of any commercial or financial relationships that could be construed as a potential conflict of interest.
Publisher’s Note
All claims expressed in this article are solely those of the authors and do not necessarily represent those of their affiliated organizations, or those of the publisher, the editors and the reviewers. Any product that may be evaluated in this article, or claim that may be made by its manufacturer, is not guaranteed or endorsed by the publisher.
Supplementary Material
The Supplementary Material for this article can be found online at: https://www.frontiersin.org/articles/10.3389/fimmu.2022.829634/full#supplementary-material
Supplementary Figure 1 | Data winsorization and normalization in the training cohort. (A) Data of HED, HED_A, HED_B, HED_C, TMB, ITH and TNB before winsorization. (B) Data of HED, HED_A, HED_B, HED_C, TMB, ITH and TNB after winsorization. (C) Data of HED, HED_A, HED_B, HED_C, TMB, ITH and TNB after normalization.
Supplementary Figure 2 | ROC curves for multi-feature model, TMB, ITH, and HLA LOH in cohort of melanoma.
References
1. Bodor JN, Boumber Y, Borghaei H. Biomarkers for Immune Checkpoint Inhibition in Non-Small Cell Lung Cancer (NSCLC). Cancer (2020) 126(2):260–70. doi: 10.1002/cncr.32468
2. Bray F, Ferlay J, Soerjomataram I, Siegel RL, Torre LA, Jemal A. Global Cancer Statistics 2018: GLOBOCAN Estimates of Incidence and Mortality Worldwide for 36 Cancers in 185 Countries. CA Cancer J Clin (2018) 68(6):394–424. doi: 10.3322/caac.21492
3. Sacher AG, Gandhi L. Biomarkers for the Clinical Use of PD-1/PD-L1 Inhibitors in Non-Small-Cell Lung Cancer: A Review. JAMA Oncol (2016) 2(9):1217–22. doi: 10.1001/jamaoncol.2016.0639
4. Perets R, Bar J, Rasco DW, Ahn MJ, Yoh K, Kim DW, et al. Safety and Efficacy of Quavonlimab, a Novel Anti-CTLA-4 Antibody (MK-1308), in Combination With Pembrolizumab in First-Line Advanced Non-Small-Cell Lung Cancer. Ann Oncol (2021) 32(3):395–403. doi: 10.1016/j.annonc.2020.11.020
5. Brahmer J, Reckamp KL, Baas P, Crino L, Eberhardt WE, Poddubskaya E, et al. Nivolumab Versus Docetaxel in Advanced Squamous-Cell Non-Small-Cell Lung Cancer. N Engl J Med (2015) 373(2):123–35. doi: 10.1056/NEJMoa1504627
6. Rittmeyer A, Barlesi F, Waterkamp D, Park K, Ciardiello F, von Pawel J, et al. Atezolizumab Versus Docetaxel in Patients With Previously Treated Non-Small-Cell Lung Cancer (OAK): A Phase 3, Open-Label, Multicentre Randomised Controlled Trial. Lancet (2017) 389(10066):255–65. doi: 10.1016/S0140-6736(16)32517-X
7. Herbst RS, Baas P, Kim DW, Felip E, Perez-Gracia JL, Han JY, et al. Pembrolizumab Versus Docetaxel for Previously Treated, PD-L1-Positive, Advanced Non-Small-Cell Lung Cancer (KEYNOTE-010): A Randomised Controlled Trial. Lancet (2016) 387(10027):1540–50. doi: 10.1016/S0140-6736(15)01281-7
8. Hellmann MD, Paz-Ares L, Bernabe Caro R, Zurawski B, Kim SW, Carcereny Costa E, et al. Nivolumab Plus Ipilimumab in Advanced Non-Small-Cell Lung Cancer. N Engl J Med (2019) 381(21):2020–31. doi: 10.1056/NEJMoa1910231
9. Khoja L, Day D, Wei-Wu Chen T, Siu LL, Hansen AR. Tumour- and Class-Specific Patterns of Immune-Related Adverse Events of Immune Checkpoint Inhibitors: A Systematic Review. Ann Oncol (2017) 28(10):2377–85. doi: 10.1093/annonc/mdx286
10. Weber JS, Kahler KC, Hauschild A. Management of Immune-Related Adverse Events and Kinetics of Response With Ipilimumab. J Clin Oncol (2012) 30(21):2691–7. doi: 10.1200/JCO.2012.41.6750
11. Heinzerling L, Ott PA, Hodi FS, Husain AN, Tajmir-Riahi A, Tawbi H, et al. Cardiotoxicity Associated With CTLA4 and PD1 Blocking Immunotherapy. J Immunother Cancer (2016) 4:50. doi: 10.1186/s40425-016-0152-y
12. Topalian SL, Hodi FS, Brahmer JR, Gettinger SN, Smith DC, McDermott DF, et al. Safety, Activity, and Immune Correlates of Anti-PD-1 Antibody in Cancer. N Engl J Med (2012) 366(26):2443–54. doi: 10.1056/NEJMoa1200690
13. Giroux Leprieur E, Dumenil C, Julie C, Giraud V, Dumoulin J, Labrune S, et al. Immunotherapy Revolutionises Non-Small-Cell Lung Cancer Therapy: Results, Perspectives and New Challenges. Eur J Cancer (2017) 78:16–23. doi: 10.1016/j.ejca.2016.12.041
14. Tang J, Yu JX, Hubbard-Lucey VM, Neftelinov ST, Hodge JP, Lin Y. Trial Watch: The Clinical Trial Landscape for PD1/PDL1 Immune Checkpoint Inhibitors. Nat Rev Drug Discov (2018) 17(12):854–5. doi: 10.1038/nrd.2018.210
15. Samstein RM, Lee CH, Shoushtari AN, Hellmann MD, Shen R, Janjigian YY, et al. Tumor Mutational Load Predicts Survival After Immunotherapy Across Multiple Cancer Types. Nat Genet (2019) 51(2):202–6. doi: 10.1038/s41588-018-0312-8
16. Herbst RS, Giaccone G, de Marinis F, Reinmuth N, Vergnenegre A, Barrios CH, et al. Atezolizumab for First-Line Treatment of PD-L1-Selected Patients With NSCLC. N Engl J Med (2020) 383(14):1328–39. doi: 10.1056/NEJMoa1917346
17. Hellmann MD, Ciuleanu TE, Pluzanski A, Lee JS, Otterson GA, Audigier-Valette C, et al. Nivolumab Plus Ipilimumab in Lung Cancer With a High Tumor Mutational Burden. N Engl J Med (2018) 378(22):2093–104. doi: 10.1056/NEJMoa1801946
18. Montesion M, Murugesan K, Jin DX, Sharaf R, Sanchez N, Guria A, et al. Somatic HLA Class I Loss Is a Widespread Mechanism of Immune Evasion Which Refines the Use of Tumor Mutational Burden as a Biomarker of Checkpoint Inhibitor Response. Cancer Discov (2021) 11(2):282–92. doi: 10.1158/2159-8290.CD-20-0672
19. Fang W, Jin H, Zhou H, Hong S, Ma Y, Zhang Y, et al. Intratumoral Heterogeneity as a Predictive Biomarker in Anti-PD-(L)1 Therapies for Non-Small Cell Lung Cancer. Mol Cancer (2021) 20(1):37. doi: 10.1186/s12943-021-01331-9
20. Luksza M, Riaz N, Makarov V, Balachandran VP, Hellmann MD, Solovyov A, et al. A Neoantigen Fitness Model Predicts Tumour Response to Checkpoint Blockade Immunotherapy. Nature (2017) 551(7681):517–20. doi: 10.1038/nature24473
21. McGranahan N, Rosenthal R, Hiley CT, Rowan AJ, Watkins TBK, Wilson GA, et al. Allele-Specific HLA Loss and Immune Escape in Lung Cancer Evolution. Cell (2017) 171(6):1259–1.e1211. doi: 10.1016/j.cell.2017.10.001
22. Chowell D, Krishna C, Pierini F, Makarov V, Rizvi NA, Kuo F, et al. Evolutionary Divergence of HLA Class I Genotype Impacts Efficacy of Cancer Immunotherapy. Nat Med (2019) 25(11):1715–20. doi: 10.1038/s41591-019-0639-4
23. Wang Z, Zhao J, Wang G, Zhang F, Zhang Z, Zhang F, et al. Comutations in DNA Damage Response Pathways Serve as Potential Biomarkers for Immune Checkpoint Blockade. Cancer Res (2018) 78(22):6486–96. doi: 10.1158/0008-5472.CAN-18-1814
24. Hellmann MD, Nathanson T, Rizvi H, Creelan BC, Sanchez-Vega F, Ahuja A, et al. Genomic Features of Response to Combination Immunotherapy in Patients With Advanced Non-Small-Cell Lung Cancer. Cancer Cell (2018) 33(5):843–52.e844. doi: 10.1016/j.ccell.2018.03.018
25. Anagnostou V, Niknafs N, Marrone K, Bruhm DC, White JR, Naidoo J, et al. Multimodal Genomic Features Predict Outcome of Immune Checkpoint Blockade in Non-Small-Cell Lung Cancer. Nat Cancer (2020) 1(1):99–111. doi: 10.1038/s43018-019-0008-8
26. Liu D, Schilling B, Liu D, Sucker A, Livingstone E, Jerby-Arnon L, et al. Integrative Molecular and Clinical Modeling of Clinical Outcomes to PD1 Blockade in Patients With Metastatic Melanoma. Nat Med (2019) 25(12):1916–27. doi: 10.1038/s41591-019-0654-5
27. Chen Y, Chen Y, Shi C, Huang Z, Zhang Y, Li S, et al. SOAPnuke: A MapReduce Acceleration-Supported Software for Integrated Quality Control and Preprocessing of High-Throughput Sequencing Data. Gigascience (2018) 7(1):1–6. doi: 10.1093/gigascience/gix120
28. Koboldt DC, Zhang Q, Larson DE, Shen D, McLellan MD, Lin L, et al. VarScan 2: Somatic Mutation and Copy Number Alteration Discovery in Cancer by Exome Sequencing. Genome Res (2012) 22(3):568–76. doi: 10.1101/gr.129684.111
29. Cingolani P, Platts A, Wang le L, Coon M, Nguyen T, Wang L, et al. A Program for Annotating and Predicting the Effects of Single Nucleotide Polymorphisms, SnpEff: SNPs in the Genome of Drosophila Melanogaster Strain W1118; Iso-2; Iso-3. Fly (Austin) (2012) 6(2):80–92. doi: 10.4161/fly.19695
30. Shukla SA, Rooney MS, Rajasagi M, Tiao G, Dixon PM, Lawrence MS, et al. Comprehensive Analysis of Cancer-Associated Somatic Mutations in Class I HLA Genes. Nat Biotechnol (2015) 33(11):1152–8. doi: 10.1038/nbt.3344
31. Szolek A, Schubert B, Mohr C, Sturm M, Feldhahn M, Kohlbacher O. OptiType: Precision HLA Typing From Next-Generation Sequencing Data. Bioinformatics (2014) 30(23):3310–6. doi: 10.1093/bioinformatics/btu548
32. Yi J, Chen L, Xiao Y, Zhao Z, Su X. Investigations of Sequencing Data and Sample Type on HLA Class Ia Typing With Different Computational Tools. Brief Bioinform (2021) 22(3):bbaa143. doi: 10.1093/bib/bbaa143
33. Chowell D, Morris LGT, Grigg CM, Weber JK, Samstein RM, Makarov V, et al. Patient HLA Class I Genotype Influences Cancer Response to Checkpoint Blockade Immunotherapy. Science (2018) 359(6375):582–7. doi: 10.1126/science.aao4572
34. Nielsen M, Andreatta M. NetMHCpan-3.0; Improved Prediction of Binding to MHC Class I Molecules Integrating Information From Multiple Receptor and Peptide Length Datasets. Genome Med (2016) 8(1):33. doi: 10.1186/s13073-016-0288-x
35. Talevich E, Shain AH, Botton T, Bastian BC. CNVkit: Genome-Wide Copy Number Detection and Visualization From Targeted DNA Sequencing. PloS Comput Biol (2016) 12(4):e1004873. doi: 10.1371/journal.pcbi.1004873
36. Brueckl WM, Ficker JH, Zeitler G. Clinically Relevant Prognostic and Predictive Markers for Immune-Checkpoint-Inhibitor (ICI) Therapy in Non-Small Cell Lung Cancer (NSCLC). BMC Cancer (2020) 20(1):1185. doi: 10.1186/s12885-020-07690-8
37. Shi Y, Lei Y, Liu L, Zhang S, Wang W, Zhao J, et al. Integration of Comprehensive Genomic Profiling, Tumor Mutational Burden, and PD-L1 Expression to Identify Novel Biomarkers of Immunotherapy in Non-Small Cell Lung Cancer. Cancer Med (2021) 10(7):2216–31. doi: 10.1002/cam4.3649
Keywords: immune checkpoint inhibitors, durable responses, multi-feature model, genetic biomarkers, non-small cell lung cancer, cancer immunity and immunotherapy
Citation: Wang L, Zhang H, Pan C, Yi J, Cui X, Li N, Wang J, Gao Z, Wu D, Chen J, Jiang J and Chu Q (2022) Predicting Durable Responses to Immune Checkpoint Inhibitors in Non-Small-Cell Lung Cancer Using a Multi-Feature Model. Front. Immunol. 13:829634. doi: 10.3389/fimmu.2022.829634
Received: 06 December 2021; Accepted: 22 March 2022;
Published: 22 April 2022.
Edited by:
Udo S. Gaipl, University Hospital Erlangen, GermanyReviewed by:
Jun-Ling Li, Chinese Academy of Medical Sciences and Peking Union Medical College, ChinaVasyl Nagibin, National Academy of Sciences of Ukraine, Ukraine
Copyright © 2022 Wang, Zhang, Pan, Yi, Cui, Li, Wang, Gao, Wu, Chen, Jiang and Chu. This is an open-access article distributed under the terms of the Creative Commons Attribution License (CC BY). The use, distribution or reproduction in other forums is permitted, provided the original author(s) and the copyright owner(s) are credited and that the original publication in this journal is cited, in accordance with accepted academic practice. No use, distribution or reproduction is permitted which does not comply with these terms.
*Correspondence: Dongfang Wu, wudf@yucebio.com; Jun Chen, huntercj2004@qq.com; Jizong Jiang, solomon.hill.jiang@163.com
†These authors have contributed equally to this work