 Ying Luo1*
 Ying Xue2
 Guoxing Tang1Qun Lin1Huijuan Song1Wei Liu1Botao Yin1Jin Huang1Wei Wei1Liyan Mao1*
 Feng Wang1*
 Ziyong Sun1*
- 1Department of Laboratory Medicine, Tongji Hospital, Tongji Medical College, Huazhong University of Science and Technology, Wuhan, China
- 2Department of Immunology, School of Basic Medicine, Tongji Medical College, Huazhong University of Science and Technology, Wuhan, China
Background: Novel approaches for tuberculosis (TB) diagnosis, especially for distinguishing active TB (ATB) from latent TB infection (LTBI), are urgently warranted. The present study aims to determine whether the combination of HLA-DR on Mycobacterium tuberculosis (MTB)-specific cells and TB antigen/phytohemagglutinin (TBAg/PHA) ratio could facilitate MTB infection status discrimination.
Methods: Between June 2020 and June 2021, participants with ATB and LTBI were recruited from Tongji Hospital (Qiaokou cohort) and Sino-French New City Hospital (Caidian cohort), respectively. The detection of HLA-DR on MTB-specific cells upon TB antigen stimulation and T-SPOT assay were simultaneously performed on all subjects.
Results: A total of 116 (54 ATB and 62 LTBI) and another 84 (43 ATB and 41 LTBI) cases were respectively enrolled from Qiaokou cohort and Caidian cohort. Both HLA-DR on IFN-γ+TNF-α+ cells and TBAg/PHA ratio showed discriminatory value in distinguishing between ATB and LTBI. Receiver operator characteristic (ROC) curve analysis showed that HLA-DR on IFN-γ+TNF-α+ cells produced an area under the ROC curve (AUC) of 0.886. Besides, TBAg/PHA ratio yield an AUC of 0.736. Furthermore, the combination of these two indicators resulted in the accurate discrimination with an AUC of 0.937. When the threshold was set as 0.36, the diagnostic model could differentiate ATB from LTBI with a sensitivity of 92.00% and a specificity of 81.82%. The performance obtained in Qiaokou cohort was further validated in Caidian cohort.
Conclusions: The combination of HLA-DR on MTB-specific cells and TBAg/PHA ratio could serve as a robust tool to determine TB disease states.
Introduction
Tuberculosis (TB), caused by Mycobacterium tuberculosis (MTB) infection, remains an ongoing and leading global public issue with high morbidity and mortality (1). It was reported that the disease caused an estimated 10.0 million incident cases and approximately 1.4 million deaths worldwide in 2019 (2). Most subjects infected with MTB remain relatively healthy, a state called latent TB infection (LTBI) (3). However, approximately 5-10% of these individuals will eventually develop to active TB (ATB) during their life (4). Rapid approaches that can differentiate ATB from LTBI are essential for TB management and control, as well as the implement of the end TB strategy (5). Thus, developing effective and feasible methods become a current priority in combating the disease.
Currently, diagnosing ATB is mainly based on identifying the pathogen by staining for acid-fast bacilli, mycobacterial culture or PCR such as GeneXpert MTB/RIF. However, these methods are either insensitive or time-consuming, failing to meet clinical needs (6). Meanwhile, two kinds of commercial interferon gamma release assays, including QuantiFERON-TB Gold In-Tube test (QFT-GIT) and T-SPOT.TB (T-SPOT), were widely used for identifying MTB infection (7). Nevertheless, both T-SPOT and QFT-GIT are intrinsically unable to discriminate between ATB and LTBI well (8, 9). To address these limitations, emerging techniques, including transcriptomics (10, 11), proteomics (12, 13), and metabolomics (14, 15) have recently been introduced. However, these technique-derived tests lack sufficient validation and are difficult to carry out in clinical practice due to cumbersome operating procedures and requirements for special equipment (16). Therefore, despite much effort to identify new diagnostic methods for TB, we still lack affordable and efficient tools, especially based on existing platform, targeting this issue.
Surface markers on immune cells and intracellular cytokines detected by flow cytometry had been applied in TB diagnostic field in recent years (17, 18). Among these efforts, the activation phenotype represented by HLA-DR on MTB-specific cells appeared to be particularly outstanding in identifying ATB (19). However, in a more recent study, Mpande et al. denoted that HLA-DR on MTB-specific cells could not differentiate ATB patients from LTBI individuals with recent MTB infection (20). Thus, HLA-DR on MTB-specific cells would show relatively moderate specificity in distinguishing ATB from LTBI. Hence, there is a considerable need to seek a method with high specificity to combine with HLA-DR to compensate for its loss in specificity. Wang and his colleagues previously developed an indicator-TB antigen/phytohemagglutinin (TBAg/PHA) ratio, which showed relatively high specificity and moderate sensitivity in discriminating ATB patients from LTBI individuals (21, 22). We wonder whether the combination of these two indicators could further improve the differentiation. Therefore, the present study aims to investigate the potential value of the combination of HLA-DR on MTB-specific cells and TBAg/PHA ratio in distinguishing between ATB and LTBI.
Methods
Subjects
The current study was conducted between June 2020 and June 2021. Participants were recruited from Tongji Hospital (Qiaokou cohort, the largest tertiary hospital in central China with 5500 beds) and Sino-French New City Hospital (Caidian cohort, a branch hospital of Tongji Hospital with 1600 beds), respectively. Participants in two cohorts were enrolled based on positive T-SPOT results. Patients with suspected symptoms of ATB and eventually confirmed by microbiological evidences were included. The definition for ATB was positive culture for MTB and/or positive GeneXpert MTB/RIF, as well as supportive symptoms and radiological evidence for ATB. LTBI individuals included in the current study were recruited from the populations who underwent health screening at hospitals. LTBI individuals were defined by positive T-SPOT results with no clinical or radiographic evidence of ATB (3, 23–25). Subjects were excluded if they had received anti-TB chemotherapy or younger than 17 years old. All enrolled subjects were HIV-negative. In order to determine the change of various indicators during anti-TB treatment, three months of anti-TB treatment was performed on ATB patients with isoniazid, rifampicin, pyrazinamide, and ethambutol. Three consecutive negative GeneXpert MTB/RIF results and relief of the patient’s symptoms were considered signs of effective treatment. The study protocol was approved by the Ethics Committee of Tongji Hospital, Tongji Medical College, Huazhong University of Science and Technology. All participants provided written informed consent.
T-SPOT Assay
T-SPOT assay was performed using heparin-anticoagulated blood samples. The operation was conducted in accordance with manufacturer’s instruction (Oxford Immunotec, Oxford, UK). Briefly, peripheral blood mononuclear cells (PBMCs) were separated by Ficoll-Hypaque gradient centrifugation. Then, the isolated PBMCs (2.5 × 10⁵) were added to 96-well plates precoated with antibody against IFN-γ. There were four wells each participant: medium well (negative control), early secreted antigenic target 6 (ESAT-6) well (panel A), culture filtrate protein 10 (CFP-10) well (panel B), and PHA well (positive control). Cells were incubated for 16-20 h at 37°C with 5% CO2 and developed using anti-IFN-γ antibody conjugate with substrate to detect the presence of IFN-γ secreted cells. Spot-forming cells (SFCs) were counted with an automated enzyme-linked immunospot reader (CTL Analyzers, Cleveland, OH, USA). The criteria for T-SPOT results were recommended by the manufacturer (26). The test result was positive if ESAT-6 and/or CFP-10 spot number minus negative control spot number ≥ 6. The test result was negative if both ESAT-6 spot number minus negative control spot number and CFP-10 spot number minus negative control spot number ≤ 5. Results were considered undetermined if the spot number in PHA well were < 20 or if spot number in the medium well were > 10. We calculated the ratios of (a) ESAT-6 SFCs to PHA SFCs and (b) CFP-10 SFCs to PHA SFCs. The larger of the above two values was defined as TBAg/PHA ratio of one subject.
Detection of HLA-DR on MTB-Specific Cells
PBMCs were stimulated with peptide ESAT-6 (2μg/ml) and CFP-10 (2μg/ml) for 18 hours at 37°C with 5% CO2. Post incubation, PBMCs were first stained with Fixable Viability Stain 700 (BD Pharmingen) to differentiate live cells from dead cells, followed by appropriate surface marker staining. Cell surface staining was performed on PBMCs using the following anti-human monoclonal antibodies: anti-CD4-APC-Cy7 (Biolegend, Clone: RPA-T4; Cat# 300518) and anti-HLA-DR-PerCp-Cy 5.5 (Biolegend, Clone: L243; Cat# 307630). For intracellular staining, the cells were fixed and permeabilized with Fixation and Permeabilization Buffer (BD Biosciences). Intracellular cytokine staining was conducted using the flowing anti-human monoclonal antibodies: anti-IFN-γ-BV605 (Biolegend, Clone: 4S.B3; Cat# 502536) and anti-TNF-α-FITC (Biolegend, Clone: MAb11; Cat# 502906). Isotype controls with irrelevant specificities were included as negative controls. After washing, the pellets were resuspended in 300μl staining buffer and analyzed with FACSCanto II flow cytometer (BD Biosciences, San Jose, CA). The flow data were analyzed using Flowjo software version 10.6.2 (TreeStar, Ashland, OR). The gating strategy was showed in Figure 1.
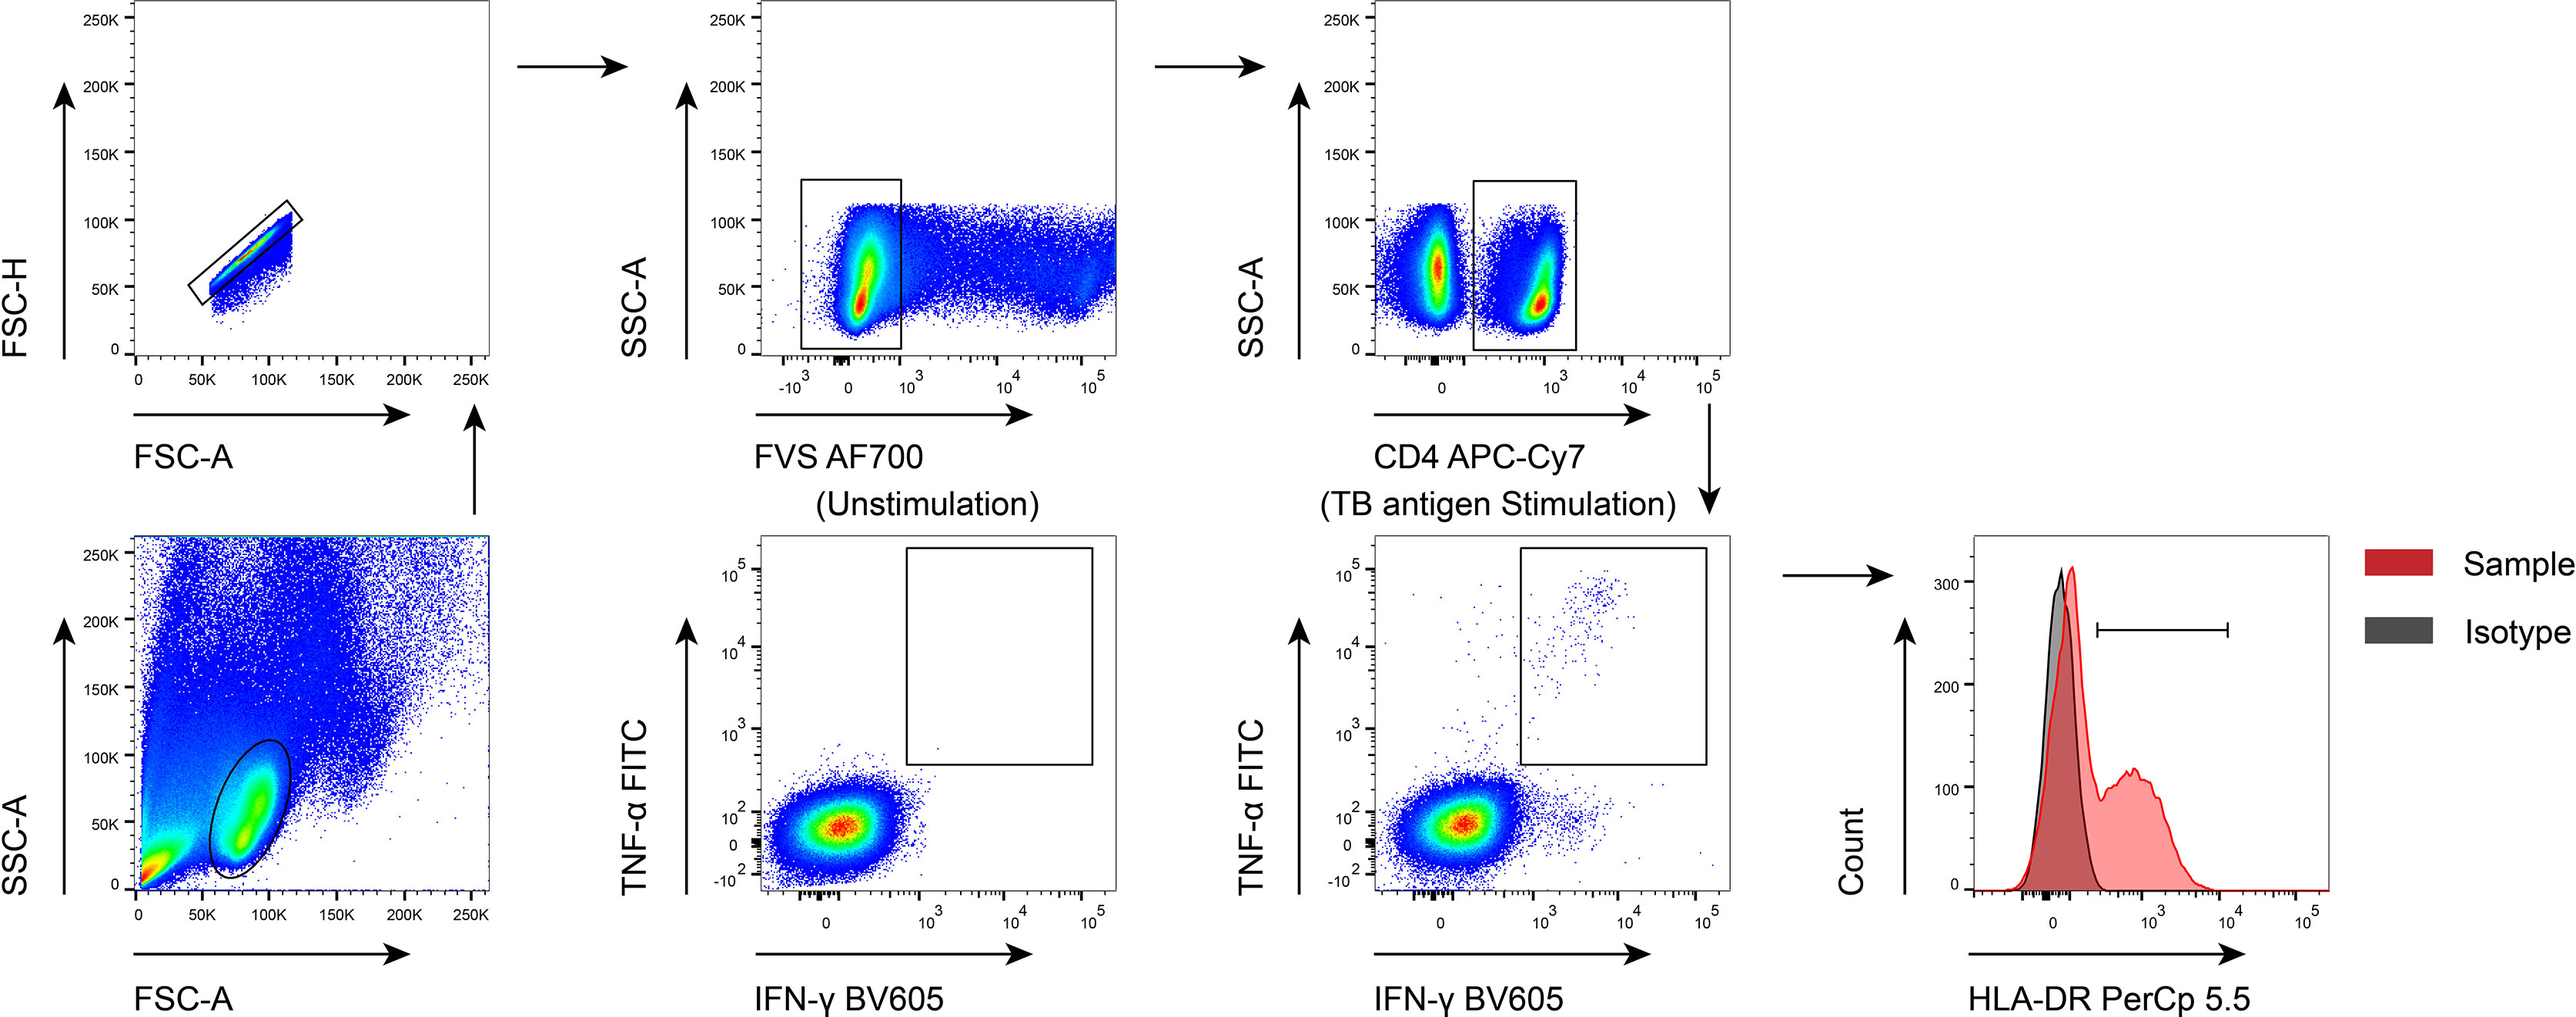
Figure 1 The gating strategies used in the current study. FVS, flexible viability stain; TB, tuberculosis.
MTB-specific cells were determined by IFN-γ and TNF-α co-producing cells upon TB antigen stimulation. Responders were regarded as cases with at least ten IFN-γ+TNF-α+ recorded events, and the proportion of IFN-γ+TNF-α+ cells after TB antigen stimulation was greater than 0.03% and was at least three times the frequency of that in the unstimulating control. HLA-DR expression analysis for MTB-specific cells were only performed on responders.
Statistical Analysis
Continuous variables were showed by median (interquartile range) or means ± standards deviation (SD). Categorical variables were expressed as number (%). Comparison between various groups was performed using Mann-Whitney U test for continuous variables, and Chi-square test or Fisher’s exact test for categorical variables. Wilcoxon test was used to compare various indicators of the same patient before and after anti-TB treatment. P values of less than 0.05 were considered significant. To establish the diagnostic model for distinguishing ATB from LTBI, variables with statistical difference were taken as candidates for further multivariable logistic regression. Subsequently, the regression equation and diagnostic model were obtained and a predictive value for each individual was calculated. Receiver operator characteristic (ROC) curve analysis was performed to define the diagnostic performance of various biomarkers. Area under the ROC curve (AUC), sensitivity, specificity, positive predictive value (PPV), negative predictive value (NPV), positive likelihood ratio (PLR), negative likelihood ratio (NLR), and accuracy, together with their 95% confidence intervals (CI), were determined. The comparison between various ROC AUCs was performed using by z test with the procedure of Delong et al. (27). All statistical analysis were conducted using GraphPad Prism software version 8.0 (GraphPad, San Diego, CA), MedCalc version 11.6 (MedCalc, Mariakerke, Belgium), and SPSS software version 25.0 (SPSS, Chicago, IL).
Results
Participants
A total of 116 subjects, including 54 ATB patients and 62 LTBI individuals were recruited at Qiaokou cohort. Another 84 cases, including 43 ATB patients and 41 LTBI individuals were enrolled in Caidian cohort. Demographic and clinical features of recruited participants in this study were shown in Table 1. The median age of included participants was around 50 years and more than half of these cases were males. No significant difference was observed between ATB and LTBI groups in distribution of age and gender among two cohorts.
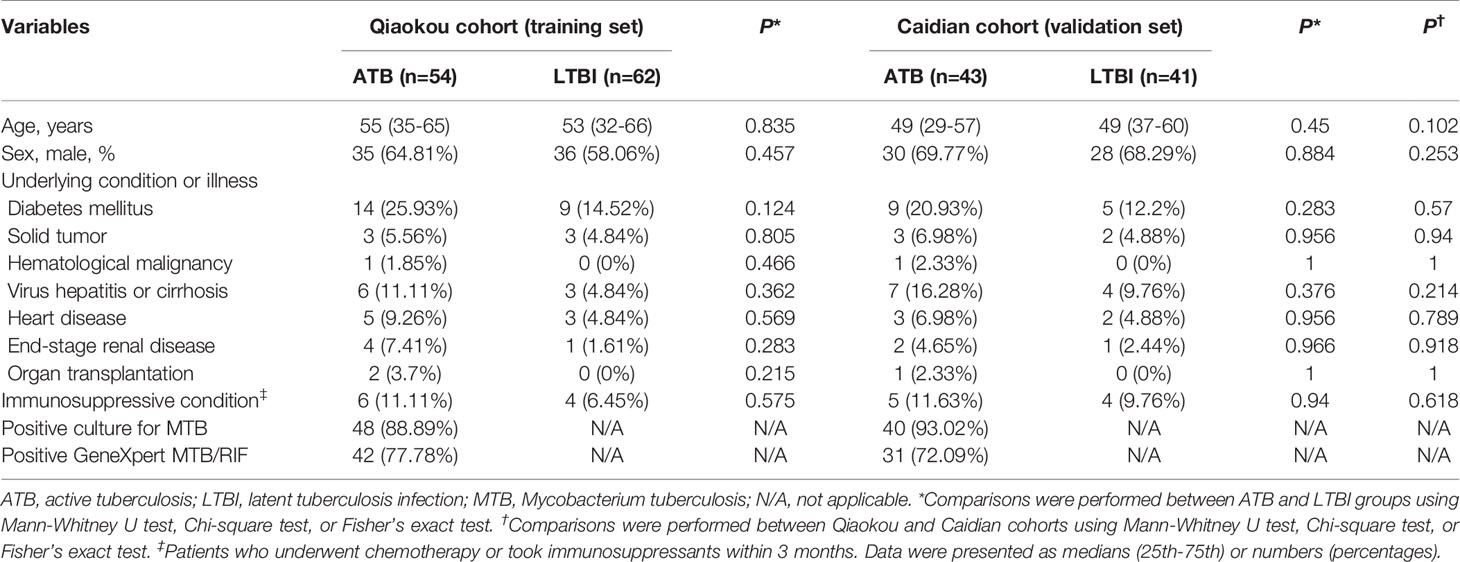
Table 1 Demographic and clinical characteristics of recruited participants.
HLA-DR on MTB-Specific Cells for Distinguishing ATB From LTBI
We compared HLA-DR expression on MTB-specific cells represented by IFN-γ+TNF-α+ cells upon TB antigen stimulation. It was observed that HLA-DR on IFN-γ+TNF-α+ cells was significantly higher in ATB group than that in LTBI group (Figure 2A). ROC curve analysis showed that HLA-DR on IFN-γ+TNF-α+ cells provided an AUC of 0.886 (95% CI, 0.826-0.946), with a sensitivity of 90.00% (95% CI, 78.64%-95.65%) and a specificity of 61.82% (95% CI, 48.61%-73.48%) to distinguish ATB from LTBI when a cut-off value of 49% was set (Table 2 and Figure 2B). We stratified the subjects according to the age and found that there was no significant difference in HLA-DR expression on MTB-specific cells between individuals with young age (≤ 50 years old) and those with old age (> 50 years old) in both ATB and LTBI group (Supplementary Figure 1A).
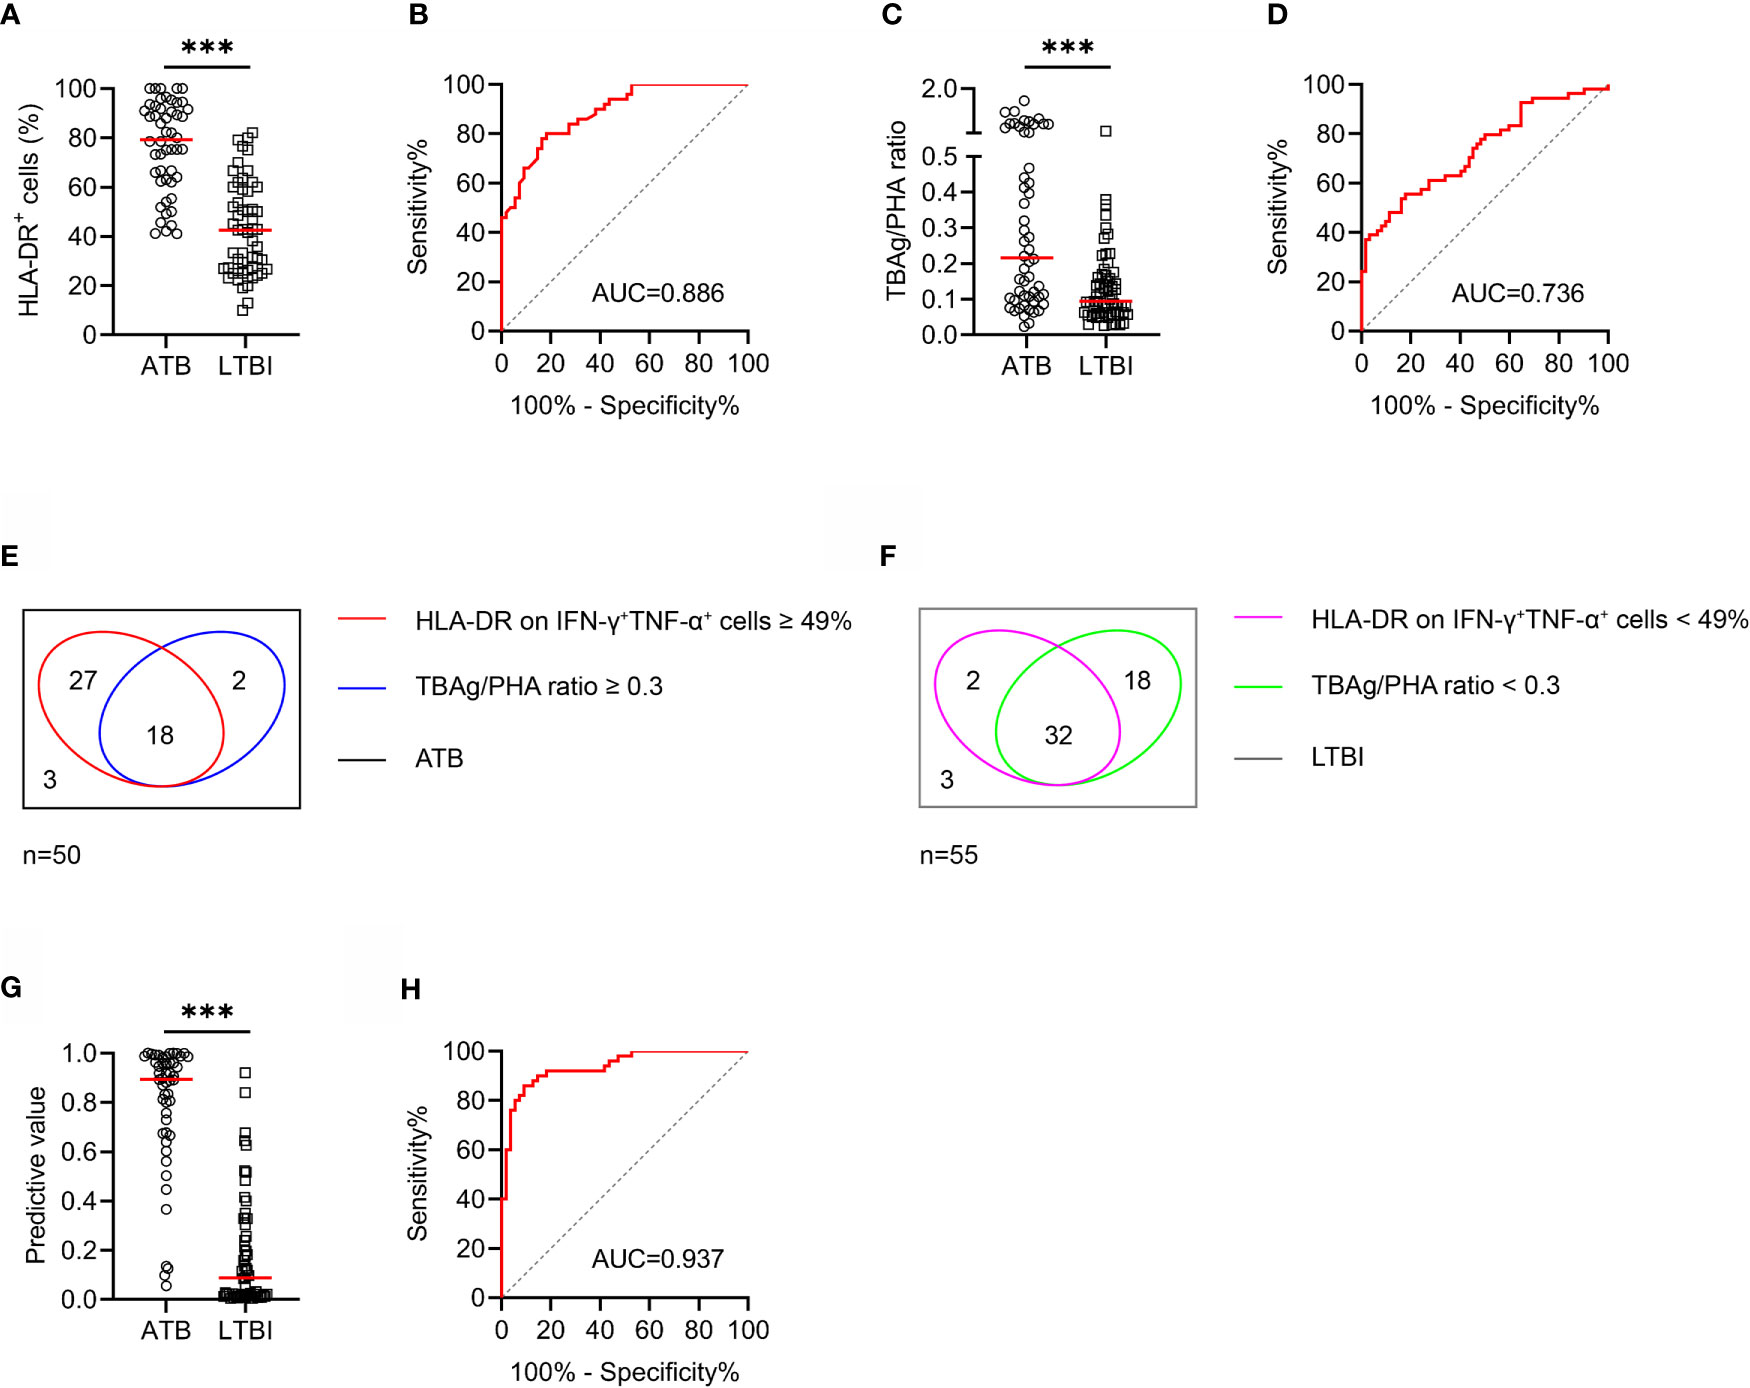
Figure 2 The performance of various indicators in distinguishing ATB patients from LTBI individuals in Qiaokou cohort. (A) Scatter dot plots showing the results of the expression of HLA-DR on IFN-γ+TNF-α+ cells in ATB patients and LTBI individuals. Horizontal lines indicate the medians. ***P < 0.001 (Mann-Whitney U test). (B) ROC curve analysis showing the performance of HLA-DR on IFN-γ+TNF-α+ cells in discriminating ATB patients from LTBI individuals. (C) Scatter dot plots showing the results of TBAg/PHA ratio in ATB patients and LTBI individuals. Horizontal lines indicate the medians. ***P < 0.001 (Mann-Whitney U test). (D) ROC curve analysis showing the performance of TBAg/PHA ratio in discriminating ATB patients from LTBI individuals. (E) Venn diagrams showing the overlap of HLA-DR on IFN-γ+TNF-α+ cells and TBAg/PHA ratio in ATB patients. (F) Venn diagrams showing the overlap of HLA-DR on IFN-γ+TNF-α+ cells and TBAg/PHA ratio in LTBI individuals. (G) Scatter plots showing the predictive value of diagnostic model in ATB patients and LTBI individuals. Horizontal lines indicate the medians. ***P < 0.001 (Mann-Whitney U test). (H) ROC curve analysis showing the performance of diagnostic model based on the combination of HLA-DR on MTB-specific cells and TBAg/PHA ratio in discriminating ATB patients from LTBI individuals. MTB, Mycobacterium tuberculosis; ATB, active tuberculosis; LTBI, latent tuberculosis infection; TBAg, tuberculosis antigens; PHA, phytohemagglutinin; AUC, area under the curve.

Table 2 The performance of various indicators for discriminating ATB from LTBI in Qiaokou cohort.
TBAg/PHA Ratio for Differentiating ATB From LTBI
The value of TBAg/PHA ratio for differentiating ATB from LTBI was also assessed. ATB patients had significantly higher TBAg/PHA ratio compared to LTBI individuals (Figure 2C). ROC curve analysis showed that TBAg/PHA ratio had an AUC of 0.736 (95% CI, 0.645-0.827) for discriminating patients with ATB from LTBI individuals (Figure 2D). When 0.3 was used as the threshold, the sensitivity and specificity of TBAg/PHA ratio for distinguishing ATB from LTBI was 40.74% (95% CI, 28.68%-54.03%) and 91.94% (95% CI, 82.47%-96.51%), respectively (Table 2). We stratified the subjects according to the age and found that the values of TBAg/PHA ratio in individuals with young age (≤ 50 years old) were slightly higher than those with old age (> 50 years old) in both ATB and LTBI group. However, there was no significant difference (Supplementary Figure 1B).
Establishing Diagnostic Model Based on Combining MTB-Specific Cell HLA-DR and TBAg/PHA Ratio for Discriminating ATB From LTBI
We found both MTB-specific cell HLA-DR and TBAg/PHA ratio showed moderate performance in discrimination between ATB and LTBI. However, the overlap between MTB-specific cell HLA-DR and TBAg/PHA ratio was observed using Venn diagram analysis, suggesting the combination of these two indicators might further improve the diagnostic value (Figures 2E, F). To determine whether the combination of these two indicators could improve the ability to discriminate ATB from LTBI, we generated a diagnostic model using logistic regression. A diagnostic model was developed as the following: P = 1/[1 + e-(0.094 × MTB-specific cell HLA-DR + 6.761 × TBAg/PHA ratio - 7.328)] P, predictive value; e, natural logarithm. The diagnostic model yielded promising discriminatory potential with an AUC of 0.937 (95% CI, 0.892-0.982) (Figures 2G, H). When the threshold was set as 0.36, the model performed excellently with a sensitivity of 92.00% (95% CI, 81.16%-96.85%) and specificity of 81.82% (95% CI, 69.67%-89.81%) (Table 2).
Value of Identified Biomarkers in Monitoring Anti-TB Treatment
To evaluate whether these identified biomarkers have the potential to be used for TB treatment monitoring, we compared the levels of MTB-specific cell HLA-DR, TBAg/PHA ratio as well as predictive value of diagnostic model before and after anti-TB treatment. It was observed that the level of MTB-specific cell HLA-DR, TBAg/PHA ratio, and predictive value were all significantly decreased after standard anti-TB treatment (Figure 3).
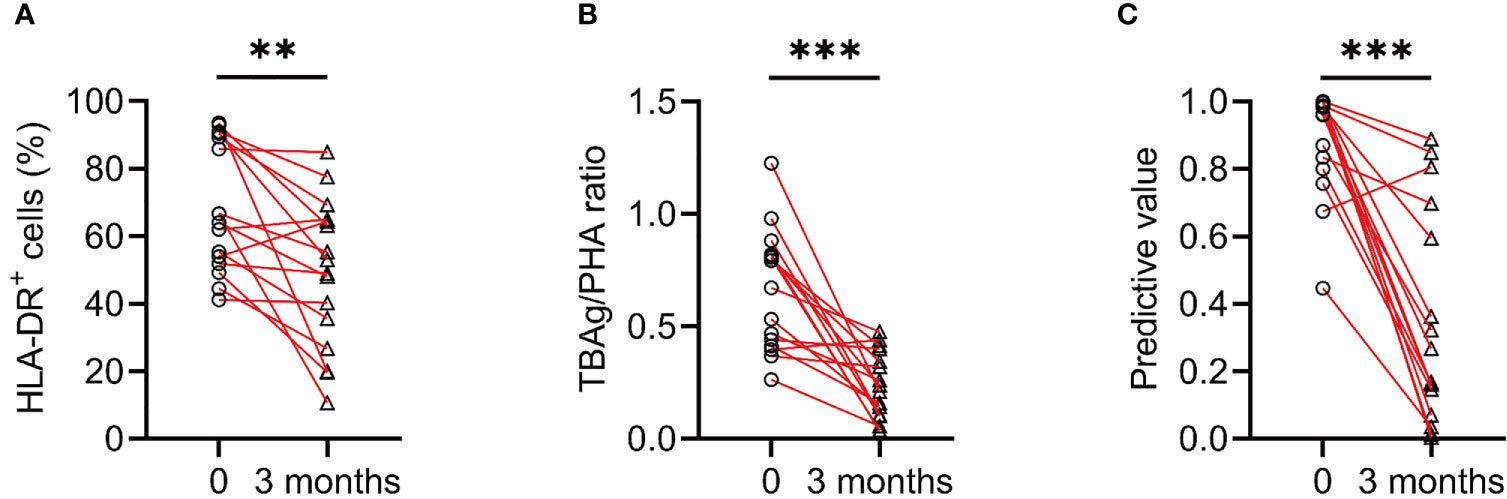
Figure 3 The change of various indicators after anti-TB treatment. (A) Line graphs showing the expression of HLA-DR on IFN-γ+TNF-α+ cells in ATB patients before and after 3 months of anti-TB treatment. **P < 0.01 (Wilcoxon test). (B) Line graphs showing the levels of TBAg/PHA ratio in ATB patients before and after 3 months of anti-TB treatment. ***P < 0.001 (Wilcoxon test). (C) Line graphs showing the predictive values of diagnostic model in ATB patients before and after 3 months of anti-TB treatment. ***P < 0.001 (Wilcoxon test). TBAg, tuberculosis antigens; PHA, phytohemagglutinin.
Independent Validation of the Diagnostic Model
In order to validate the performance of the diagnostic model, another independent cohort was included for evaluation. Similar performance was obtained with HLA-DR on MTB-specific cells in Caidian cohort. MTB-specific cell HLA-DR distinguished ATB patients from LTBI individuals with an AUC of 0.917 (95% CI, 0.856-0.977) and demonstrated a sensitivity and specificity of 91.89% (95% CI, 78.70%-97.21%) and 63.89% (95% CI, 47.58%-77.53%), respectively (Table 3 and Figures 4A, B). Meanwhile, TBAg/PHA ratio yielded a sensitivity of 37.21% (95% CI, 24.38%-52.14%) and specificity of 87.80% (95% CI, 74.46%-94.68%) in distinguishing ATB patients from LTBI individuals (Table 3 and Figures 4C, D). Furthermore, the diagnostic model produced an AUC of 0.941 (95% CI, 0.893-0.989), with a sensitivity of 91.89% (95% CI, 78.70%-97.21%) and a specificity of 86.11% (95% CI, 71.34%-93.92%) when a threshold of 0.36 was used (Table 3 and Figures 4E–H).

Table 3 The performance of various indicators for discriminating ATB from LTBI in Caidian cohort.
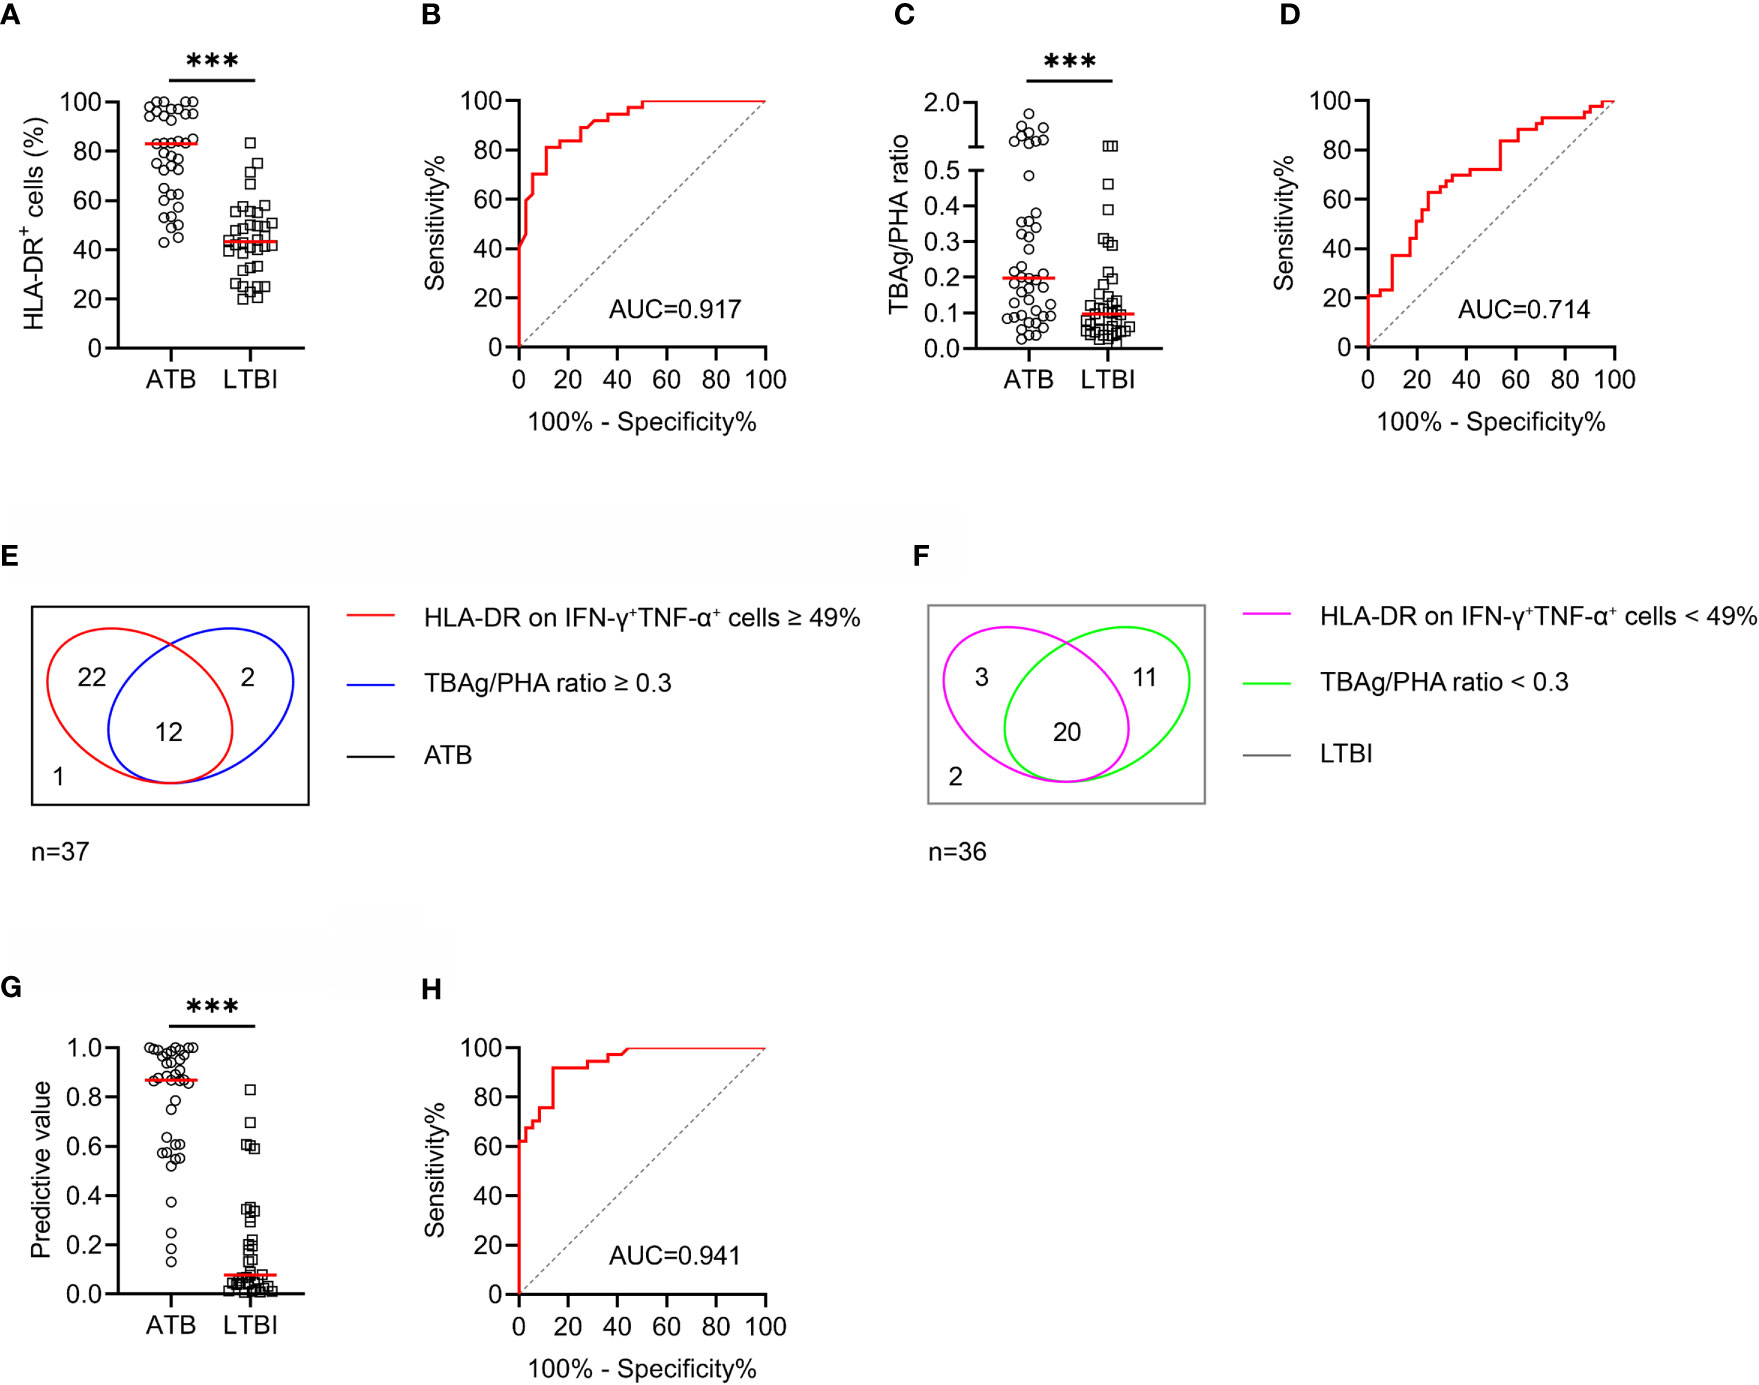
Figure 4 The performance of various indicators in distinguishing ATB patients from LTBI individuals in Caidian cohort. (A) Scatter dot plots showing the results of the expression of HLA-DR on IFN-γ+TNF-α+ cells in ATB patients and LTBI individuals. Horizontal lines indicate the medians. ***P < 0.001 (Mann-Whitney U test). (B) ROC curve analysis showing the performance of HLA-DR on IFN-γ+TNF-α+ cells in discriminating ATB patients from LTBI individuals. (C) Scatter dot plots showing the results of TBAg/PHA ratio in ATB patients and LTBI individuals. Horizontal lines indicate the medians. ***P < 0.001 (Mann-Whitney U test). (D) ROC curve analysis showing the performance of TBAg/PHA ratio in discriminating ATB patients from LTBI individuals. (E) Venn diagrams showing the overlap of HLA-DR on IFN-γ+TNF-α+ cells and TBAg/PHA ratio in ATB patients. (F) Venn diagrams showing the overlap of HLA-DR on IFN-γ+TNF-α+ cells and TBAg/PHA ratio in LTBI individuals. (G) Scatter plots showing the predictive value of diagnostic model in ATB patients and LTBI individuals. Horizontal lines indicate the medians. ***P < 0.001 (Mann-Whitney U test). (H) ROC curve analysis showing the performance of diagnostic model based on the combination of HLA-DR on MTB-specific cells and TBAg/PHA ratio in discriminating ATB patients from LTBI individuals. MTB, Mycobacterium tuberculosis; ATB, active tuberculosis; LTBI, latent tuberculosis infection; TBAg, tuberculosis antigens; PHA, phytohemagglutinin; AUC, area under the curve.
We also analyzed the pooled diagnostic performance of various indicators when combining two cohorts. It was observed that the sensitivity and specificity of MTB-specific cell HLA-DR for discriminating ATB from LTBI were 90.80% (95% CI, 82.89%-95.27%) and 62.64% (95% CI, 52.38%-71.88%), respectively (Supplementary Table 1 and Supplementary Figures 2A, B). TBAg/PHA ratio distinguished ATB from LTBI with a sensitivity of 39.18% (95% CI, 30.05%-49.12%) and a specificity of 90.29% (95% CI, 83.05%-94.64%) (Supplementary Table 1 and Supplementary Figures 2C, D). Moreover, the diagnostic model produced an AUC of 0.940 (95% CI, 0.907-0.972) in differentiating ATB from LTBI, with a sensitivity of 91.95% (95% CI, 84.31%-96.05%) and a specificity of 83.52% (95% CI, 74.57%-89.75%) (Supplementary Table 1 and Supplementary Figures 2E, F).
Discussion
Despite decades of research and significant investment, there still exists a huge gap in meeting clinical need for diagnosing TB. The conventional tools to diagnose ATB have major limitations including inadequate utility, high cost as well as long turnaround time (28). Meanwhile, an increasing number of studies denoted that host signature, especially omics, could serve as an alternative to pathogen detection (29). Identifying omics signatures for diagnosing TB have been facilitated by advances in technology to analyze obtained data using quantitative and high-throughput manner (30–33). However, even with numerous reports on novel candidates or multiple biomarker signatures, few of them have been independently validated for routine clinical use, and translated into applicable diagnostic tests. To achieve better management and control for TB, novel diagnostic strategies, especially based on present technology platform, are warranted.
Recently, MTB-specific cell signature such as activation and differentiation had been identified for the diagnosis of ATB (34–36). The available evidence indicated that HLA-DR on MTB-specific cells might be the most promising biomarker (37). Our data in this study also confirmed the discriminatory role of this indicator in distinguishing between ATB and LTBI. Notwithstanding, far less is known about the reliability and ability of combining MTB-specific cell HLA-DR and other indicators for the differential diagnosis between ATB and LTBI. To our knowledge, the present study established diagnostic model based on the combination of HLA-DR on MTB-specific cells and TBAg/PHA ratio for the first time. Our results demonstrated that the combination could further improve the diagnostic value. Moreover, we evaluated the value of these biomarkers in monitoring anti-TB treatment. The significant change with treatment denoted their potential value for monitoring therapy responses.
Two points should be pointed out in the present study. Firstly, we did find a high sensitivity and a moderate specificity of MTB-specific cell HLA-DR expression for differentiating ATB from LTBI. However, this seemed to be inconsistent with some previous studies, which showed that HLA-DR is a superior indicator with both excellent sensitivity and specificity (19). Nevertheless, we seemed to find an answer from the study conducted by Mpande and his/her colleagues (20). They reported that MTB-specific cells, from the LTBI population who were infected with MTB recently, also showed high activation, suggesting that the loss of specificity exhibited by HLA-DR in distinguishing ATB from LTBI is due to the presence of this population. Yet these cases did not show high values of TBAg/PHA ratio. Therefore, the combination of these two indicators could mainly contribute to improving the specificity, not the sensitivity. Second, we found that the sensitivity of TBAg/PHA ratio on distinguishing ATB from LTBI in this study was obviously lower than those reported in several previous studies (22), while similar with the utility obtained in a recent real-world data analysis from China (38) and another study from Japan (39). It was observed that the studies with good performance were often performed with patient exclusion such as immunosuppression. Therefore, the value of TBAg/PHA ratio in clinical application is mainly reflected in its acceptable specificity. In other words, TBAg/PHA ratio should be used more as a rule-in tool for its high specificity, rather than a rule-out test.
An optimal biomarker-based test would ideally be feasible with limited instrumentation and based on easily accessible samples such as peripheral blood. The methods involved in our diagnostic model fit the requirement. However, several limitations should be mentioned in this study. First, although two centers were included in our design, the number of subjects per center was too small and further validation with a large sample size is still needed in the future. Second, our model may not be helpful for T-SPOT-negative TB patients due to the lack of sufficient detectable MTB-specific cells in this population (40). More suitable tools should be developed targeting this population. Finally, since the established model was built based on two different techniques, the economic and clinical usefulness remain to be clarified in the further research.
In conclusion, the diagnostic model based on the combination of HLA-DR on MTB-specific cells and TBAg/PHA ratio would represent a new era of prompt TB diagnosis as an excellent auxiliary tool and enable earlier treatment, and thus reduce the spread of the disease, contributing toward paving the way for ending TB epidemic.
Data Availability Statement
The original contributions presented in the study are included in the article/Supplementary Material. Further inquiries can be directed to the corresponding authors.
Ethics Statement
The studies involving human participants were reviewed and approved by the Ethics Committee of Tongji Hospital, Tongji Medical College, Huazhong University of Science and Technology. The patients/participants provided their written informed consent to participate in this study.
Author Contributions
YL: had the original idea of this study. YL: conceived and designed the study. YL, YX, BY, JH, and WW: performed the experiments. YL: performed data collection and analysis. YL: wrote the manuscript. YL, GT, QL, HS, WL, and LM: enrolled participants. YL, FW, and ZS: contributed to revisions of the manuscript. All authors contributed to the article and approved the submitted version.
Funding
This work was funded by Graduate Innovation Fund of Huazhong University of Science and Technology (grant number 2021yjsCXCY088) and Special Foundation for National Science and Technology Basic Research Program of China (grant number 2019FY101206).
Conflict of Interest
The authors declare that the research was conducted in the absence of any commercial or financial relationships that could be construed as a potential conflict of interest.
Publisher’s Note
All claims expressed in this article are solely those of the authors and do not necessarily represent those of their affiliated organizations, or those of the publisher, the editors and the reviewers. Any product that may be evaluated in this article, or claim that may be made by its manufacturer, is not guaranteed or endorsed by the publisher.
Acknowledgments
The authors would like to acknowledge all staff of the immunology group, Department of Laboratory Medicine, Tongji Hospital: Shiji Wu, Renren Ouyang, Min Huang, Hongyan Hou, Yun Wang, Minxia Zhang, Ting Wang, and Xiwen Zhang.
Supplementary Material
The Supplementary Material for this article can be found online at: https://www.frontiersin.org/articles/10.3389/fimmu.2021.761209/full#supplementary-material
Supplementary Figure 1 | The results of various indicators in different age range. (A) Scatter dot plots showing the results of the expression of HLA-DR on IFN-γ+TNF-α+ cells under young age (≤ 50 years old) and old age (> 50 years old) in ATB patients and LTBI individuals. Horizontal lines indicate the medians. (B) Scatter dot plots showing the results of TBAg/PHA ratio under young age (≤ 50 years old) and old age (> 50 years old) in ATB patients and LTBI individuals. Horizontal lines indicate the medians.
Supplementary Figure 2 | The pooled performance of various indicators in distinguishing ATB patients from LTBI individuals. (A) Scatter dot plots showing the results of the expression of HLA-DR on IFN-γ+TNF-α+ cells in ATB patients and LTBI individuals. Horizontal lines indicate the medians. ***P < 0.001 (Mann-Whitney U test). (B) ROC curve analysis showing the performance of HLA-DR on IFN-γ+TNF-α+ cells in discriminating ATB patients from LTBI individuals. (C) Scatter dot plots showing the results of TBAg/PHA ratio in ATB patients and LTBI individuals. Horizontal lines indicate the medians. ***P < 0.001 (Mann-Whitney U test). (D) ROC curve analysis showing the performance of TBAg/PHA ratio in discriminating ATB patients from LTBI individuals. (E) Scatter plots showing the predictive value of diagnostic model in ATB patients and LTBI individuals. Horizontal lines indicate the medians. ***P < 0.001 (Mann-Whitney U test). (F) ROC curve analysis showing the performance of diagnostic model based on the combination of HLA-DR on MTB-specific cells and TBAg/PHA ratio in discriminating ATB patients from LTBI individuals. MTB, Mycobacterium tuberculosis; ATB, active tuberculosis; LTBI, latent tuberculosis infection; TBAg, tuberculosis antigens; PHA, phytohemagglutinin; AUC, area under the curve.
References
1. Tang J, Yam WC, Chen Z. Mycobacterium Tuberculosis Infection and Vaccine Development. Tuberc (Edinb) (2016) 98:30–41. doi: 10.1016/j.tube.2016.02.005
2. World Health Organization. Global Tuberculosis Report 2020. Geneva, Switzerland: World Health Organization (2020). Available at: https://appswhoint/iris/rest/bitstreams/1312164/retrieve.
3. World Health Organization. Guidelines on the Management of Latent Tuberculosis Infection. Geneva, Switzerland: World Health Organization (2014). Available at: https://appswhoint/iris/rest/bitstreams/607678/retrieve.
4. Cohen A, Mathiasen VD, Schön T, Wejse C. The Global Prevalence of Latent Tuberculosis: A Systematic Review and Meta-Analysis. Eur Respir J (2019) 54(3):1900655. doi: 10.1183/13993003.00655-2019
5. World Health Organization. The End TB Strategy. Geneva, Switzerland: World Health Organization (2015). Available at: https://appswhoint/iris/rest/bitstreams/1271371/retrieve.
6. Wang F, Liu K, Peng J, Luo Y, Tang G, Lin Q, et al. Combination of Xpert MTB/RIF and TBAg/PHA Ratio for Prompt Diagnosis of Active Tuberculosis: A Two-Center Prospective Cohort Study. Front Med (Lausanne) (2020) 7:119. doi: 10.3389/fmed.2020.00119
7. Wang L, Tian XD, Yu Y, Chen W. Evaluation of the Performance of Two Tuberculosis Interferon Gamma Release Assays (IGRA-ELISA and T-SPOT.TB) for Diagnosing Mycobacterium Tuberculosis Infection. Clin Chim Acta (2018) 479:74–8. doi: 10.1016/j.cca.2018.01.014
8. Kang WL, Wang GR, Wu MY, Yang KY, Er-Tai A, Wu SC, et al. Interferon-Gamma Release Assay Is Not Appropriate for the Diagnosis of Active Tuberculosis in High-Burden Tuberculosis Settings: A Retrospective Multicenter Investigation. Chin Med J (Engl) (2018) 131(3):268–75. doi: 10.4103/0366-6999.223860
9. Lai CC, Tan CK, Lin SH, Liao CH, Huang YT, Hsueh PR. Diagnostic Performance of Whole-Blood Interferon-Gamma Assay and Enzyme-Linked Immunospot Assay for Active Tuberculosis’. Diagn Microbiol Infect Dis (2011) 71(2):139–43. doi: 10.1016/j.diagmicrobio.2011.05.013
10. Ho J, Bokil NJ, Nguyen PTB, Nguyen TA, Liu MY, Hare N, et al. A Transcriptional Blood Signature Distinguishes Early Tuberculosis Disease From Latent Tuberculosis Infection and Uninfected Individuals in a Vietnamese Cohort. J Infect (2020) 81(1):72–80. doi: 10.1016/j.jinf.2020.03.066
11. Estevez O, Anibarro L, Garet E, Pallares A, Barcia L, Calvino L, et al. An RNA-Seq Based Machine Learning Approach Identifies Latent Tuberculosis Patients With an Active Tuberculosis Profile. Front Immunol (2020) 11:1470. doi: 10.3389/fimmu.2020.01470
12. Morris TC, Hoggart CJ, Chegou NN, Kidd M, Oni T, Goliath R, et al. Evaluation of Host Serum Protein Biomarkers of Tuberculosis in Sub-Saharan Africa. Front Immunol (2021) 12:639174. doi: 10.3389/fimmu.2021.639174
13. Garay-Baquero DJ, White CH, Walker NF, Tebruegge M, Schiff HF, Ugarte-Gil C, et al. Comprehensive Plasma Proteomic Profiling Reveals Biomarkers for Active Tuberculosis. JCI Insight (2020) 5(18):e137427. doi: 10.1172/jci.insight.137427
14. Luo Y, Xue Y, Lin Q, Tang G, Yuan X, Mao L, et al. A Combination of Iron Metabolism Indexes and Tuberculosis-Specific Antigen/Phytohemagglutinin Ratio for Distinguishing Active Tuberculosis From Latent Tuberculosis Infection. Int J Infect Dis (2020) 97:190–6. doi: 10.1016/j.ijid.2020.05.109
15. Dai Y, Shan W, Yang Q, Guo J, Zhai R, Tang X, et al. Biomarkers of Iron Metabolism Facilitate Clinical Diagnosis in M Ycobacterium Tuberculosis Infection. Thorax (2019) 74(12):1161–7. doi: 10.1136/thoraxjnl-2018-212557
16. Wallis RS, Kim P, Cole S, Hanna D, Andrade BB, Maeurer M, et al. Tuberculosis Biomarkers Discovery: Developments, Needs, and Challenges. Lancet Infect Dis (2013) 13(4):362–72. doi: 10.1016/S1473-3099(13)70034-3
17. Luo Y, Xue Y, Cai Y, Lin Q, Tang G, Song H, et al. Lymphocyte Non-Specific Function Detection Facilitating the Stratification of Mycobacterium Tuberculosis Infection. Front Immunol (2021) 12:641378. doi: 10.3389/fimmu.2021.641378
18. Adekambi T, Ibegbu CC, Cagle S, Ray SM, Rengarajan J. High Frequencies of Caspase-3 Expressing Mycobacterium Tuberculosis-Specific CD4(+) T Cells Are Associated With Active Tuberculosis. Front Immunol (2018) 9:1481. doi: 10.3389/fimmu.2018.01481
19. Adekambi T, Ibegbu CC, Cagle S, Kalokhe AS, Wang YF, Hu Y, et al. Biomarkers on Patient T Cells Diagnose Active Tuberculosis and Monitor Treatment Response. J Clin Invest (2015) 125(5):1827–38. doi: 10.1172/JCI77990
20. Mpande CAM, Musvosvi M, Rozot V, Mosito B, Reid TD, Schreuder C, et al. Antigen-Specific T Cell Activation Distinguishes Between Recent and Remote Tuberculosis Infection. Am J Respir Crit Care Med (2021) 203(12):1556–65. doi: 10.1164/rccm.202007-2686OC
21. Luo Y, Xue Y, Yuan X, Lin Q, Tang G, Mao L, et al. Combination of Prealbumin and Tuberculosis-Specific Antigen/Phytohemagglutinin Ratio for Discriminating Active Tuberculosis From Latent Tuberculosis Infection. Int J Clin Pract (2020) 75(4):e13831. doi: 10.1111/ijcp.13831
22. Wang F, Hou HY, Wu SJ, Zhu Q, Huang M, Yin B, et al. Using the TBAg/PHA Ratio in the T-SPOT((R)).TB Assay to Distinguish TB Disease From LTBI in an Endemic Area. Int J Tuberc Lung Dis (2016) 20(4):487–93. doi: 10.5588/ijtld.15.0756
23. Harari A, Rozot V, Bellutti Enders F, Perreau M, Stalder JM, Nicod LP, et al. Dominant TNF-Alpha+ Mycobacterium Tuberculosis-Specific CD4+ T Cell Responses Discriminate Between Latent Infection and Active Disease. Nat Med (2011) 17(3):372–6. doi: 10.1038/nm.2299
24. Carranza C, Pedraza-Sanchez S, de Oyarzabal-Mendez E, Torres M. Diagnosis for Latent Tuberculosis Infection: New Alternatives. Front Immunol (2020) 11:2006. doi: 10.3389/fimmu.2020.02006
25. Paton NI, Borand L, Benedicto J, Kyi MM, Mahmud AM, Norazmi MN, et al. Diagnosis and Management of Latent Tuberculosis Infection in Asia: Review of Current Status and Challenges. Int J Infect Dis (2019) 87:21–9. doi: 10.1016/j.ijid.2019.07.004
26. Oxford Immunotec. The T-SPOT.TB Test Package Insert (2021). Available at: https://wwwtspotcom/ (Accessed June 2021).
27. DeLong ER, DeLong DM, Clarke-Pearson DL. Comparing the Areas Under Two or More Correlated Receiver Operating Characteristic Curves: A Nonparametric Approach. Biometrics (1988) 44(3):837–45. doi: 10.2307/2531595
28. World Health Organization. Framework for the Evaluation of New Tests for Tuberculosis Infection (2020). Available at: https://appswhoint/iris/rest/bitstreams/1288536/retrieve.
29. Turner CT, Gupta RK, Tsaliki E, Roe JK, Mondal P, Nyawo GR, et al. Blood Transcriptional Biomarkers for Active Pulmonary Tuberculosis in a High-Burden Setting: A Prospective, Observational, Diagnostic Accuracy Study. Lancet Respir Med (2020) 8(4):407–19. doi: 10.1016/S2213-2600(19)30469-2
30. Wang S, He L, Wu J, Zhou Z, Gao Y, Chen J, et al. Transcriptional Profiling of Human Peripheral Blood Mononuclear Cells Identifies Diagnostic Biomarkers That Distinguish Active and Latent Tuberculosis. Front Immunol (2019) 10:2948. doi: 10.3389/fimmu.2019.02948
31. Sivakumaran D, Ritz C, Gjoen JE, Vaz M, Selvam S, Ottenhoff THM, et al. Host Blood RNA Transcript and Protein Signatures for Sputum-Independent Diagnostics of Tuberculosis in Adults. Front Immunol (2020) 11:626049. doi: 10.3389/fimmu.2020.626049
32. Mutavhatsindi H, van der Spuy GD, Malherbe ST, Sutherland JS, Geluk A, Mayanja-Kizza H, et al. Validation and Optimization of Host Immunological Bio-Signatures for a Point-Of-Care Test for TB Disease. Front Immunol (2021) 12:607827. doi: 10.3389/fimmu.2021.607827
33. Chendi BH, Snyders CI, Tonby K, Jenum S, Kidd M, Walzl G, et al. A Plasma 5-Marker Host Biosignature Identifies Tuberculosis in High and Low Endemic Countries. Front Immunol (2021) 12:608846. doi: 10.3389/fimmu.2021.608846
34. Ahmed MIM, Ntinginya NE, Kibiki G, Mtafya BA, Semvua H, Mpagama S, et al. Phenotypic Changes on Mycobacterium Tuberculosis-Specific CD4 T Cells as Surrogate Markers for Tuberculosis Treatment Efficacy. Front Immunol (2018) 9:2247. doi: 10.3389/fimmu.2018.02247
35. Acharya MP, Pradeep SP, Murthy VS, Chikkannaiah P, Kambar V, Narayanashetty S, et al. CD38 +CD27 -TNF-Alpha + on Mtb-Specific CD4 + T Is a Robust Biomarker for Tuberculosis Diagnosis. Clin Infect Dis (2021) 73(5):793–801. doi: 10.1093/cid/ciab144
36. Mpande CAM, Rozot V, Mosito B, Musvosvi M, Dintwe OB, Bilek N, et al. Immune Profiling of Mycobacterium Tuberculosis-Specific T Cells in Recent and Remote Infection. EBioMedicine (2021) 64:103233. doi: 10.1016/j.ebiom.2021.103233
37. Musvosvi M, Duffy D, Filander E, Africa H, Mabwe S, Jaxa L, et al. T-Cell Biomarkers for Diagnosis of Tuberculosis: Candidate Evaluation by a Simple Whole Blood Assay for Clinical Translation. Eur Respir J (2018) 51(3):1800153. doi: 10.1183/13993003.00153-2018
38. Peng J, Song J, Wang F, Zuo P, Lu Y, Liu W, et al. Harnessing Big Data to Optimize an Algorithm for Rapid Diagnosis of Pulmonary Tuberculosis in a Real-World Setting. Front Cell Infect Microbiol (2021) 11:650163. doi: 10.3389/fcimb.2021.650163
39. Katakura S, Kobayashi N, Hashimoto H, Kamimaki C, Tanaka K, Kubo S, et al. Identification of a Novel Biomarker Based on Lymphocyte Count, Albumin Level, and TBAg/PHA Ratio for Differentiation Between Active and Latent Tuberculosis Infection in Japan. Tuberc (Edinb) (2020) 125:101992. doi: 10.1016/j.tube.2020.101992
Keywords: Mycobacterium tuberculosis-specific cells, HLA-DR, TBAg/PHA ratio, discrimination, active tuberculosis, latent tuberculosis infection
Citation: Luo Y, Xue Y, Tang G, Lin Q, Song H, Liu W, Yin B, Huang J, Wei W, Mao L, Wang F and Sun Z (2021) Combination of HLA-DR on Mycobacterium tuberculosis-Specific Cells and Tuberculosis Antigen/Phytohemagglutinin Ratio for Discriminating Active Tuberculosis From Latent Tuberculosis Infection. Front. Immunol. 12:761209. doi: 10.3389/fimmu.2021.761209
Received: 19 August 2021; Accepted: 11 October 2021;
Published: 11 November 2021.
Edited by:
Novel N. Chegou, Stellenbosch University, South AfricaReviewed by:
Alasdair Leslie, Africa Health Research Institute (AHRI), South AfricaYonas Bekele, National Institutes of Health (NIH), United States
Copyright © 2021 Luo, Xue, Tang, Lin, Song, Liu, Yin, Huang, Wei, Mao, Wang and Sun. This is an open-access article distributed under the terms of the Creative Commons Attribution License (CC BY). The use, distribution or reproduction in other forums is permitted, provided the original author(s) and the copyright owner(s) are credited and that the original publication in this journal is cited, in accordance with accepted academic practice. No use, distribution or reproduction is permitted which does not comply with these terms.
*Correspondence: Liyan Mao, 862200862@qq.com; Feng Wang, fengwang@tjh.tjmu.edu.cn; Ziyong Sun, zysun@tjh.tjmu.edu.cn; Ying Luo, 13349917282@163.com