 Yanli Wang1†
 Yang Cao
 Cheng Xiao
- 1Institute of Animal Biotechnology, Jilin Academy of Agricultural Science, Changchun, China
- 2Institute of Animal Husbandry and Veterinary, Zhejiang Academy of Agricultural Sciences, Hangzhou, China
Acetyl-CoA acyltransferase 1 (ACAA1) functions as a key regulator of fatty acid β-oxidation in peroxisomes by catalyzing the cleavage of 3-ketoacyl-CoA to acetyl-CoA and acyl-CoA, which participate in the extension and degradation of fatty acids. Thus, ACAA1 is an important regulator of lipid metabolism and plays an essential role in fatty acid oxidation and lipid metabolism. Our previous study findings revealed that ACAA1 is closely associated with the peroxisome proliferator-activated receptor (PPAR) signaling and fatty acid metabolism pathways, which are involved in fat deposition in sheep, leading to our hypothesis that ACAA1 may be involved in fat deposition by regulating lipid metabolism. However, the associated molecular mechanism remains unclear. In the present study, to assess the potential function of ACAA1 in sheep preadipocyte differentiation, we knocked down and overexpressed ACAA1 in sheep preadipocytes and evaluated the pattern of ACAA1 gene expression during preadipocyte differentiation by qRT-PCR. ACAA1 was significantly expressed in the early stage of adipocyte differentiation, and then its expression decreased. ACAA1 deficiency increased lipid accumulation and the triglyceride content and promoted sheep preadipocyte differentiation, whereas ACAA1 overexpression inhibited adipogenesis and decreased lipid accumulation and the triglyceride content. Simultaneously, we demonstrated that ACAA1 deficiency upregulated the expressions of the adipogenic marker genes PPARγ and C/EBPα in sheep preadipocytes, but ACAA1 overexpression inhibited the expressions of these markers, indicating that ACAA1 affects lipid metabolism by regulating adipogenic marker genes. Our results may promote a better understanding of the regulation of adipogenesis by ACAA1.
Introduction
Adipose tissue, which comprises brown and white adipocytes, is essential for maintaining energy and metabolic homeostasis in animals and plays an essential role in animal endocrine function (Gesta et al., 2007; Galic et al., 2010). Furthermore, adipose tissue secretes several cytokines and hormones that affect the function of cells and tissues (Galic et al., 2010). In mammals, the normal that cleaves peroxisom development of adipose tissue is crucial to maintaining good health. The intramuscular fat content directly affects the meat quality and flavor in animal production, and the abnormal metabolism of adipose tissue can affect meat quality in livestock (Wood et al., 2008). Therefore, elucidating the molecular mechanisms involved in adipocyte differentiation is vital for disease treatment and improving the economic benefits of animal husbandry production.
Acetyl-coenzyme A acyltransferase (ACAA) is a thiolytic enzyme of the acyl-CoA superfamily of metabolic enzymes (Stim-Herndon et al., 1995; Vishwakarma et al., 2013; Ya, 2013). ACAA family members include ACAA1 and ACAA2. ACAA1, also known as peroxisome 3-ketoacyl-CoA thiolase, is a crucial enzyme that regulates the β-oxidation of fatty acids in peroxisomes and plays an essential role in fatty acid metabolism (Wanders et al., 2001). The β-oxidation of fatty acids alters the fatty acid content of animals, affecting the meat quality of livestock and poultry.
Because of the changing dietary habits of individuals and the gradual strengthening of healthcare awareness, mutton has become favored by the general public as a green food because of its high protein content, low cholesterol levels, and excellent nutritional qualities (Cao, 2017). The meat quality of animals is closely associated with their fat content because an appropriate intramuscular fat content can increase marbling, reduce shear force, and increase meat flavor and palatability. Additionally, the intramuscular fat content has special significance for production efficiency and meat quality. Intramuscular fat is regulated by lipid metabolism and is synthesized from glycerol and fatty acids. The whole metabolic process is a complex and highly coordinated process (Fang, 2017). Genetic factors affect the accumulation of intramuscular fat by regulating de novo lipogenesis and adipocyte differentiation. In a previous screen for functional genes associated with lipid metabolism that affect meat quality, ACAA2, a member of the acetyl-CoA acyltransferase family, was identified as a key functional gene affecting lipid metabolism (Li, 2008). ACAA1 is an important regulator of fatty acid metabolism (Wanders et al., 2001); presently, studies on ACAA1 have primarily focused on human metabolic diseases, tumors, and cancer. As a regulator of lipid metabolism, few reports have investigated the involvement of ACAA1 in animal meat quality breeding. In the present study, the pattern of ACAA1 gene expression during the adipogenic differentiation of sheep preadipocytes was analyzed to assess its role in the adipogenic differentiation process. Investigating the effect of ACAA1 gene expression on adipogenic differentiation at the cellular and molecular levels is crucial to further improve mutton quality.
Materials and Methods
Experimental Animals
Three-month-old lambs were provided by the Institute of Animal Biotechnology (Jilin Academy of Agricultural Science, Changchun, China). All the experimental procedures were examined and approved by the Animal Welfare and Ethics Committee of Jilin Academy of Agricultural Sciences (AWEC 2019A05, May 16, 2019) and complied with the rules and regulations established by the Chinese Experimental Animal Ethics Committee.
Cell Isolation, Cultivation, and Adipocyte Differentiation
The precursor adipocytes were separated by the collagenase digestion method (Church et al., 2014). Sheep preadipocytes were isolated from the inguinal subcutaneous adipose tissue of 3-month-old male lambs. Next, the animals were anesthetized by air embolization and slaughtered in a specific slaughtering chamber; immediately after slaughter, their adipose tissue was collected under sterile conditions. Freshly isolated subcutaneous adipose tissues were cut into small pieces and weighed. Next, two volumes of 0.2% collagenase II (Sangon Biotech, Shanghai, China) were added per gram of tissue, and the sample was thoroughly mixed. The sample was digested in a water bath at 37°C for 40–90 min. After the digestion was terminated, the cells were obtained by filtration using 200- and 400-mesh filters, and the filtrate was centrifuged three times for 5 min at 1,500 rpm. Subsequently, the cells were cultured in Dulbecco’s modified Eagle’s medium (DMEM/F12; 1:1; Gibco, Shanghai, China) containing 10% fetal bovine serum (Gemini, Woodland, CL, United States) and 1% penicillin/streptomycin (Sangon Biotech) for 24 h at 37°C under an atmosphere with 5% CO2. The non-adherent cells were washed away with phosphate-buffered saline (PBS; Gibco, Shanghai, China), and the buffered medium was changed every 48 h. Once the cell confluence reached 100% (0 days), the sheep preadipocytes were induced to differentiate by adding 10 μg/ml of insulin, 0.5 mM 3-isobutyl-1-methylxanthine (IBMX; Sigma, St. Louis, MO, United States) and 1.0 μM dexamethasone (DEX; Sigma) to the culture medium. The cells were then incubated for 2 days, after which 10 μg/ml of insulin (Sigma) was added and the cells were incubated for an additional 2 days (total of 4 days of incubation). Subsequently, the medium was changed every 48 h until the differentiation process was complete (after 8 days).
Oil Red O Staining and Detection of the Triglyceride Content
Differentiated adipocytes were washed three times with PBS and then fixed with 4% paraformaldehyde (Sangon Biotech, Shanghai, China) for 30 min at 37°C. Next, the cells were washed three times with PBS, stained with 2% oil red O (Sangon Biotech, Shanghai, China) solution at 37°C for 30 min, and washed three times with PBS before being visualized with a microscope for analysis. Subsequently, the oil red O solution was extracted with 100% isopropanol for 10 min, after which the absorbance of lipid droplets at 490 nm was measured on a microboard reader (Ramírezzacarías et al., 1992) (Thermo Fisher Scientific, Carlsbad, CA, United States). The triglyceride content in adipocytes was determined at room temperature using a triglyceride enzyme-linked assay kit E1030 (Applygen, Beijing, China).
Transfection of Sheep Preadipocytes
Cell transfection was performed as previously reported by Zhang et al. (2018) and Yun et al. ‘(2018). Both the recombinant overexpression plasmid ACAA1-PEX-4 (50 μg) and the empty vector PEX-4 (50 μg) used in the present study were obtained from GenePharma Company (Suzhou, China). ACAA1–PEX-4 was synthesized from PEX-4 and complementary DNA (cDNA) harboring the ACAA1 gene, both of which were digested with the XhoI and EcoRI restriction endonucleases. PEX-4 was used as a negative control (NC), and a vector containing enhanced green fluorescent protein (EGFP) was used to confirm the transfection efficiency. Sheep preadipocytes were transfected with 4 μg of the ACAA1 overexpression plasmid (or NC plasmid) using 10 μl of FuGene HD Transfection Reagent (Promega, Madison, WI, United States) after reaching approximately 70–80% confluence in six-well plates, according to the manufacturer’s instructions. Next, the cells were incubated for 24 h, after which the liquid was exchanged for fresh medium and the cells were induced for 48 h after transfection.
siRNA-ACAA1 (20 μM) and siRNA-NC (NC) were generated by GenePharma. siRNA-NC, as an NC, showed no homology with the target gene. Preadipocytes were cultured to 80% confluency in six-well plates and transfected with 10 μl of siRNA-ACAA1 (or NC) using 5 μl of Lipofectamine 2000 (Invitrogen, Carlsbad, CA, United States) according to the manufacturer’s instructions. The cells were incubated for 8 h, transferred to fresh medium, and then induced 48 h after transfection. The small interfering RNA (siRNA) sequence information is shown in Table 1.
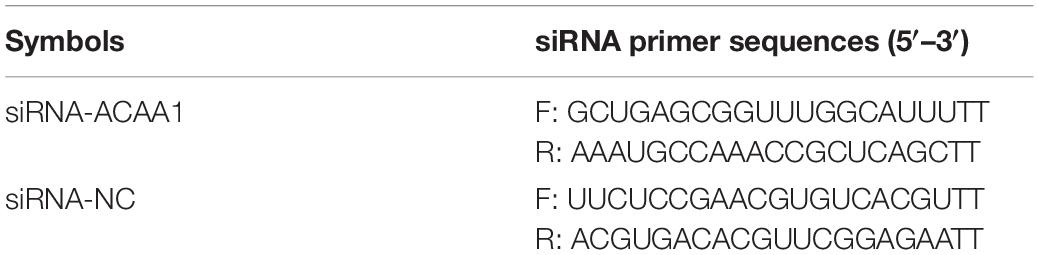
Table 1. siRNA sequences.
Quantitative Real-Time PCR Analysis
Fifteen samples from the normal differentiation period (0, 2, 4, 6, and 8 days, three repeats in each group), 18 samples from the overexpression group and the control group (0, 4, and 8 days, three repeats in the over-ACAA1 and over-NC groups), and 18 samples from the knockdown group and the control group (0, 4, and 8 days, three repeats in the siRNA-ACAA1 and siRNA-NC groups) were collected. Total RNA was isolated using TRIzol reagent (Invitrogen) and reverse transcribed to cDNA using a reverse transcription kit (TaKaRa, Shiga, Japan). Using the synthesized cDNA as a template, quantitative real-time polymerase chain reaction (qRT-PCR) was performed with a LightCycler® 480 II system (Roche) using SYBR Green I Master (Roche), with β-actin used as the internal control gene. The relative expression levels of the assayed genes were detected using the 2–ΔΔCt method (Yang et al., 2018; Yun et al., 2018). The primer information is provided in Table 2.
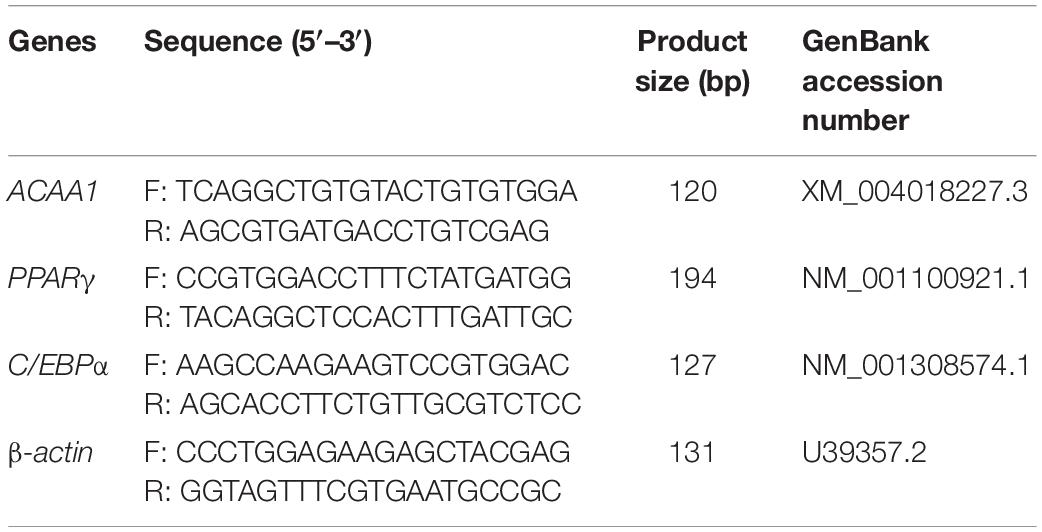
Table 2. Primers used for quantitative real-time polymerase chain reaction.
Western Blot Analysis
Fifteen samples were collected from the normal differentiation period (0, 2, 4, 6, and 8 days, three repeats in each group), 12 samples were collected from the overexpression and control groups (4 and 8 days, three repeats in the over-ACAA1 and over-NC groups), and 12 samples were collected from the knockdown and control groups (4 and 8 days, three repeats in the siRNA-ACAA1 and siRNA-NC groups). The cells were washed three times with cold PBS, lysed with a protein lysis buffer (RIPA; Thermo Fisher Scientific) containing protease inhibitors (protease and phosphatase inhibitor cocktail), and then placed on ice for 2 min. Subsequently, the lysate was collected in a 1.5-ml centrifuge tube and placed on ice. The tube was lightly mixed every 5 min; after 30 min, the soluble proteins were obtained by centrifugation at 4°C at 12,000 rpm for 15 min. The protein concentration was determined using an enhanced bicinchoninic acid (BCA) protein detection kit (Beyotime, Shanghai, China). The protein samples were denatured at 95°C for 10 min, and then 20 μg protein sample was separated by sodium dodecyl sulfate–polyacrylamide gel electrophoresis (SDS-PAGE) on a 10% gel before being transferred to polyvinylidene difluoride (PVDF) membranes (Millipore, Burlington, MA, United States). The membranes were washed for 5 min with Tris-buffered saline containing Tween (TBST) and then blocked using 5% skimmed milk at room temperature for 2 h. Subsequently, the membranes were washed three times (5 min each) with TBST and then incubated with a primary antibody overnight at 4°C on a shaker. Next, the membranes were incubated with a corresponding secondary antibody [anti-rabbit or anti-mouse IgG horseradish peroxidase (HRP)-linked, 1:2,000 dilution; Cell Signaling Technology, Danvers, MA, United States] for 90 min at room temperature. The membranes were then washed three times with TBST, after which the immunoreactive bands were visualized using a ChemiScope 6000 Touch (Clinx, Shanghai, China) with an ECL-Plus kit (Applygen) (Yun et al., 2018). The band intensities were estimated by density measurements and normalized to β-actin using Clinx Chemi analysis software. Details regarding the primary antibodies used in the present study are provided in Table 3.
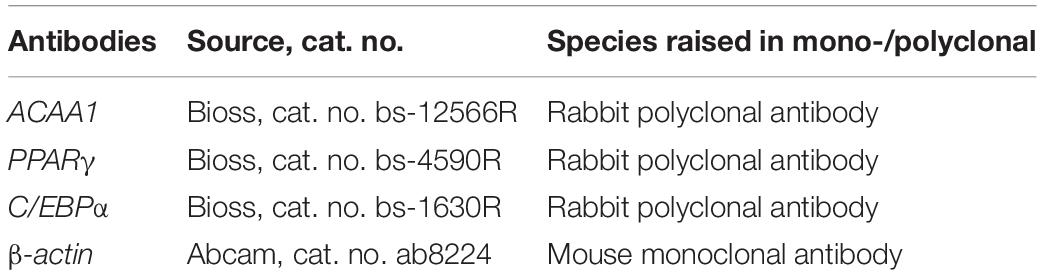
Table 3. Antibodies used for Western blot analysis.
Statistical Analysis
The qRT-PCR results were statistically analyzed using the 2–ΔΔCt method, and the gray values of the protein were analyzed using Clinx image analysis software. All the data are presented as the mean ± standard error of three independent experiments performed in triplicate. Calculations and figures were produced by one-way ANOVA using GraphPad Prism version 6.00 for Windows. The statistical significance levels were set at p < 0.05 (Yang et al., 2018).
Results
ACAA1 Expression Pattern During Sheep Preadipocyte Differentiation
We isolated and used sheep preadipocytes as a model of adipogenesis to assess the associated changes in ACAA1 expression. Sheep preadipocytes were stimulated to differentiate for 8 days using the “cocktail” method. The sheep preadipocytes exhibited obvious morphological changes after 8 days of differentiation and contained many cytoplasmic lipid droplets showing positive staining for oil red O, where typical round lipid droplets and smaller lipid droplets gathered into large lipid droplets were observed, all of which are typical characteristics of mature adipocytes (Figure 1A). The messenger RNA (mRNA) and protein levels of adipogenic markers (PPARγ and C/EBPα) were analyzed during sheep preadipocyte differentiation by qRT-PCR and Western blotting, respectively. During adipogenesis, the expression of adipogenic markers increased with the lipid accumulation in sheep adipocytes (Figures 1B,D,E), indicating that the isolated sheep preadipocytes could be used in subsequent experiments. Interestingly, the ACAA1 mRNA expression levels were significantly increased in the first 2 days of sheep adipocyte differentiation and then gradually decreased (Figure 1B), while the ACAA1 protein levels increased in the early stage of differentiation (0–4 days) before decreasing (Figure 1C). The ACAA1 mRNA and protein expression trends were similar to those observed for the adipogenic marker C/EBPα. Adipogenesis involves the dynamic regulation of gene expression, and these results suggest that ACAA1 may be involved in regulating sheep preadipocyte differentiation.
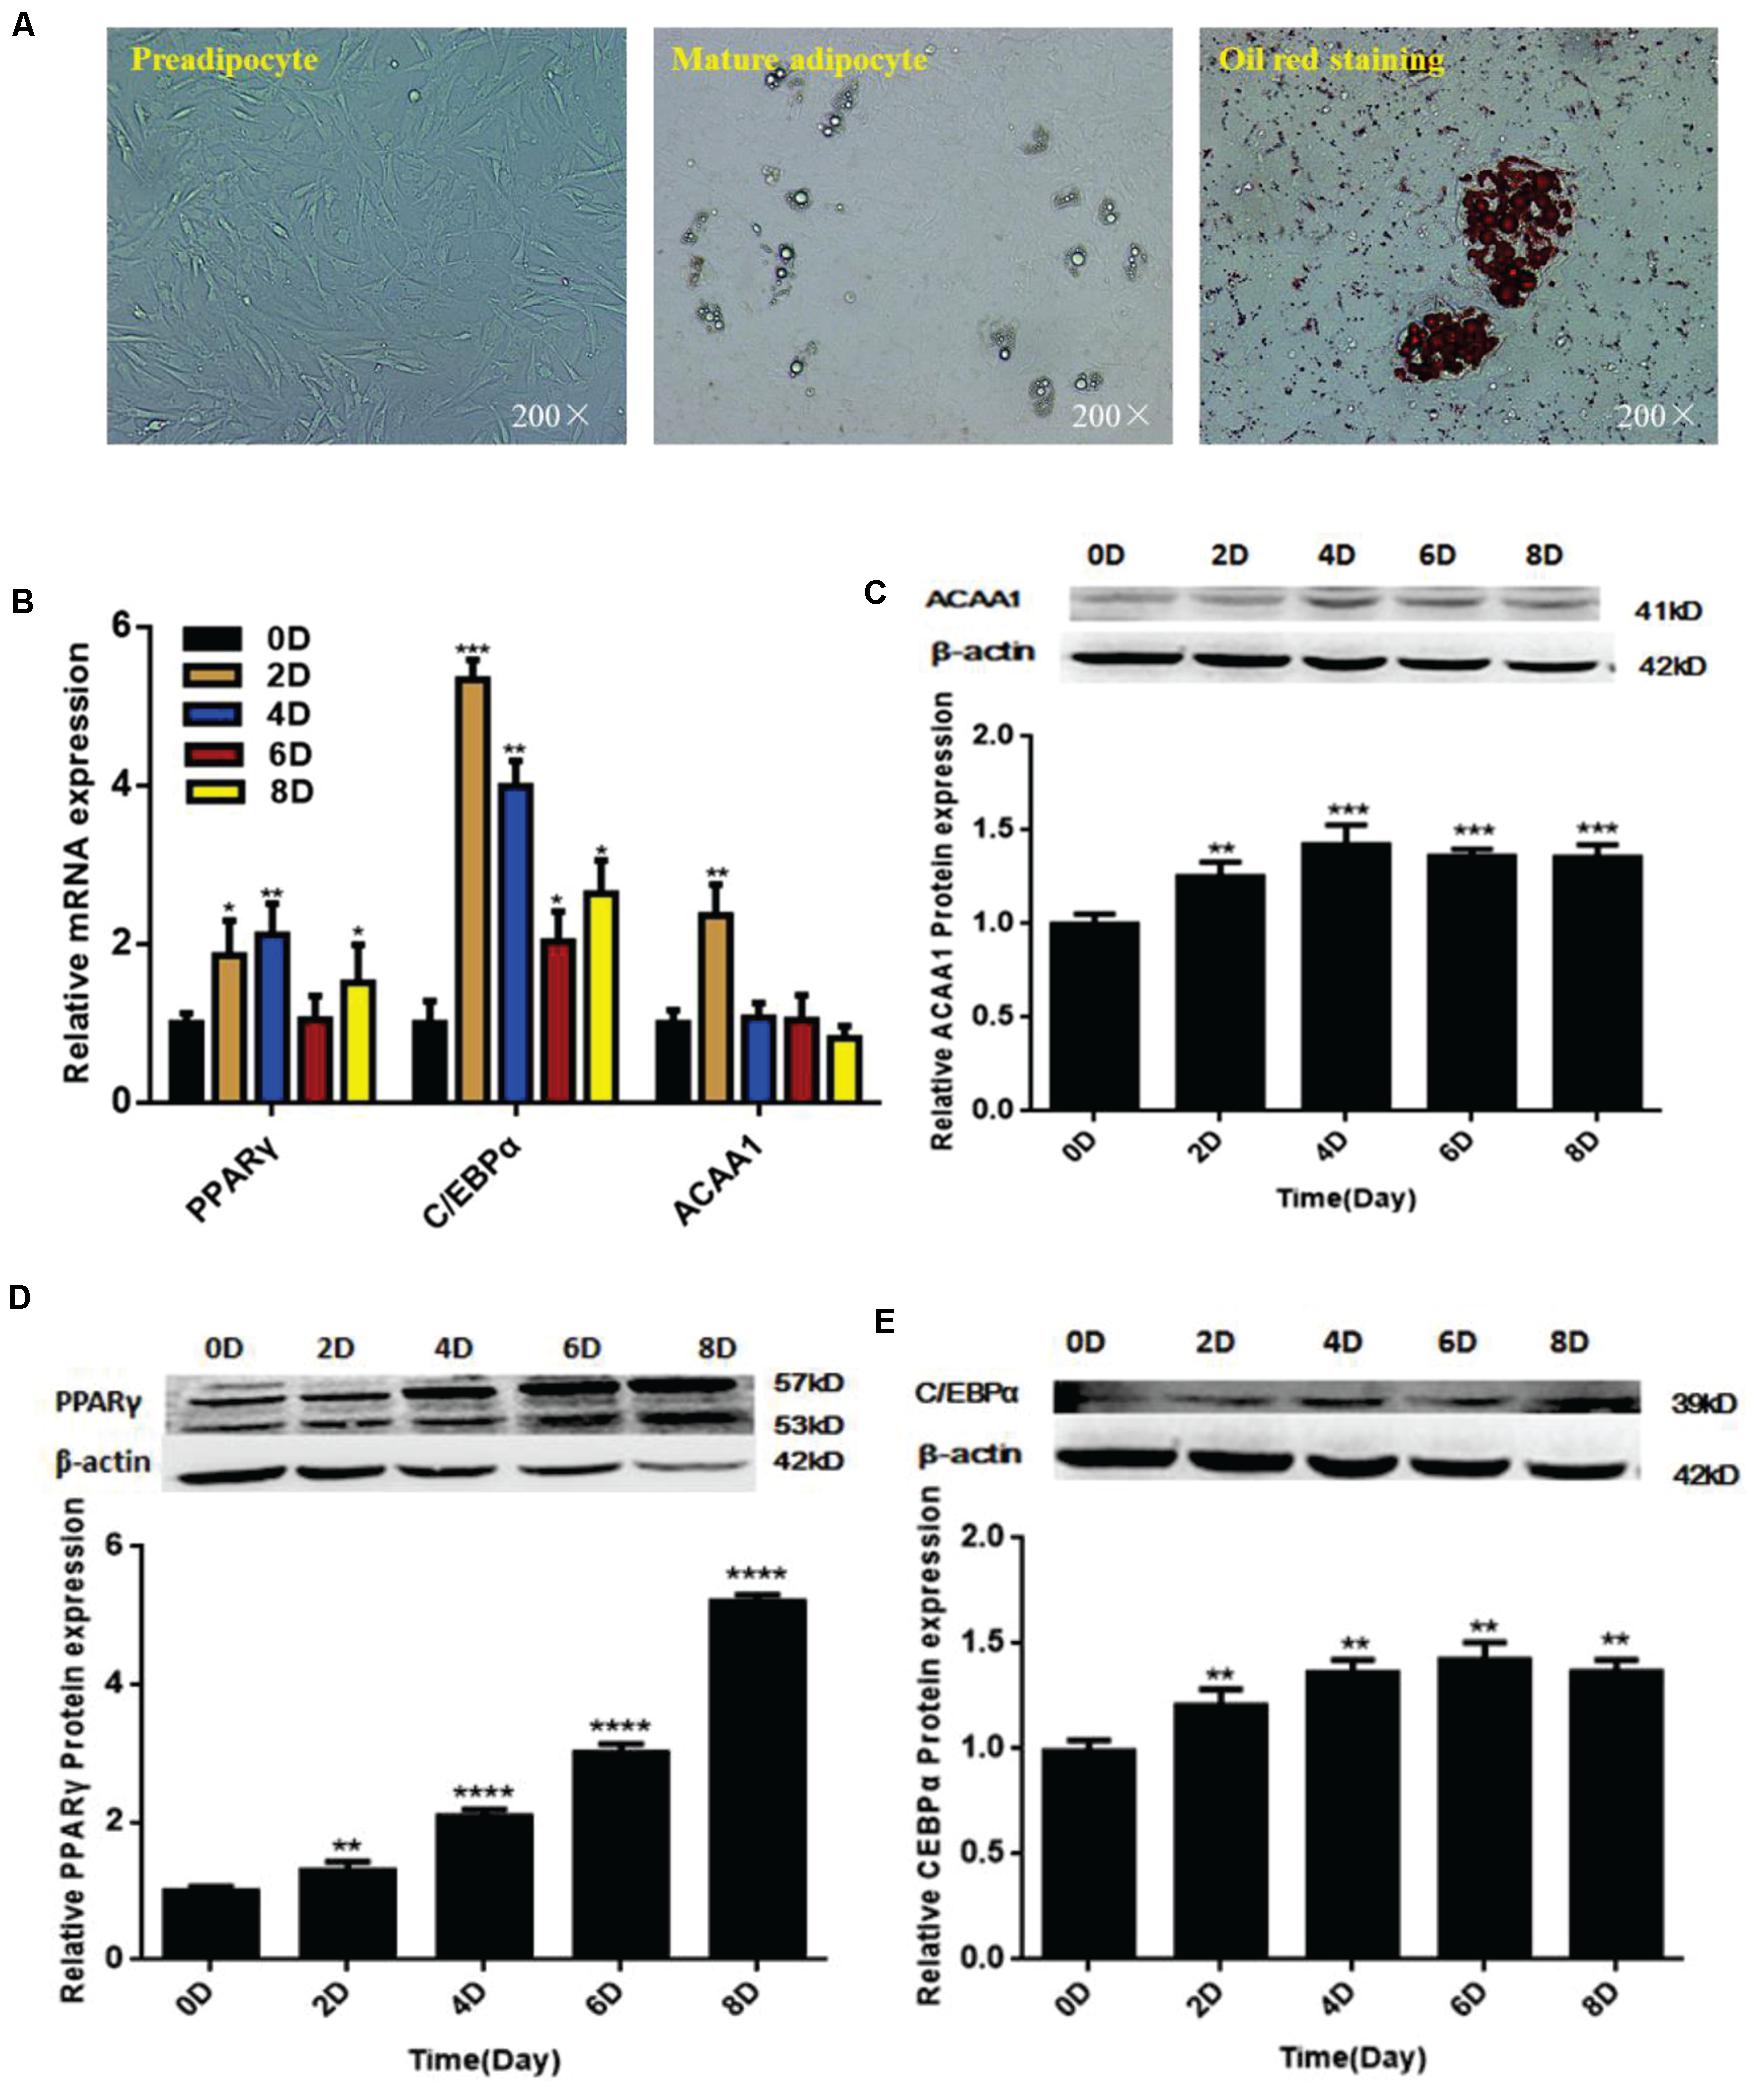
Figure 1. ACAA1 and adipogenic marker gene expression during sheep preadipocyte differentiation. (A) Sheep preadipocytes, mature adipocytes, and oil red O staining (200×). (B) Expression patterns of adipogenic marker genes (PPARγ and C/EBPα) in differentiating sheep adipocytes. (C) ACAA1 protein expression in differentiating sheep adipocytes was determined by Western blot analysis. (D,E) The protein expression levels of PPARγ and C/EBPα during adipocyte differentiation were evaluated on days 0, 2, 4, 6, and 8. Densitometric analyses of the Western blots. With the differentiation of cells, the expression levels of adipogenic genes gradually increased (*p < 0.05, **p < 0.01, ***p < 0.001, and ****p < 0.0001). ACAA1, acetyl-CoA acyltransferase 1; PPARγ, peroxisome proliferator-activated receptor γ; C/EBPα, CCAAT/enhancer binding protein α.
ACAA1 Knockdown Promotes Preadipocyte Differentiation
ACAA1 Knockdown Increases Lipid Accumulation and the Triglyceride Content
To assess whether ACAA1 affects sheep preadipocyte differentiation, we knocked down ACAA1 expression in sheep preadipocytes by transfecting siRNA-ACAA1 or siRNA-NC into sheep preadipocytes cultured to 80% confluency. The ACAA1 mRNA and protein expression levels in the knockdown group were markedly downregulated compared with those in the NC group (p < 0.01; Figures 2A,C, 3B). Oil red O staining and lipid droplet extraction analyses demonstrated that more lipids accumulated in adipocytes from the ACAA1 knockdown group than from the NC group (p < 0.01; Figures 2B,E), and the triglyceride content of the knockdown group was also significantly greater (p < 0.01; Figure 2D).
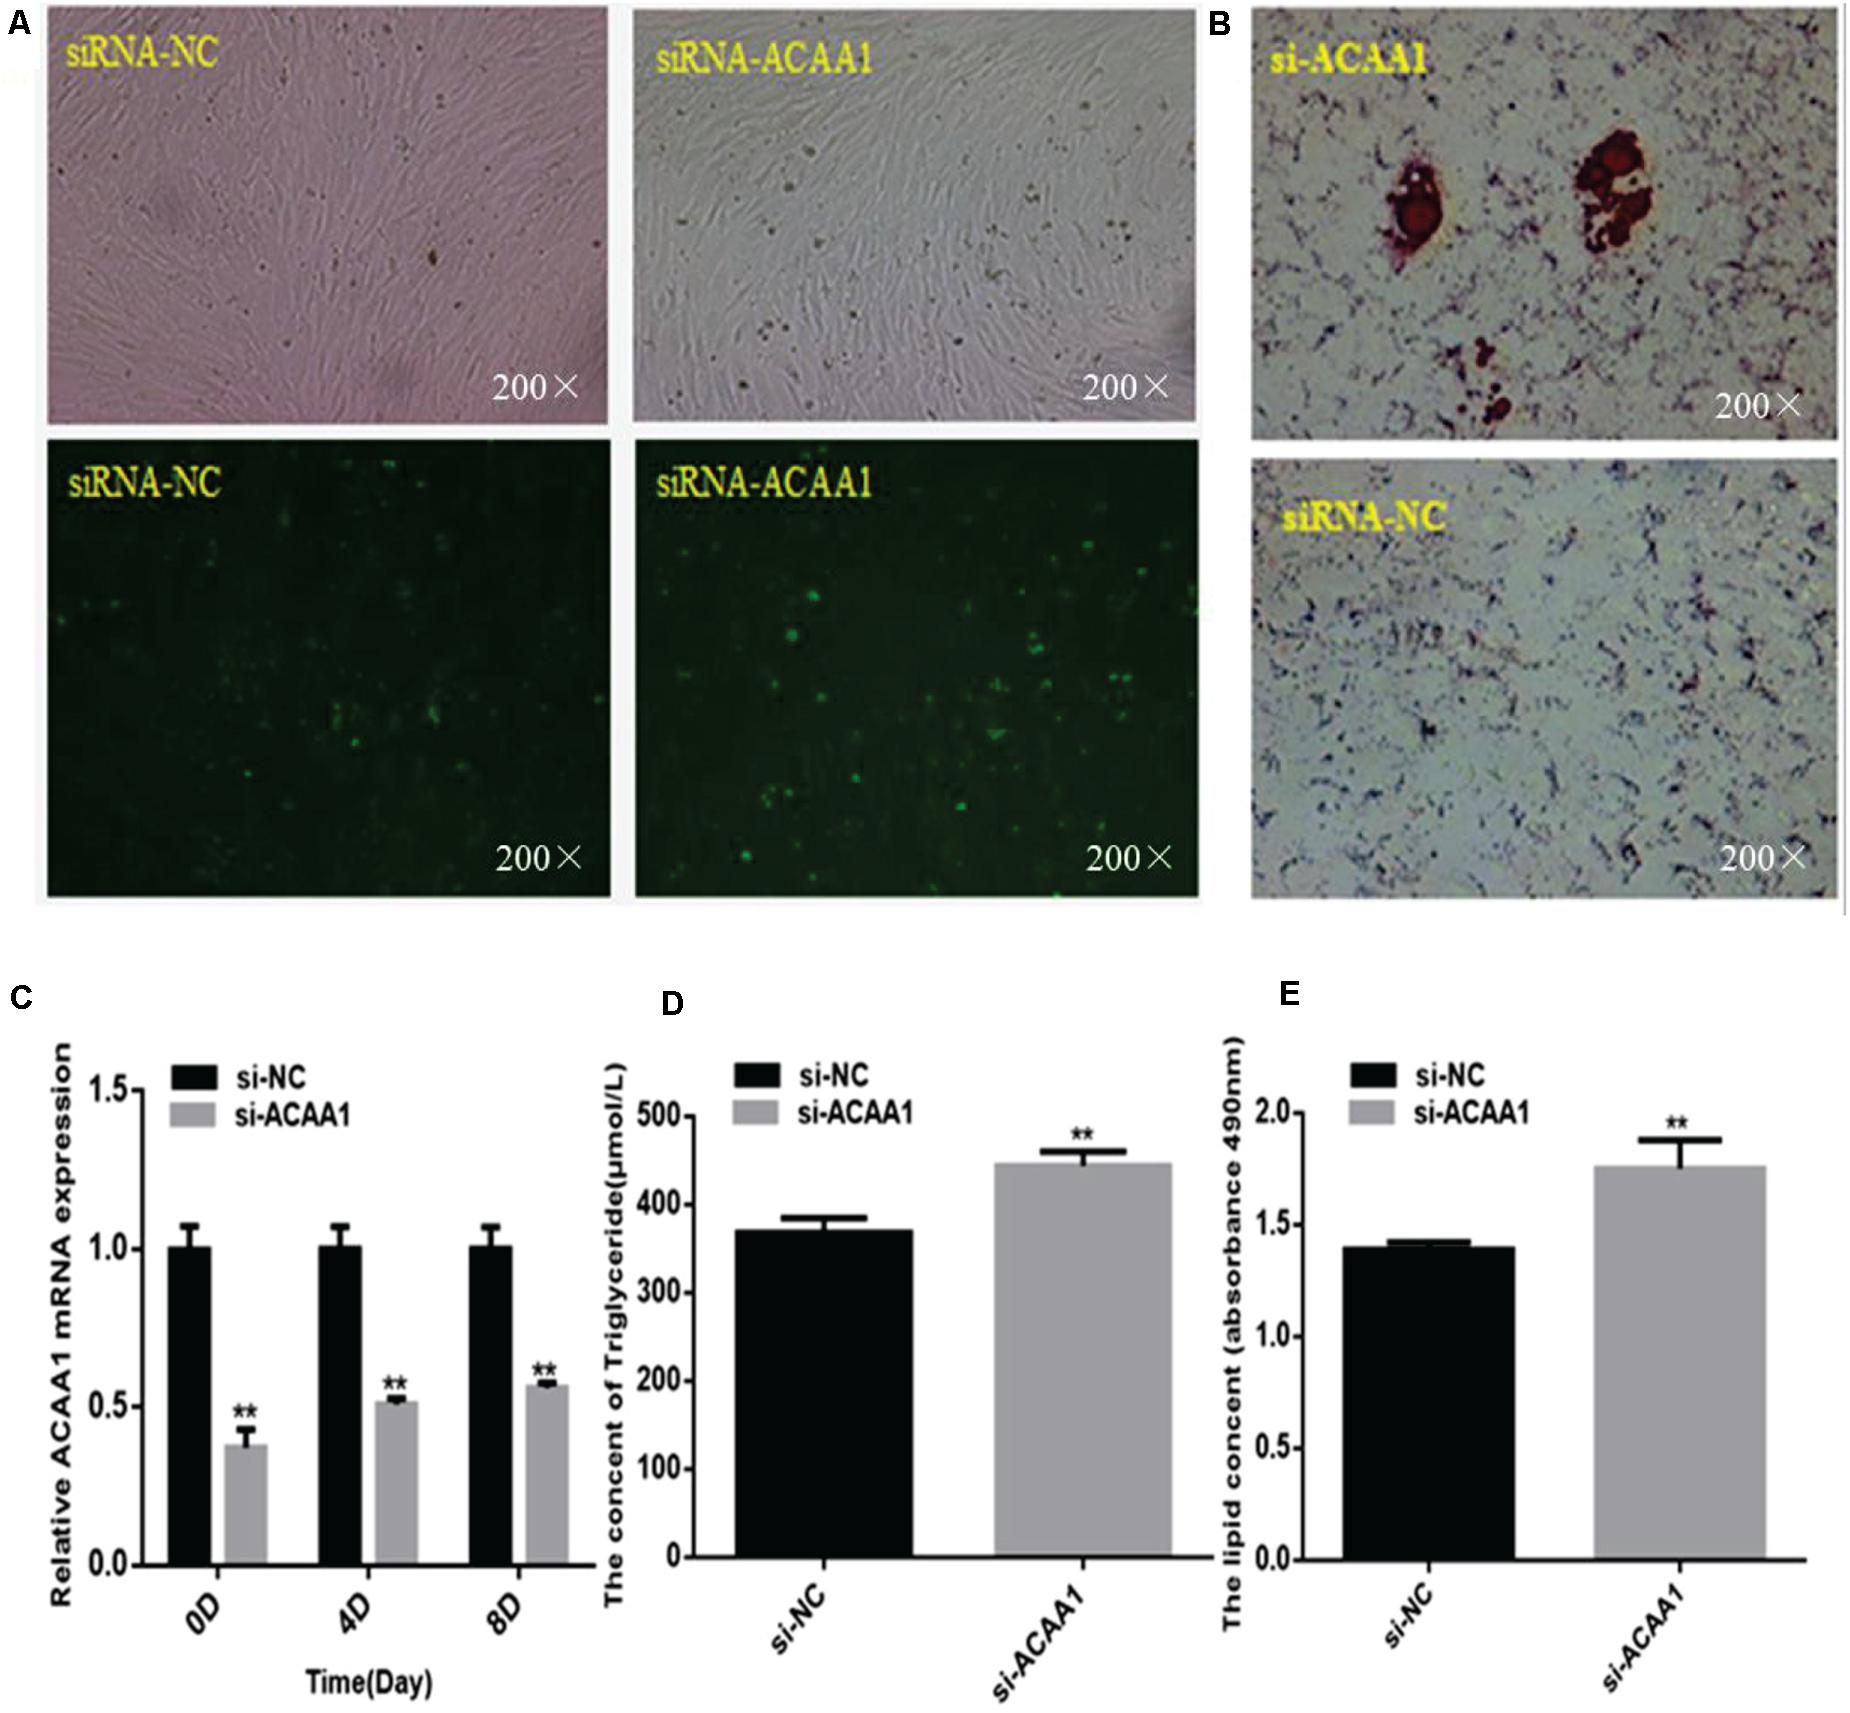
Figure 2. ACAA1 knockdown increases lipid accumulation and the triglyceride content during sheep preadipocyte differentiation. (A) Determination of the transfection efficiency of siRNA-ACAA1 (200×). (B) After 8 days of differentiation, the cellular lipid droplets were stained with oil red O (200×). (C) ACAA1 mRNA expression was detected after siRNA-ACAA1 or NC transfection on days 0, 4, and 8 of adipogenic differentiation. The siRNA-ACAA1 groups all showed significantly lower expressions than the control group (**p < 0.01). (D) The triglyceride content after 8 days of induction in the siRNA-ACAA1 group was significantly higher than that in the control group (**p < 0.01). (E) The lipid droplet content measured at 490 nm after 8 days of induction was significantly higher in the siRNA-ACAA1 group than that in the control group (**p < 0.01). siRNA, small interfering RNA; NC, negative control.
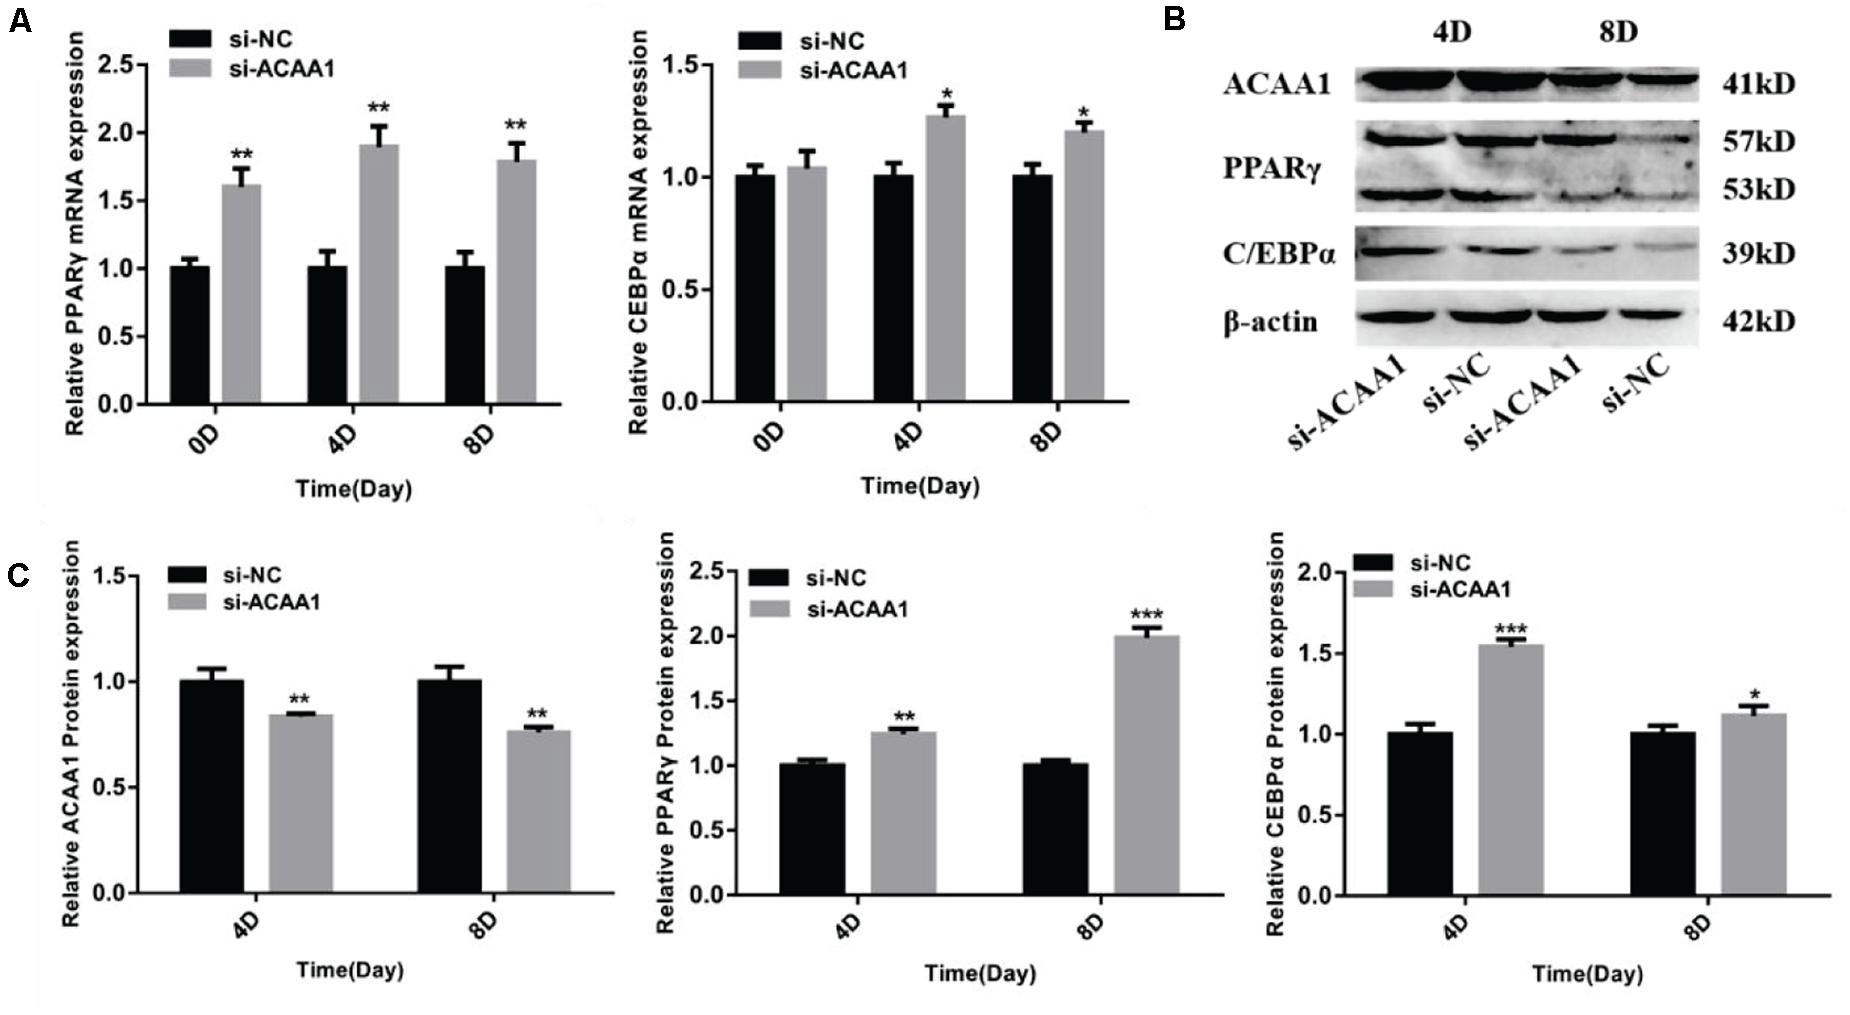
Figure 3. ACAA1 knockdown regulates adipogenic marker gene expression. (A) Sheep preadipocytes were transfected with siRNA-ACAA1 or siRNA-NC and differentiated into mature adipocytes. The mRNA expression levels of adipogenic marker genes (PPARγ and C/EBPα) were evaluated on days 0 (after cell amalgamation), 4, and 8 of adipogenic differentiation. On day 0 of adipogenic differentiation, the mRNA expression levels of the marker genes were higher than those of the control group, but only PPARγ reached a significant level (**p < 0.01). On days 4 and 8 of adipogenic differentiation, the mRNA expression levels of PPARγ and C/EBPα were significantly higher than those of the control group (*p < 0.05 and **p < 0.01). (B) Protein expression levels of ACAA1 and adipogenic marker genes on days 4 and 8 of adipogenic differentiation. Columns 1 and 2 are the siRNA-ACAA1 processing group and the siRNA-NC processing group, respectively (day 4). Columns 3 and 4 are the siRNA-ACAA1 processing group and the siRNA-NC processing group, respectively (day 8). β-actin is the internal reference gene. (C) The protein expression levels of ACAA1 and adipogenic marker genes were assessed on days 4 and 8 of adipogenic differentiation. The protein expression levels of ACAA1 were significantly lower than those of the control group (**p < 0.01), and the protein expression levels of PPARγ and C/EBPα were significantly higher than those of the control group (*p < 0.05, **p < 0.01, and ***p < 0.001). NC, negative control.
ACAA1 Knockdown Enhances Adipogenic Marker Gene Expression
The mRNA expression levels of adipogenic marker genes (including PPARγ and C/EBPα) involved in differentiation were measured on days 0, 4, and 8 after induction (Figure 3A), while the protein expression levels were measured 4 and 8 days later (Figure 3B). The mRNA expressions of the adipogenic marker genes were upregulated following ACAA1 knockdown (p < 0.05 and p < 0.01; Figure 3A), while the PPARγ and C/EBPα protein expressions were significantly increased by ACAA1 deficiency (p < 0.05, p < 0.01, and p < 0.001; Figure 3C). Thus, the ACAA1 gene may be a negative regulator of adipogenic differentiation.
ACAA1 Overexpression Inhibits Preadipocyte Differentiation
ACAA1 Overexpression Decreases Preadipocyte Lipid Accumulation and the Triglyceride Content
The effects of ACAA1 overexpression on sheep preadipocyte differentiation were evaluated. The ACAA1 mRNA and protein expression levels in the overexpression group were significantly higher than those in the NC group (p < 0.01; Figures 4A,C, 5B). Oil red O staining and lipid droplet extraction revealed that ACAA1 overexpression significantly inhibited preadipocyte differentiation and lipid accumulation in sheep adipocytes (p < 0.01; Figures 4B,E). Additionally, the triglyceride content in the overexpression group was significantly lower than that in the NC group (p < 0.01; Figure 4D).
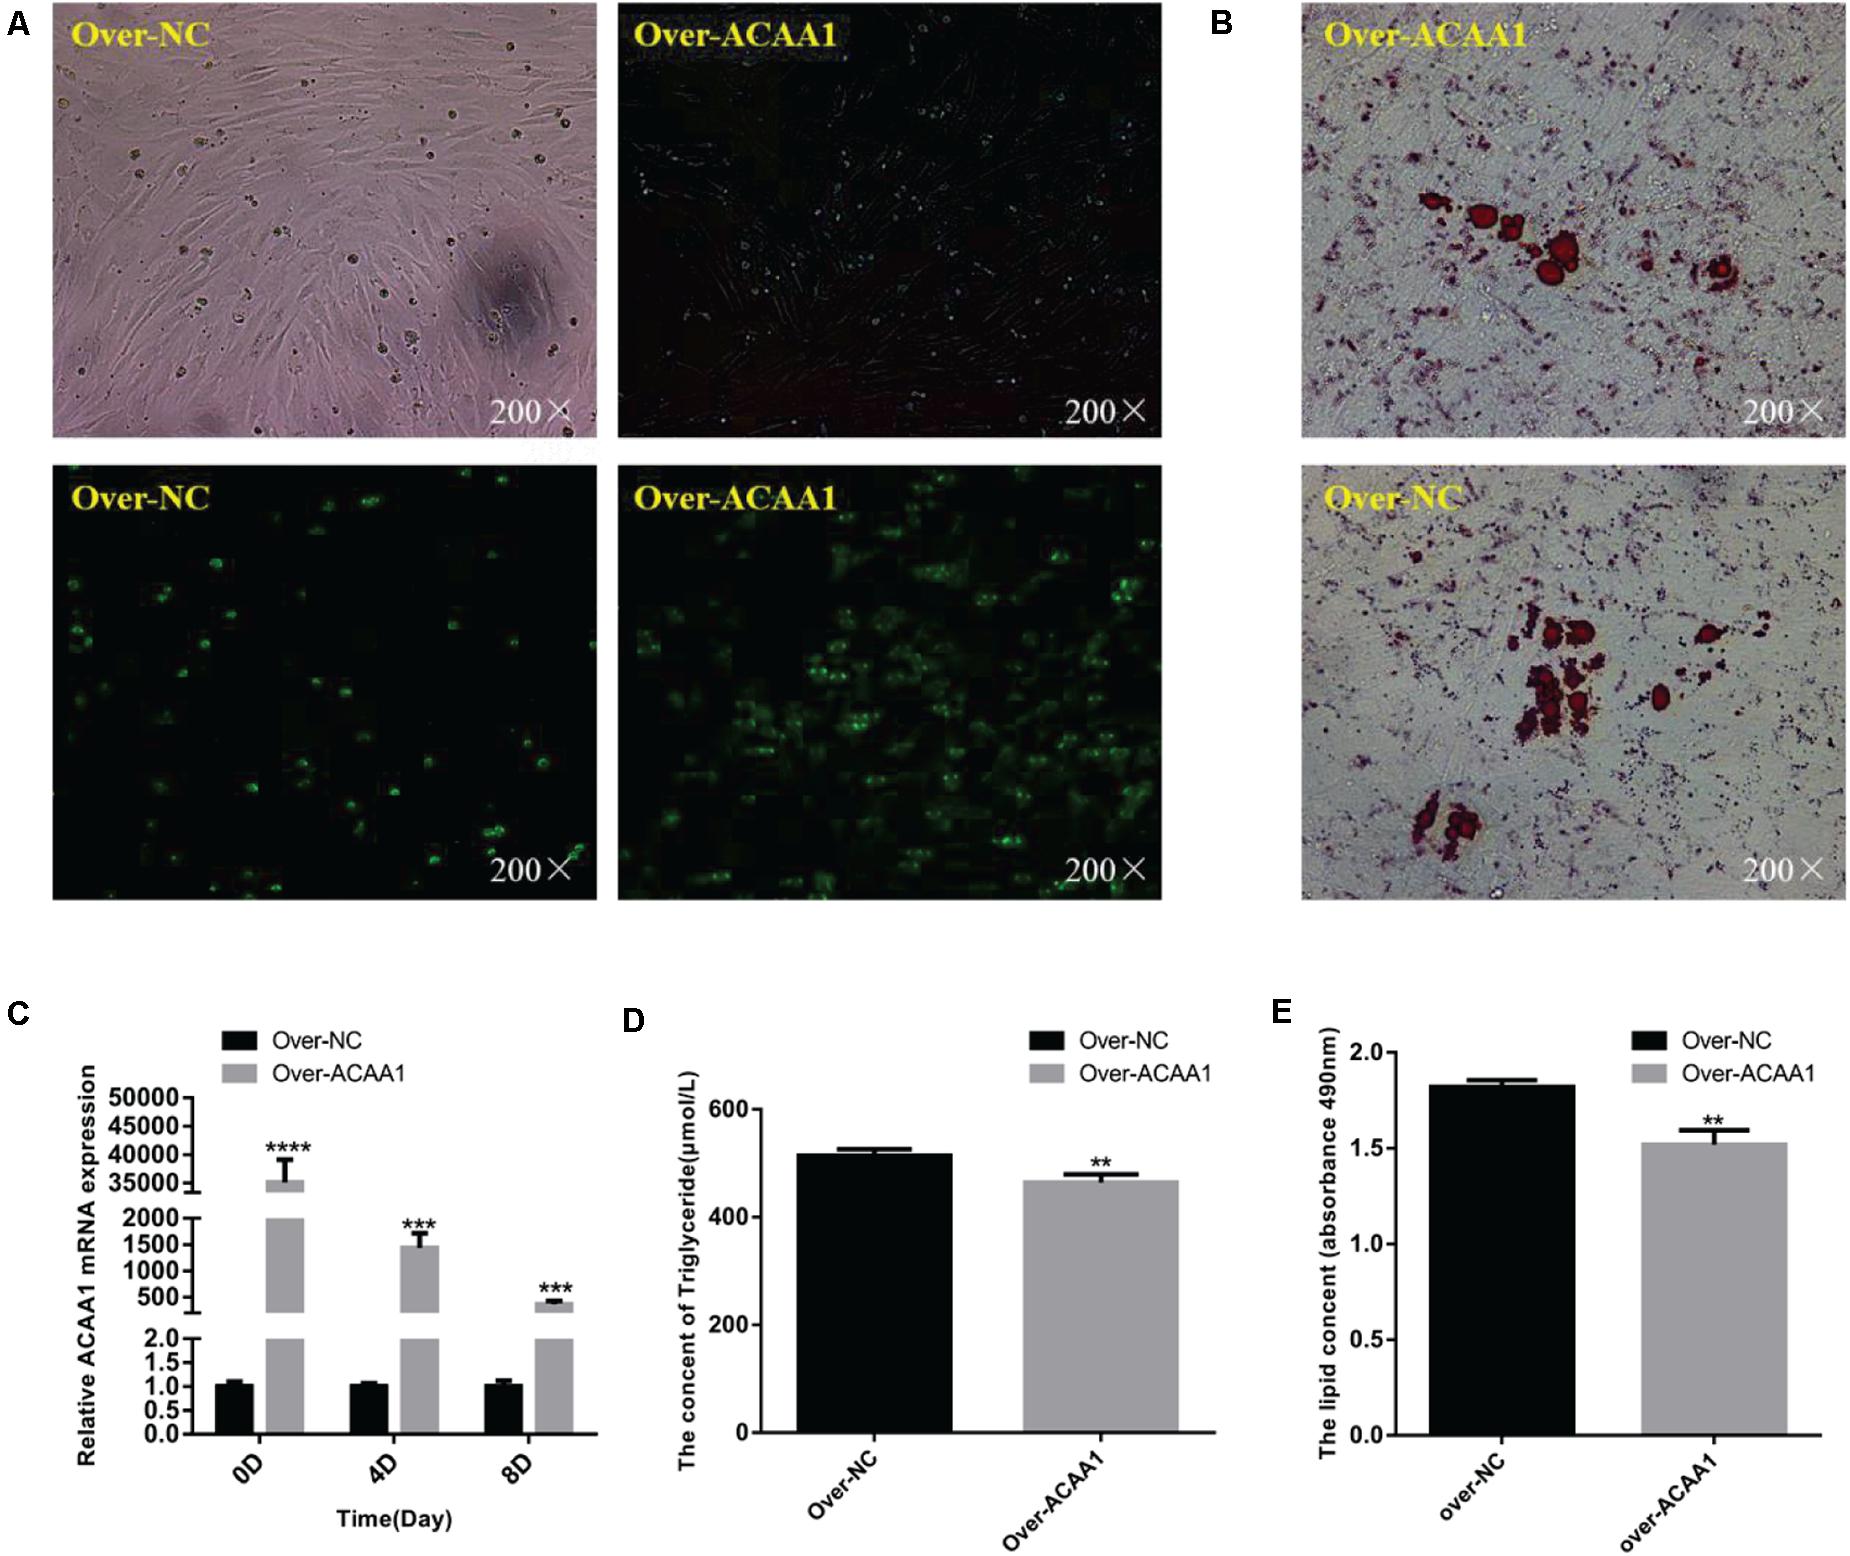
Figure 4. ACAA1 overexpression decreases lipid accumulation and the triglyceride content in preadipocytes. (A) Determination of the transfection efficiency of the ACAA1 overexpression plasmid (200×). (B) After 8 days of differentiation, the cellular lipid droplets were stained with oil red O (200×). (C) ACAA1 mRNA expression was assessed after cells were transfected with the ACAA1 overexpression or the NC plasmids on days 0, 4, and 8 of adipogenic differentiation. The expression in the over-ACAA1 group was significantly higher than that in the control group (****p < 0.01 and ***p < 0.001). The difference was largest in the early stage of cell differentiation. (D) After 8 days of induction, the triglyceride content in the over-ACAA1 group was significantly lower than that in the control group (**p < 0.01). (E) The lipid droplet content measured at 490 nm after 8 days of induction in the over-ACAA1 group was significantly lower than that in the control group (**p < 0.01).
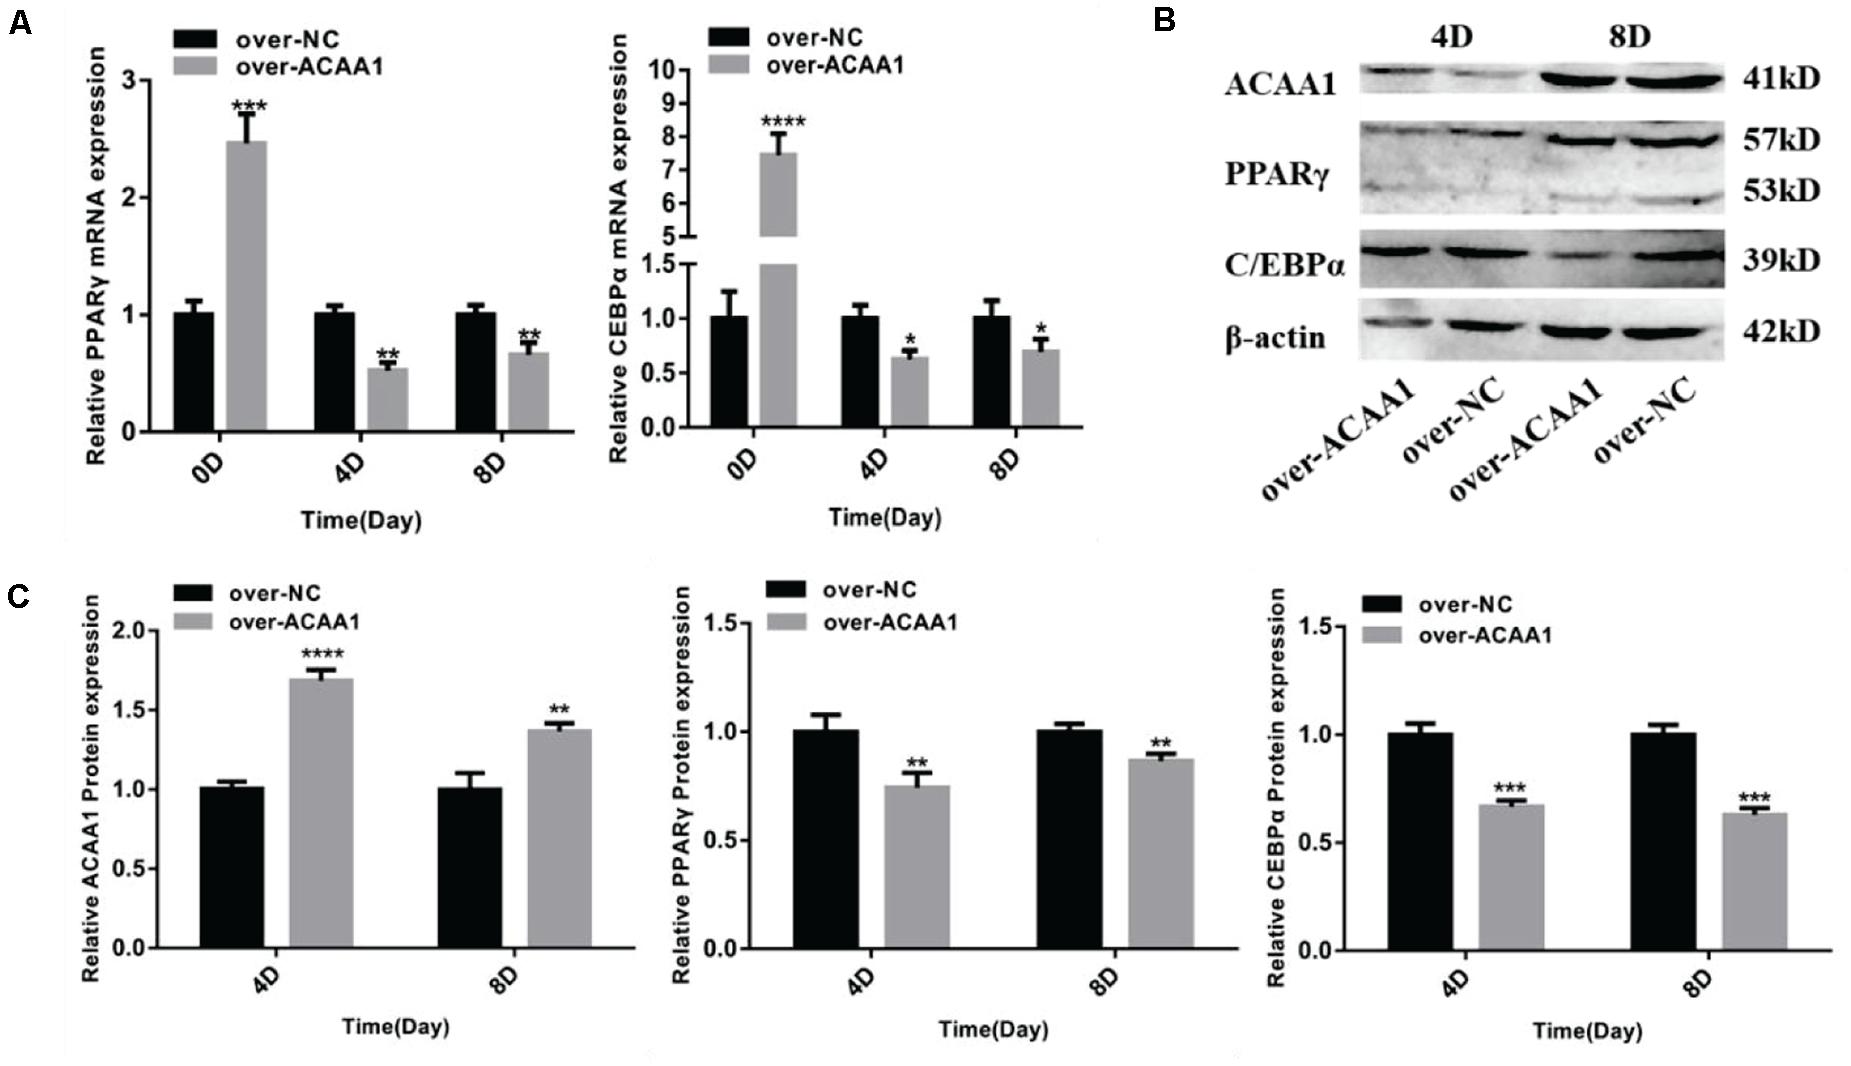
Figure 5. ACAA1 overexpression regulates adipogenic marker gene expression. (A) Sheep preadipocytes were transfected with ACAA1 overexpression or negative control (NC) plasmids and differentiated into mature adipocytes. The mRNA expression levels of adipogenic marker genes (PPARγ and C/EBPα) were measured on days 0, 4, and 8 of adipogenic differentiation. Except day 0, the mRNA expression levels of PPARγ and C/EBPα were significantly lower than those of the control group (*p < 0.05, **p < 0.01, ***p < 0.001, and ****p < 0.0001). (B) Protein expression levels of ACAA1 and adipogenic marker genes on days 4 and 8 of adipogenic differentiation. Columns 1 and 2 are the over-ACAA1 processing and over-NC processing groups, respectively (day 4). Columns 3 and 4 are the over-ACAA1 processing and over-NC processing groups, respectively (day 8). β-actin is the internal reference gene. (C) The protein expression levels of ACAA1 and adipogenic marker genes were assessed on days 4 and 8 of adipogenic differentiation. The protein expression levels of ACAA1 were significantly higher than those of the control group (****p < 0.0001 and **p < 0.01), and the protein expression levels of PPARγ and C/EBPα were significantly lower than those of the control group (**p < 0.01 and ***p < 0.001).
ACAA1 Overexpression Decreases Adipogenic Marker Gene Expression
ACAA1 overexpression remarkably downregulated the mRNA levels of the adipogenic marker genes PPARγ and C/EBPα on days 4 and 8 (p < 0.05, p < 0.01, p < 0.001, and p < 0.0001; Figure 5A). Consistent with these findings, Western blotting showed that ACAA1 overexpression significantly decreased the protein levels of these adipogenic marker genes (p < 0.01 and p < 0.001; Figures 5B,C).
Discussion
A strong correlation exists between the fat content and meat quality in animals, which can affect the sensory indexes of meat, such as tenderness, color, flavor, and nutritional value (Huan-Hsien, 2011). As one determinant of meat quality, fat content has become a research hotspot for livestock and poultry meat quality in recent years. However, presently, studies on the regulation of fat development and deposition have primarily focused on pigs (Zou et al., 2018), cattle (Park et al., 2018), and chickens (Fu et al., 2018), whereas such studies in sheep have been lacking.
Mammalian adipogenesis is a complicated physiological process involving the expressions of multiple genes, signal transduction pathways, and network regulation to balance the proliferation and differentiation of preadipocytes (Gesta et al., 2007). The ACAA1 gene encodes a thiolytic enzyme that cleaves peroxisomal 3-ketoacyl-CoA into acetyl-CoA and acyl-CoA, which participate in the extension and degradation of fatty acids. ACAA1 is an important regulatory gene involved in cell lipid metabolism (Wanders et al., 2001) and is a target of biotherapy for human metabolic diseases (Colas et al., 2011; Park et al., 2012; Klimosch et al., 2013; Liu et al., 2015; Nwosu et al., 2018; Zhang et al., 2019). In a previous study, we investigated the transcriptome characteristics associated with the intramuscular fat content of the sheep longissimus dorsi muscle and observed significant differences in the transcriptional levels of ACAA1, which is associated with members of the PPAR signaling and fatty acid metabolism signaling pathways involved in fat deposition in sheep. Therefore, we speculated that ACAA1 may be involved in fat deposition by regulating lipid metabolism.
In the present study, we analyzed the pattern of ACAA1 gene expression during the differentiation of cultured sheep preadipocytes, and the results suggest that ACAA1 may be a functional regulator of sheep fat deposition. Several studies have demonstrated that ACAA1 plays an important role in animal lipid metabolism (Lisowski et al., 2014; Zhang and Wang, 2015; Zhu et al., 2016). For example, ACAA1 gene upregulation is involved in fatty acid biosynthesis and lipid metabolism in beef cattle (Lisowski et al., 2014), as well as increased liver triglyceride metabolism, lipid decomposition, and fatty acid oxidation in mice fed a high-fat diet, which can reduce intestinal lipid absorption (Zhu et al., 2016). In the present study, to investigate the potential function of ACAA1 in sheep preadipocyte differentiation, we assessed the effects of ACAA1 knockdown and overexpression in sheep preadipocytes. After induction, we observed that ACAA1 deficiency increased lipid accumulation and the triglyceride content and promoted adipogenesis. These results are consistent with those reported for chicken intramuscular preadipocytes, in which the inhibition of ACAA1 gene expression in fatty acid peroxisomes was shown to promote the deposition of intramuscular fat in chickens (Li et al., 2019). However, ACAA1 overexpression inhibits adipogenesis and decreases lipid accumulation and the triglyceride content. The upregulation of ACAA1 expression has been shown to reduce the intramuscular fat content in the longissimus dorsi of large white pigs (Yao, 2020). These results were consistent with previous findings (Xie et al., 2014; Zhang and Wang, 2015; Zhu et al., 2016). ACAA1 gene upregulation enhanced fatty acid β-oxidation and triglyceride metabolism in the liver and decreased lipid accumulation in animals (Zhang and Wang, 2015). As a key enzyme of lipid metabolism, ACAA1 may promote fatty acid metabolism and fatty acid degradation by participating in the β-oxidation of very long-chain fatty acids, affecting the function of fat metabolism in obese rats to achieve fat reduction and weight reduction (Meng, 2020). Fenofibrate (FB) significantly reduced abdominal fat and liver lipid accumulation in mice fed a high-fat diet by increasing ACAA1 mRNA expression (Xie et al., 2014). Taken together, these results suggest that ACAA1 may be a negative regulator of sheep preadipocyte differentiation and plays a crucial role in sheep fat deposition.
We found that ACAA1 deficiency upregulates the expression of the adipogenic marker genes PPARγ and C/EBPα in sheep preadipocytes, but ACAA1 overexpression inhibits PPARγ and C/EBPα expressions. Interestingly, the mRNA levels of these adipogenic marker genes on day 0 were significantly higher in the ACAA1 overexpression group than those in the NC group, possibly because of a transcriptional delay effect for the different genes. PPARG is a key transcription factor in adipogenesis involved in maintaining the function of mature adipocytes (Imai et al., 2004; Schupp et al., 2009). The ACAA1 gene is a downstream target gene of PPAR and is controlled by this regulator (Lake, 1995). In the PPAR signaling pathway, fatty acids serve as ligands that promote PPAR expression. PPAR activation can upregulate the expressions of downstream genes such as ACAA1, ACOX1, and CPT-1 and stimulate fatty acid oxidation. Additionally, adipogenic gene upregulation resulting from PPAR activation can promote adipocyte differentiation (Li et al., 2019). ACAA1 is closely related to the intramuscular fat content in pigs (Wu et al., 2013). The expression of ACAA1 gene is regulated by the activation of the PPAR signaling pathway, which affects fat deposition and the intramuscular fat content in pigs (Yao, 2020). Based on previous study findings and those described herein, we hypothesize that the possible molecular mechanisms involved in preadipocyte differentiation are as follows. ACAA1 knockdown reduces the oxidation of fatty acids in the PPAR signaling pathway, increasing the contents of saturated and unsaturated fatty acids in sheep adipocytes. The accumulated fatty acids further stimulate the transcriptional activity of PPAR, after which the expressions of downstream adipogenic genes become upregulated, promoting the differentiation of sheep preadipocytes.
In summary, our results suggest that ACAA1 may be a transcriptional regulator of PPARγ and C/EBPα because of its ability to affect sheep preadipocyte differentiation. ACAA1 deficiency promoted adipogenesis and lipid accumulation, while ACAA1 overexpression inhibited sheep preadipocyte differentiation. These findings provide new molecular insights for further studies on the role of ACAA1 in regulating fat metabolism and improving meat quality in sheep. However, further research is needed to elucidate the specific mechanism of ACAA1 in regulating adipogenesis. There is still a long way to go for molecular breeding as a functional gene.
Data Availability Statement
The raw data supporting the conclusions of this article will be made available by the authors, without undue reservation.
Ethics Statement
The animal study was reviewed and approved by the Animal Welfare and Ethics Committee of Jilin Academy of Agricultural Sciences.
Author Contributions
YC (seventh author) designed the study. YW, XL, and YC (third author) performed the experiments. CX, YL, and YW analyzed the data. YW wrote the manuscript. HJ and YC (seventh author) corrected and approved the final version of the manuscript. All authors participated in the revision of the manuscript.
Funding
This study was supported by the National Natural Science Foundation of Jilin Province (20190201161JC) and China Agriculture Research System of MOF and MARA (CARS38).
Conflict of Interest
The authors declare that the research was conducted in the absence of any commercial or financial relationships that could be construed as a potential conflict of interest.
Supplementary Material
The Supplementary Material for this article can be found online at: https://www.frontiersin.org/articles/10.3389/fgene.2021.649140/full#supplementary-material
References
Cao, Y. (2017). Comparative Analysis of Whole Genome Methylation and Transcriptome of the Longissimus Dorsi Muscle of Du Han and Small–Tail Han Sheep. Changchun: Jilin University.
Church, C. D., Berry, R., and Rodeheffer, M. S. (2014). Isolation and study of adipocyte precursors. Methods Enzymol. 537, 31–46.
Colas, E., Perez, C., and Cabrera, S. (2011). Molecular markers of endometrial carcinoma detected in uterine aspirates. Int. J. Cancer. 129, 2435–2444. doi: 10.1002/ijc.25901
Fang, X. B. (2017). Identification and Functional Verification of Candidate Genes for Beef Quality Traits Based on Transcriptome and Genome-Wide Methylation Analysis. Changchun: Jilin University.
Fu, S., Zhao, Y., Li, Y., Li, G., Chen, Y., Li, Z., et al. (2018). Characterization of miRNA transcriptome profiles related to breast muscle development and intramuscular fat deposition in chickens. J. Cell. Biochem. 119, 7063–7079.
Galic, S., Oakhill, J. S., and Steinberg, G. R. (2010). Adipose tissue as an endocrine organ. Mol. Cell. Endocrinol. 316, 129–139.
Gesta, S., Tseng, Y. H., and Kahn, C. R. (2007). Developmental origin of fat: tracking obesity to its source. Cell 131, 242–256. doi: 10.1016/j.cell.2007.10.004
Huan-Hsien, C. (2011). Study on Molecular Regulatory Network and Related Genes of Intramuscular Fat Formation in Broilers. Beijing: Chinese Academy of Agricultural Sciences.
Imai, T., Takakuwa, R., Marchand, S., Dentz, E., Bornert, J. M., Messaddeq, N., et al. (2004). Peroxisome proliferator-activated receptor gamma is required in mature white and brown adipocytes for their survival in the mouse. Proc. Natl. Acad. Sci. U.S.A. 101, 4543–4547. doi: 10.1073/pnas.0400356101
Klimosch, S. N., Forstin, A., and Eckert, J. (2013). Functional TLR5 genetic variants affect human colorectal cancer survival. Cancer Res. 73, 7232–7242. doi: 10.1158/0008-5472.can-13-1746
Lake, B. G. (1995). Mechanisms of hepatocarcinogenicity of peroxisome-proliferating drugs and chemicals. Annu. Rev. Pharmacol. Toxicol. 35, 483–507. doi: 10.1146/annurev.pa.35.040195.002411
Li, G., Fu, S., Chen, Y., Jin, W., Zhai, B., Li, Y., et al. (2019). MicroRNA-15a regulates the differentiation of intramuscular preadipocytes by targeting ACAA1. ACOX1 and SCP2 in Chickens. Int. J. Mol. Sci. 20:4063. doi: 10.3390/ijms20164063
Li, W. J. (2008). Screening and High-spirited Regulation of functional genes of Chicken related Fat Metabolism. Beijing: Chinese Academy of Agricultural Sciences.
Lisowski, P., Kościuczuk, E. M., Gościk, J., Pierzchała, M., Rowińska, B., and Zwierzchowski, L. (2014). Hepatic transcriptome profiling identifies differences in expression of genes associated with changes in metabolism and postnatal growth between Hereford and Holstein-Friesian bulls. Anim. Genet. 45, 288–292. doi: 10.1111/age.12116
Liu, F., Li, H., Chang, H., Wang, J., and Lu, J. (2015). Identification of hepatocellular carcinoma-associated hub genes and pathways by integrated microarray analysis. Tumori 101, 206–214. doi: 10.5301/tj.5000241
Meng, Y. (2020). Effects of Hypoxic Training on Liver Lipid Metabolism Related Genes and Serum Exocrine in Obese Rats. Shandong: Qufu Normal University.
Nwosu, Z. C., Battello, N., and Rothley, M. (2018). Liver cancer cell lines distinctly mimic the metabolic gene expression pattern of the corresponding human tumours. J. Exp. Clin. Cancer Res. 37:211.
Park, S. J., Beak, S. H., Jung, D. J. S., Kim, S. Y., Jeong, I. H., Piao, M. Y., et al. (2018). Genetic, management, and nutritional factors affecting intramuscular fat deposition in beef cattle - A review. Asian-Australas J. Anim. Sci. 31, 1043–1061. doi: 10.5713/ajas.18.0310
Park, S. K., Yang, J. J., Oh, S., Cho, L. Y., Ma, S. H., Shin, A., et al. (2012). Innate immunity and non-Hodgkin’s lymphoma (NHL) related genes in a nested case-control study for gastric cancer risk. PLoS One 7:e45274. doi: 10.1371/journal.pone.0045274
Ramírezzacarías, J. L., Castromuñozledo, F., and Kuriharcuch, W. (1992). Quantitation of adipose conversion and triglycerides by staining intracytoplasmic lipids with oil red O. Histochemistry 97, 493–497. doi: 10.1007/bf00316069
Schupp, M., Cristancho, A. G., and Lefterova, M. I. (2009). Re-expression of GATA2 cooperates with peroxisome proliferator-activated receptor-gamma depletion to revert the adipocyte phenotype. J. Biol. Chem. 284, 9458–9464. doi: 10.1074/jbc.m809498200
Stim-Herndon, K. P., Petersen, D. J., and Bennett, G. N. (1995). Characterization of an acetyl-CoA C-acetyltransferase (thiolase) gene from Clostridium acetobutylicum ATCC 824. Gene 154, 81–85. doi: 10.1016/0378-1119(94)00838-j
Vishwakarma, R. K., Ruby, Singh, S., Sonawane, P. D., Srivastava, S., and Kumari, U. (2013). Molecular cloning, biochemical characterization, and differential expression of an Acetyl-CoA C-Acetyltransferase Gene (AACT) of Brahmi (Bacopa monniera). Plant Mol. Biol. Rep. 31, 547–557. doi: 10.1007/s11105-012-0523-6
Wanders, R. J., Vreken, P., Ferdinandusse, S., Jansen, G. A., Waterham, H. R., van Roermund, C. W., et al. (2001). Peroxisomal fatty acid alpha- and beta-oxidation in humans: enzymology, peroxisomal metabolite transporters and peroxisomal diseases. Biochem. Soc. Trans. 29(Pt 2), 250–267. doi: 10.1042/bst0290250
Wood, J. D., Enser, M., Fisher, A. V., Nute, G. R., Sheard, P. R., Richardson, R. I., et al. (2008). Fat deposition, fatty acid composition and meat quality: a review. Meat Sci. 78, 343–358. doi: 10.1016/j.meatsci.2007.07.019
Wu, T., Zhang, Z. H., Yuan, Z. Q., Lo, L. J., Chen, J., Wang, Y., et al. (2013). Distinctive genes determine different intramuscular fat and muscle fiber ratios of the longissimus dorsi muscles in jinhua and landrace pigs. PLoS One 8:e53181. doi: 10.1371/journal.pone.0053181
Xie, W., Zhang, S., Lei, F., Ouyang, X., and Du, L. (2014). Ananas comosus L. Leaf Phenols and p-Coumaric acid regulate liver fat metabolism by upregulating CPT-1 expression. Evid. Based Complement Alternat Med. 2014:90 3258.
Ya, Y. Y. (2013). Cloning and Quantitative Expression of 3-Ketoacyl-CoA Thiolase Gene in ISOCHRYSIS Globosa and Analysis of Fatty Acid Content Under Environmental Stress. Shihezi: Shihezi University.
Yang, Y., Fang, X., Yang, R., Yu, H., Jiang, P., Sun, B., et al. (2018). MiR-152 regulates apoptosis and triglyceride production in MECs via targeting ACAA2 and HSD17B12 genes. Sci. Rep. 8:417.
Yao, C. G. (2020). Identification of Gene Expression Patterns Affecting Porcine Fat Depositionusing GEO Public Database. Changchun: Jilin University.
Yun, J., Jin, H., Cao, Y., Zhang, L., Zhao, Y., Jin, X., et al. (2018). RNA-Seq analysis reveals a positive role of HTR2A in adipogenesis in yan yellow cattle. Int. J. Mol. Sci. 19:1760. doi: 10.3390/ijms19061760
Zhang, B., Wu, Q., Wang, Z., Xu, R., Hu, X., Sun, Y., et al. (2019). The promising novel biomarkers and candidate small molecule drugs in kidney renal clear cell carcinoma: evidence from bioinformatics analysis of high-throughput data. Mol. Genet. Genomic Med. 7:e607. doi: 10.1002/mgg3.607
Zhang, L. Y., and Wang, Y. M. (2015). Persistent Effects of Intake of Sea Cucumber Phospholipids on the Expression of Genes Related to Lipid Metabolism in Mice. Abstract of the Annual Meeting of Chinese Fisheries Society. Hangzhou: China Fisheries Society.
Zhang, Y., Wang, Y., Wang, X., Ji, Y., Cheng, S., Wang, M., et al. (2018). Acetyl-coenzyme A acyltransferase 2 promote the differentiation of sheep precursor adipocytes into adipocytes. J. Cell. Biochem. [Online ahead of print] doi: 10.1002/jcb.28080
Zhu, S., Park, S., Lim, Y., Shin, S., and Han, S. N. (2016). Korean pine nut oil replacement decreases intestinal lipid uptake while improves hepatic lipid metabolism in mice. Nutr. Res. Pract. 10, 477–486. doi: 10.4162/nrp.2016.10.5.477
Keywords: ACAA1 gene, preadipocyte differentiation, sheep, lipid metabolism, adipogenesis
Citation: Wang Y, Li X, Cao Y, Xiao C, Liu Y, Jin H and Cao Y (2021) Effect of the ACAA1 Gene on Preadipocyte Differentiation in Sheep. Front. Genet. 12:649140. doi: 10.3389/fgene.2021.649140
Received: 04 January 2021; Accepted: 18 May 2021;
Published: 21 June 2021.
Edited by:
Rui Su, Inner Mongolia Agricultural University, ChinaReviewed by:
Paolo Zambonelli, University of Bologna, ItalyAngela Cánovas, University of Guelph, Canada
Runjun Yang, Jilin University, China
Copyright © 2021 Wang, Li, Cao, Xiao, Liu, Jin and Cao. This is an open-access article distributed under the terms of the Creative Commons Attribution License (CC BY). The use, distribution or reproduction in other forums is permitted, provided the original author(s) and the copyright owner(s) are credited and that the original publication in this journal is cited, in accordance with accepted academic practice. No use, distribution or reproduction is permitted which does not comply with these terms.
*Correspondence: Yang Cao, caoyang003@163.com
†These authors have contributed equally to this work