 Thomas Pixner1,2
 Nathalie Stummer2,3Anna Maria Schneider2,3Andreas Lukas1,2Karin Gramlinger1
 Valérie Julian4
 David Thivel5
 Katharina Mörwald2,3
 Harald Mangge6Christopher Dalus2,3Elmar Aigner2,7Dieter Furthner1,2
 Daniel Weghuber2,3*
 Katharina Maruszczak2,3
- 1Department of Pediatric and Adolescent Medicine, Salzkammergutklinikum Voecklabruck, Voecklabruck, Austria
- 2Obesity Research Unit, Paracelsus Medical University, Salzburg, Austria
- 3Department of Pediatrics, Paracelsus Medical University, Salzburg, Austria
- 4Department of Sport Medicine and Functional Explorations, Diet and Musculoskeletal Health Team, Human Nutrition Research Center (CRNH), INRA, University Hospital of Clermont-Ferrand, University of Clermont Auvergne, Clermont-Ferrand, France
- 5Laboratory of Metabolic Adaptations to Exercise under Physiological and Pathological Conditions (AME2P), University of Clermont Auvergne, Clermont-Ferrand, France
- 6Clinical Institute of Medical and Chemical Laboratory Diagnostics, Medical University of Graz, Graz, Austria
- 7First Department of Medicine, Paracelsus Medical University, Salzburg, Austria
Until recently, glucagon was considered a mere antagonist to insulin, protecting the body from hypoglycemia. This notion changed with the discovery of the liver-alpha cell axis (LACA) as a feedback loop. The LACA describes how glucagon secretion and pancreatic alpha cell proliferation are stimulated by circulating amino acids. Glucagon in turn leads to an upregulation of amino acid metabolism and ureagenesis in the liver. Several increasingly common diseases (e.g., non-alcoholic fatty liver disease, type 2 diabetes, obesity) disrupt this feedback loop. It is important for clinicians and researchers alike to understand the liver-alpha cell axis and the metabolic sequelae of these diseases. While most of previous studies have focused on fasting concentrations of glucagon and amino acids, there is limited knowledge of their dynamics after glucose administration. The authors of this systematic review applied PRISMA guidelines and conducted PubMed searches to provide results of 8078 articles (screened and if relevant, studied in full). This systematic review aims to provide better insight into the LACA and its mediators (amino acids and glucagon), focusing on the relationship between glucose and the LACA in adult and pediatric subjects.
1 Introduction
The prevalence of obesity, non-alcoholic fatty liver disease (NAFLD) and type 2 diabetes mellitus (T2DM) are steadily rising in adults as well as in pediatric populations worldwide (1). NAFLD is considered as the most common chronic liver disease across all age groups (2–6).
Research on the liver-alpha cell axis (LACA) has shed new light on the pathophysiology of NAFLD and proposed glucagon and amino acids as pivotal drivers (7–9). Glucagon is predominantly known for its counter-regulatory mechanism of insulin and the ability to coordinate blood glucose homeostasis. While hypoglycemia stimulates the secretion of glucagon from pancreatic alpha cells to promote gluconeogenesis and glycogenolysis in the liver, glucagon’s role is more diverse (10). It has been demonstrated that glucagon administration leads to a reduction in plasma amino acids (AAs) and to increased AA-uptake via the liver and consequently to conversion into gluconeogenic precursors both in animals and humans (11, 12). In contrast, evidence that the liver and the pancreatic alpha cells are linked in a feedback-cycle is recent (8, 13). In 2015, Solloway et al. demonstrated that inhibiting the glucagon-receptor increases AA concentrations, reduces AA turnover, and promotes pancreatic alpha cell proliferation (14–16). Further research by Kim et al. in 2017 involving antibody-mediated blockage of the glucagon-receptor led to the discovery of slc38a5. This gene is upregulated in the liver and pancreas during the blockade and encodes an AA transporter favoring neutral amino acids (e.g., glutamine). Slc38a5-deficient mice showed diminished alpha cell proliferation in response to glucagon receptor blockade (17). Furthermore, mTORC1 regulates the slc38a5 expression, and inhibits mTORC1 by rapamycin blocked AA-induced alpha cell proliferation (7, 18, 19). Holst, Wewer Albrechtsen, and Pedersen postulated a feedback regulation mechanism that links the liver and the pancreatic alpha cell known as LACA (8, 9).
The LACA describes, under physiological conditions, how a rise of plasmatic AAs induces glucagon secretion from the pancreatic alpha cells. Postprandial glucagon, in turn, controls hepatic AA metabolism and induces ureagenesis, resulting in decreasing levels of plasmatic AAs. When levels of plasmatic AAs return to their normal range, so does glucagon (see Figure 1A) (9, 20, 21). It is of special interest that the LACA seems to be disturbed in obesity and associated conditions. Besides genetic defects and pharmacological interventions to inhibit glucagon signaling, hepatic disorders (e.g., NAFLD and NASH (9, 22, 23)) and certain metabolic conditions (e.g., obesity (24, 25), T2DM (22)) have been associated with impaired glucagon signaling and hence disrupted LACA (26, 27). Under such conditions, the weakened effect of glucagon on AA turnover results in reduced ureagenesis and hyperaminoacidemia. Elevated levels of plasmatic AAs, in turn, lead to hyperglucagonemia and proliferation of pancreatic alpha cells. This process creates a vicious cycle of metabolic imbalance (see Figure 1B) (10, 11, 14, 17, 22, 23, 28).
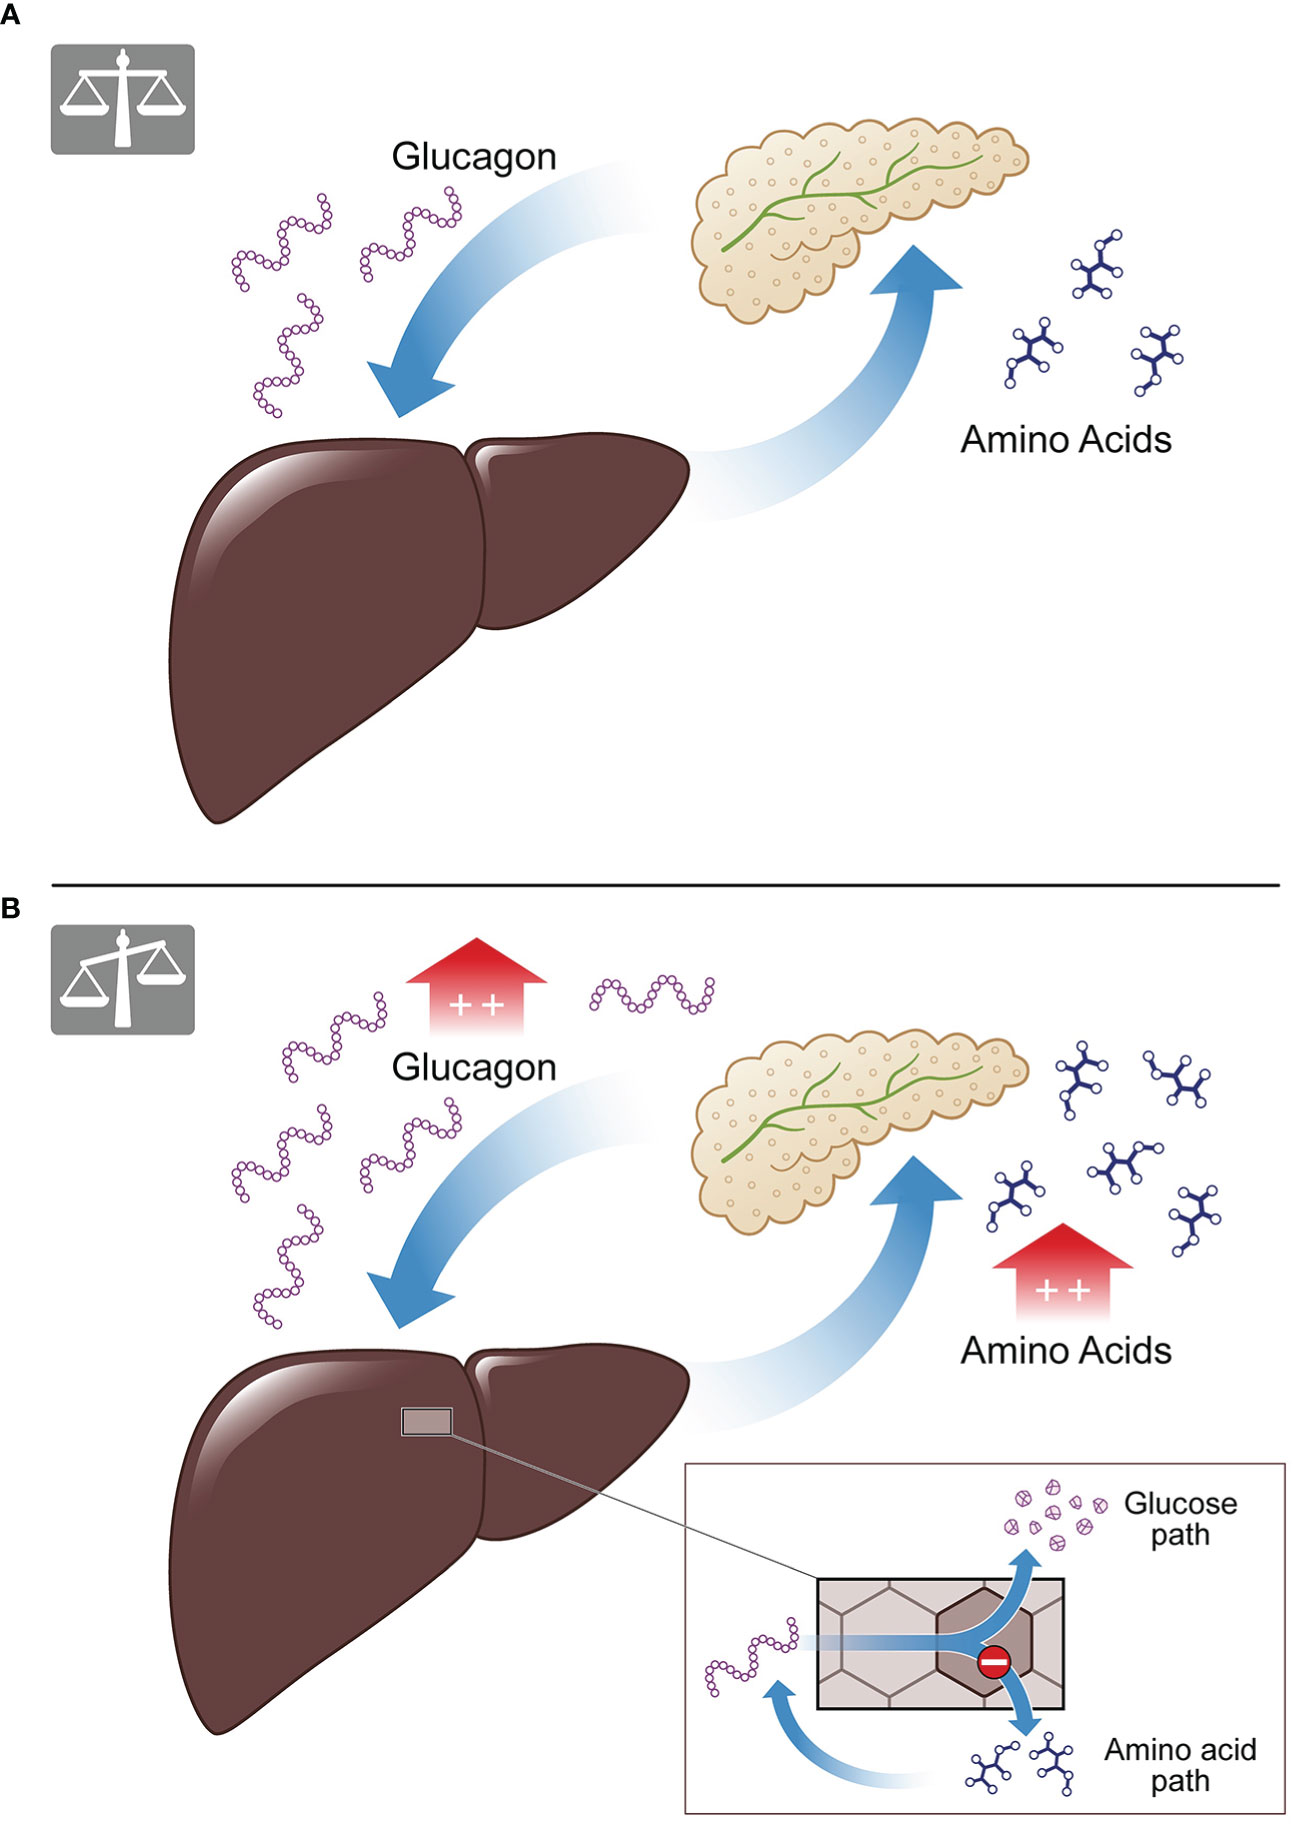
Figure 1 The liver-alpha cell axis. (A) Under physiological conditions amino acids lead to glucagon secretion from the pancreatic alpha cell, causing amino acid degradation and ureagenesis in the liver. The result is a balanced feedback cycle, termed the liver-alpha cell axis. (B) In conditions of metabolical impairment (e.g., NAFLD, T2D) the cycle is malfunctioning. Amino acids cannot be properly degraded as the amino acid pathway is disrupted, while the glucose pathway of glucagon is functioning (see insert). This results in hyperaminoacidemia and hyperglucagonemia.
While amino acids are drivers of the LACA, study results on specific AAs remain controversial. Most AAs stimulate glucagon and insulin secretion; however, some are more potent (29–34). Glucagon is the second mediator of the LACA, and its secretion is a complex process in itself and regulated by multiple interactions. These include changes in blood glucose, vegetative (sympathetic and parasympathetic) and other neural signals, amino acids, fatty acids, endocrine and paracrine functions (18, 35–39). A disturbed LACA seems to mark glucagon resistance in the hormone AA-pathway (15, 22), resulting in elevated plasmatic levels of amino acids, while the glucose pathway appears to remain intact (10, 13, 14, 17, 20, 21, 40–42). Hyperglucagonemia results in increased hepatic glucose production (43) via maintained glycogenolysis (21), and increased activity of gluconeogenesis’ key enzymes (9). In obesity, NAFLD, and T2DM, fasting hyperglucagonemia is common and stimulates hepatic glucose production, predisposing to elevated blood glucose levels (44–47). The diabetogenic role of glucagon is widely accepted and confirmed in patients with type 2 diabetes (48–50). If not counterbalanced, hyperglycemia may result in insulin resistance, worsening of NAFLD and the development of T2DM and metabolic syndrome. Hence, understanding how metabolic risk factors such as (increased) glucose intake may affect the LACA is essential. Additionally, AA and glucagon levels during oral glucose tolerance test (OGTT) may hold predictive/diagnostic information on metabolically associated diseases.
Besides providing an overview of the LACA, the aim of this systematic review is to summarize the relationship between glucose and the mediators of the LACA (i.e., glucagon and AAs) under physiological conditions and in conditions of metabolical impairment. This review is structured to report data of the mediators` interactions with glucose and each other as well as their dynamics during experimental glucose administration including results from the pediatric population.
2 Methods
2.1 Design
This systematic review was conducted and written following the Preferred Reporting Items for Systematic Reviews and Meta-Analysis (PRISMA) guidelines (49). Inclusion criteria were quantitative studies, peer reviewed-papers, basic research, and clinical research. We excluded non-English publications and studies with a focus other than human medicine (e.g., veterinary medicine).
2.2 Search strategy
Three authors independently searched the PubMed database and cooperated in screening the results. The purpose of the search was to identify data on LACA and its relationship with glucose. As glucagon and amino acids are the LACA’s main mediators, these were of central interest concering glucose-interaction. The first search was conducted on December 13th and 14th, 2021. The first search included the terms “liver AND alpha cell AND axis,” “liver-alpha cell,” “Liver-islet axis,” “Glucagon AND liver,” and “Glucose and amino acids” without any parameters (e.g., age) in all articles up to December 1st, 2021. A second search on December 22nd, 2021, included “OGTT Amino acids” (articles from 1.1.2016-12.1.2021) and “OGTT Glucagon” (articles from 1.1.2016-12.1.2021) without additional filters. The rationale for the search period was the keystone study on glucagon-receptor blockade and alpha cell hyperplasia by Solloway et al. in July 2015, the report of hyperglucagonemia in NAFLD in 2016 and postulation of LACA in 2018 (14, 15, 20). As part of the second search (“OGTT Amino acids” and “OGTT Glucagon”) studies on pediatric cohorts (0-18 years) published between 1.1.2000-12.31.2021 were searched. The search period for pediatric results was extended until the beginning of the year 2000 due to the lack of pediatric studies and difficulties with glucagon measurements in older studies (51, 52). For the second search inclusion criteria were the same as in the first search attempt. However, exclusion criteria were extended to pregnancy, medication/pharmacological studies, cancer, pancreatectomy, and severe inborn metabolic diseases (e.g., PKU, SMA). Figure 1 shows the two searches and the number of papers remaining after screening and excluding doubles.
2.3 Screening and data extraction
The two authors in charge of the search screened the first 6866 articles by title and abstract. The title or abstract had to provide information associated with at least one of the following topics: liver-alpha cell axis (LACA), amino acids (AAs), glucagon, or glucose metabolism. One hundred ninety-one articles qualified for the full-text article analysis. After the second analysis, 35 of 1073 articles qualified for full-text analysis and were included in this study. After screening 8078 publications, 88 articles (first search: 67 plus second search: 21) were included (see Figure 2). Secondary literature from these articles was studied as well.
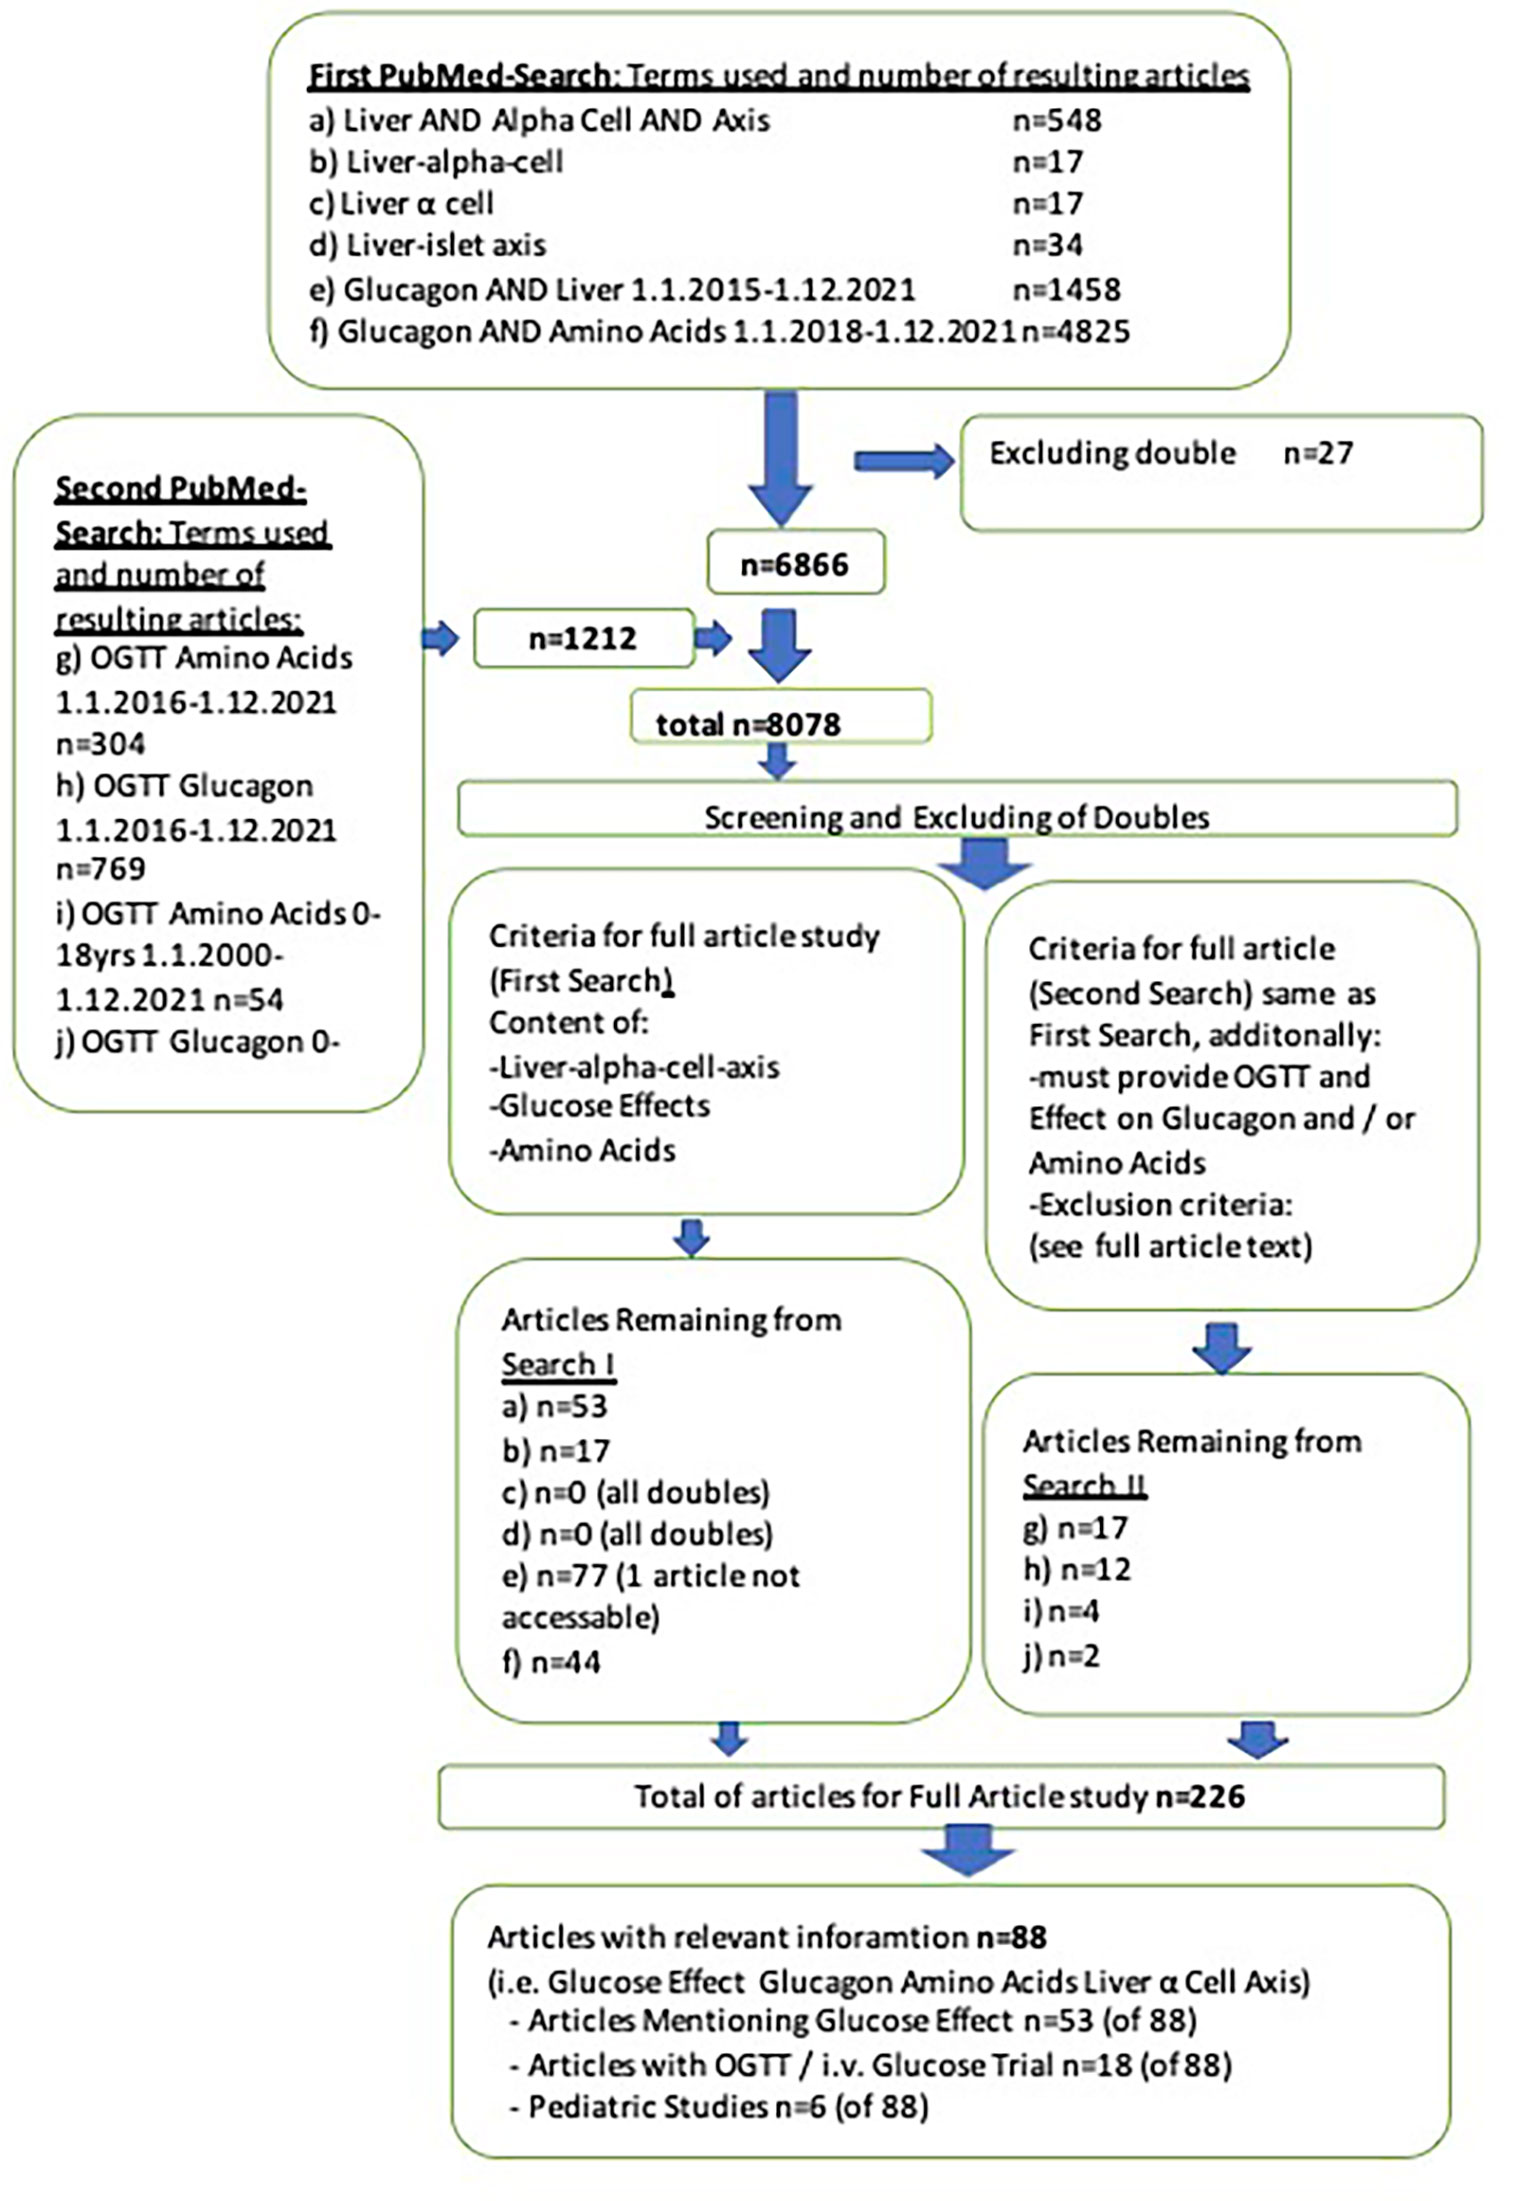
Figure 2 PRISMA-flow chart of literature search.
2.4 Data synthesis
Information on amino acids, glucagon, glucose, and other relevant data, were used to draft the manuscript. As the studies and reviews were significantly heterogeneous concerning populations and methods, we opted for a narrative literature synthesis rather than a meta-analytical approach for interpreting findings.
3 Results
3.1 Characteristics of literature search
In total 88 articles (first search: 67 plus second search: 21) were included in this review. Secondary literature from these articles was also analyzed and referenced. The literature research via PubMed identified 19 articles with standardized glucose administration (i.e., OGTT or intravenous (i.v.) glucose). One article investigated both glucagon and AAs (20). In contrast, 12 other articles examined the effect of glucose administration on glucagon (7, 53–62), and six other articles studied the effect of an OGTT on AAs (63–68). The articles by Knop (7), Junker (54) and Wang et al. (55) were the only trials to include i.v. glucose infusions. Junker (54) mentioned 50g of glucose for OGTT, while the other authors administered 75g glucose OGTT (or 1.75g/kg body weight respectively) (7, 20, 53, 54, 56–68). Six articles included pediatric subjects (22, 62, 68–72). Of these, four reported amino acid levels in children with obesity (22, 68, 69, 72).
3.2 Glucose and glucagon under physiological conditions
Under normal conditions, glucagon and insulin counterbalance each other in order to maintain euglycemia (73). A decrease in blood glucose levels simultaneously determines a rise in glucagon levels and a decline in insulin levels (74). Glucagon regulation is complex and controlled by multiple factors (glycemic, paracrine, endocrine, and neural) (39). Hence the results section will initially focus on the isolated glucagon reactions. In hypoglycemia glucagon is secreted from the pancreatic alpha cell (15, 73). Pancreatic alpha cells are well-vascularized islet of Langerhans, which sense glucose concentrations (75). Glucose uptake is mediated by the glucose transporter 1 (GLUT1) in the alpha cell (76, 77). After glucose is taken up by the alpha cell, it is converted to ATP and water in the cell’s mitochondria. Under low blood glucose conditions, ATP concentration drops (18). Alpha cells also contain ATP-sensitive potassium channels (KATP). Variations in intracellular ATP are linked to changes in membrane potential via KATP (78). In low glucose conditions, the KATP channels in alpha cells are closed or show only mild activation (78). Thus, the opening of voltage-gated Na- and Ca2-channels generate a membrane potential of about ~60 mV. The opening of the Na- and Ca2-channels cause influx of Na and Ca2 and in turn cause the release of glucagon via exocytosis and glucagon from glucagon-containing granules (18, 75, 78). The purpose of glucagon secretion during low blood glucose is to increase hepatic glucose production via stimulation of glycogenolysis and gluconeogenesis and suppression of glycogenesis and glycolysis (74, 79). The ability to promote the activity of key enzymes responsible for gluconeogenesis (phosphorylase kinase, fructose 1,6-bisphosphatase, glucose 6-phosphatase, phosphoenolpyruvate carboxykinase) has been widely demonstrated (9). Glucagon levels vary along a circadian rhythm. During the physiological morning fasting period, plasma glucagon levels are lower and significant changes in blood glucose levels are required stimuli (80). Hypoglycemia also induces the activity of pancreatic sympathetic innervation and triggers the release of adrenaline from the adrenal medulla. In rodent studies, adrenaline directly stimulates glucagon secretion by binding to alpha1- or beta-adrenergic receptors on the alpha cell (81–84).
The ability of glucagon to elevate blood glucose levels seems to depend on the duration of fasting. The isolated effect of glucagon on gluconeogenesis is short-lasting as it cannot provide substrates (85) and the effect of glucagon subsides after extended fasting periods (22, 86–89). During longer fasting intervals, blood glucose levels mainly depend on cortisol and amino-acids (9, 48). Despite their decreased effectiveness, glucagon levels are elevated in prolonged fasting and starvation (80, 90). The synthesis of new glucogenic AAs from endogenous sources (e.g., muscle, liver) additionally boosts glucagon levels (and induces ureagenesis) (32, 91). In keeping with this, Holst et al. listed the glucose-alanine cycle. Alanine is released from the muscle into the circulatory system during prolonged fasting and then converted into pyruvate in the liver (9, 91). Glucagon regulates alanine transferase (responsible for alanine conversion to pyruvate) and the key enzymes responsible for gluconeogenesis. The cycle, however, depends on the alanine supply rather than glucagon action (9). In periods of starvation, insulin secretion is scarce, and may not inhibit the effects of glucagon (and cortisol) (32).
The suppression of glucagon secretion during hyperglycemia remains only partially understood (92–95). In mixed meals, glucagon levels rise together with blood glucose and insulin levels due to the proteins ingested (80). Conversely, glucagon levels plunge close to zero in healthy individuals following high-carbohydrate diets (8). The previously mentioned cellular mechanism works the other way in hyperglycemia, resulting in high intracellular ATP levels and low levels of ADP in the pancreatic alpha cell. The high ATP causes KATP channels to depolarize the membrane potential, thus inactivating Ca2+ and Na+-channels. An absent influx of Ca2+ and Na+ and their lower intracellular concentration hinder glucagon exocytosis and the release of glucagon into the general circulation (78). As glucagon secretion is not only regulated by Ca2+ and Na+ but also by cAMP, reducing cAMP is presumably involved in inhibiting glucagon secretion (96–99). Yu et al. demonstrated that glucose decreases the cAMP concentration beneath the plasma membrane via a direct glycemic effect on pancreatic alpha cells. The mechanism is unclear, but it is reported in mouse and human alpha cells (97). It has been reported that glucagon secretion shows a maximal inhibition at ∼5 mM glucose. When glucose levels exceed this limit, so does glucagon secretion paradoxically (38, 100).
3.3 Glucose and glucagon under conditions of metabolic impairment
In individuals with type-2-diabetes-mellitus (T2D), the body’s ability to respond to hypoglycemia appears severely attenuated or completely lost (101, 102). While precise mechanisms remains unclear, paracrine and central pathways have been suggested (103). Normal glucose response in T2D can be restored if glucose control is maintained, as shown by Bolli et al. via insulin clamping (pancreatic clamp with somatostatin). This study supports the hypothesis that failure of glucose sensing in T2D is not caused by an intrinsic defect of the alpha cells, but by a lack of metabolic control (104). In T2D, fasting hyperglucagonemia, as well as inadequate suppression of glucagon following carbohydrate ingestion, have been described (44). Hyperglucagonemia is common but not pathognomonic for T2D, as some patients also display normal glucagon level (15). In T2D, glucagon hypersecretion contributes to hyperglycemia (105–109). Therefore, glucagon receptor antagonists have gained attention as potential treatment for T2D (109–112). As with T2D, fasting hyperglucagonemia and increased hepatic glucose production have been observed in other conditions of metabolic impairment (15, 48–50). This includes non-diabetic subjects with obesity, non-diabetic subjects with NAFLD, prediabetic patients, and individuals with metabolic syndrome (15, 45–47, 113). Persistent hyperglycemia on the other hand may directly affect the pancreatic alpha cell via intracellular acidification, impaired mitochondrial function, and a resulting dysregulated KATP channel activity in the alpha cells (114). Of particular note, patients with NAFLD show significantly higher fasting plasma glucagon levels (either normoglycemic or T2D) than normoglycemic and T2D control subjects without NAFLD (113). Also, individuals with hepatic cirrhosis presented with hyperglucagonemia, hyperaminoacidemia, and impaired ureagenesis in response to glucagon (115–117).
3.4 Effects of experimental oral & intravenous glucose administration on glucagon
Literature research revealed thirteen articles (see Table 1) that investigated the effects of administration of glucose on glucagon (7, 20, 53–62, 71).
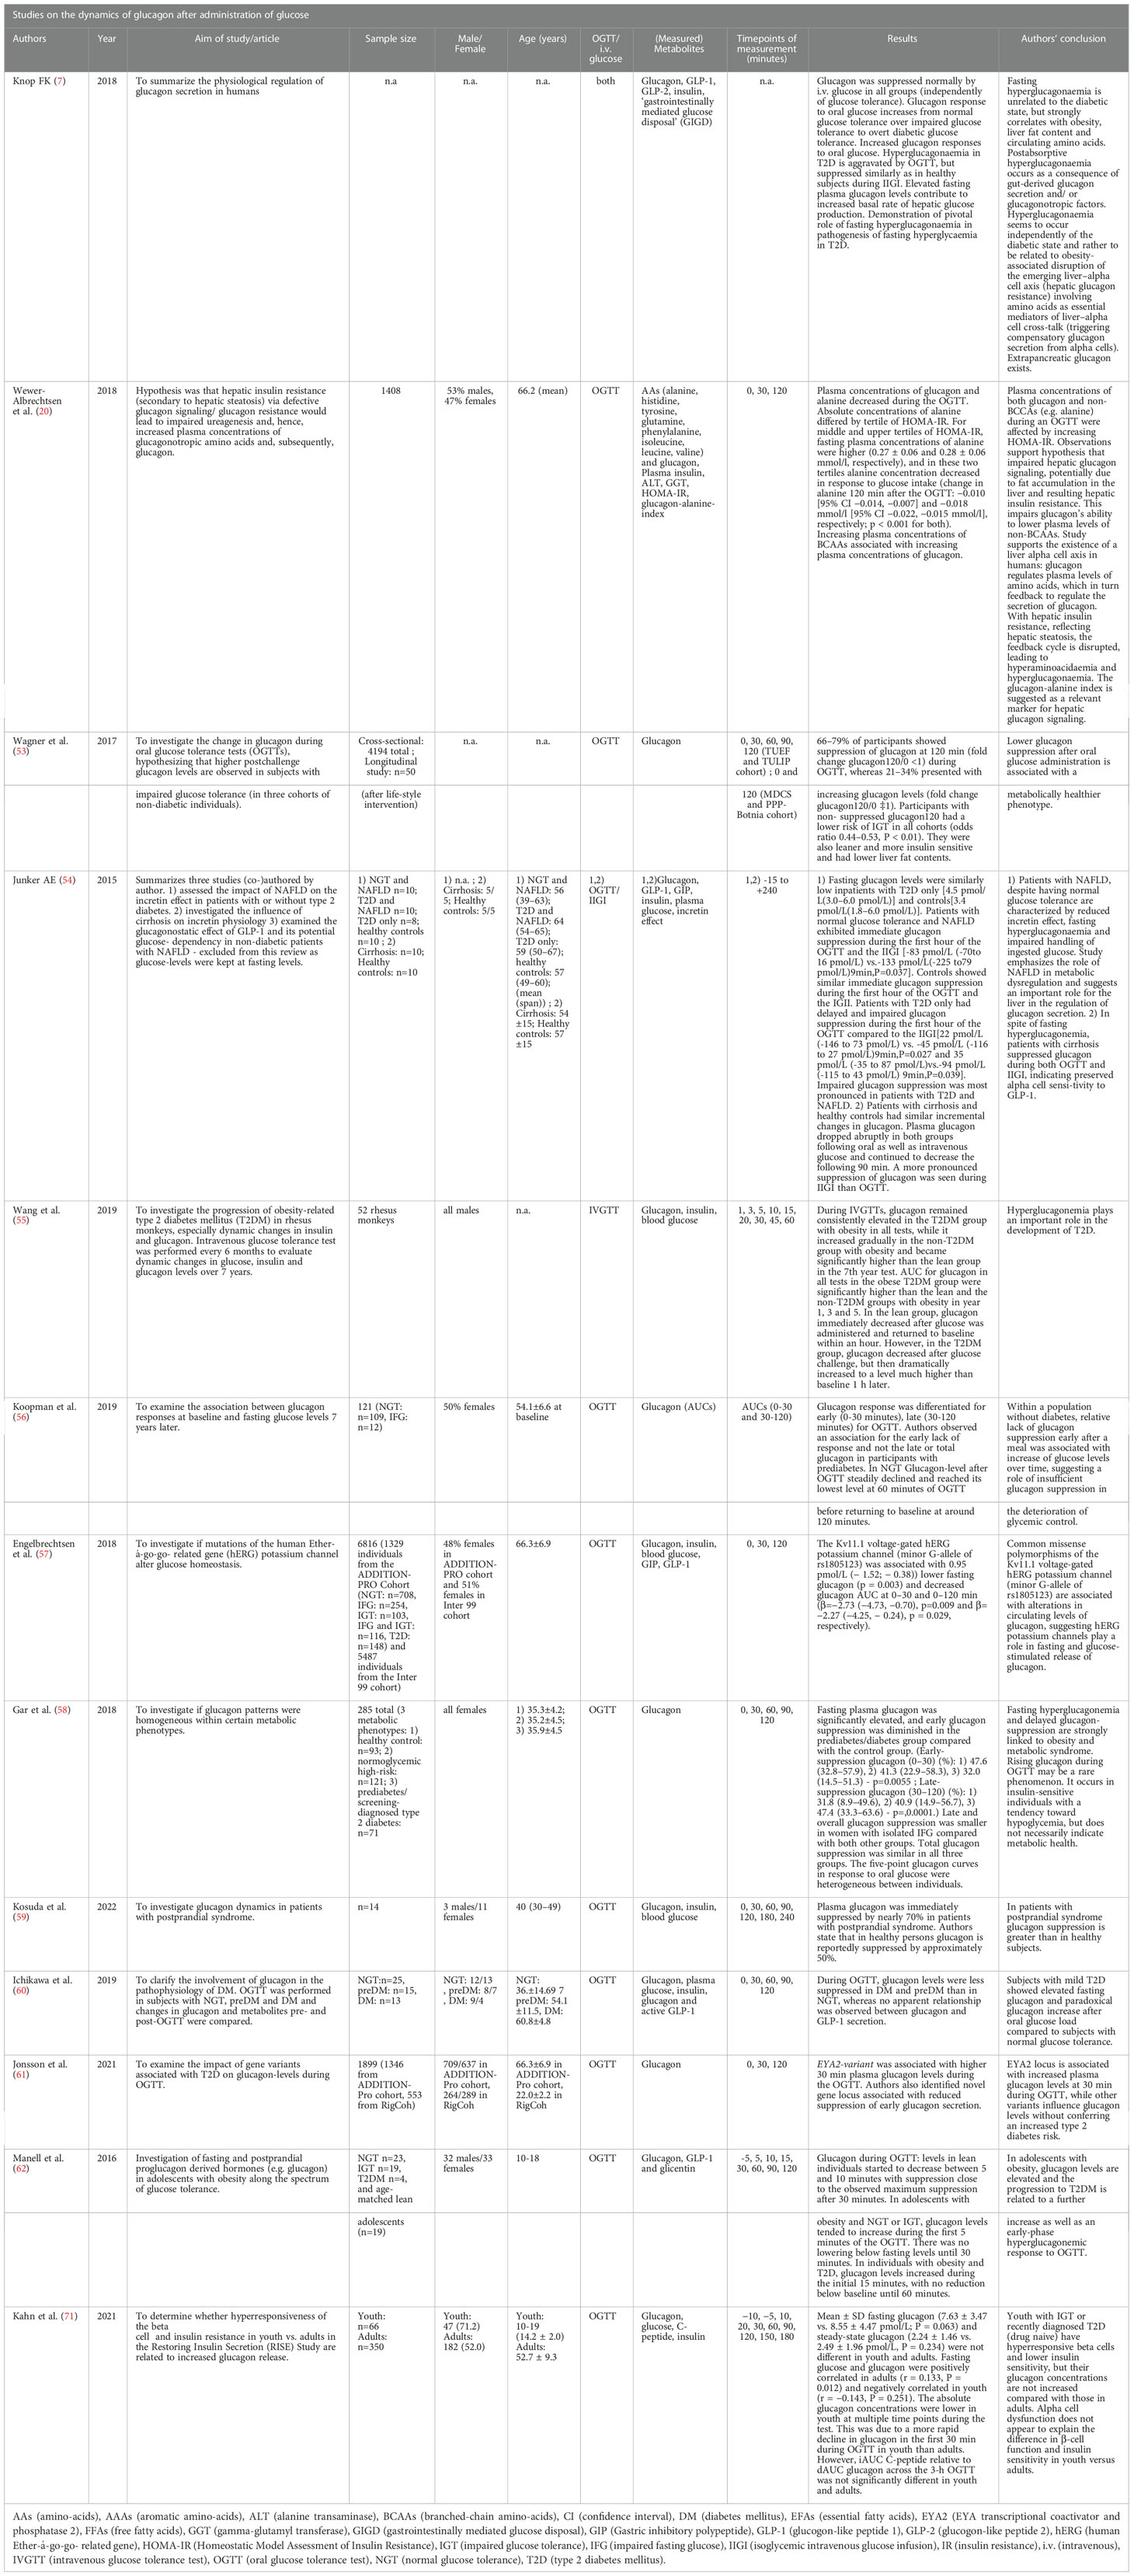
Table 1 Studies on the dynamics of glucagon after administration of glucose.
Ten articles studying the effect of glucose on glucagon were performed exclusively using an OGTT. Wewer Albrechtsen et al. examined the influence of an OGTT on glucagon and amino acids, demonstrating the relationship between AAs and glucagon in a feedback loop through the liver-alpha cell axis. Elevation of fasting glucagon was associated with lower concentrations of alanine, tyrosine, glutamine, and increased concentrations of BCAAs. Higher tertiles for HOMA-IR were associated with elevated fasting glucagon and a steeper decline in glucagon levels during OGTT than in lower tertiles while maintaining higher levels after 120 minutes (20). In an observational cohort study by Koopman et al. among 121 nondiabetic individuals, glucagon responses at baseline and glucose levels seven years later were investigated (56). During OGTT, glucagon levels dropped in the first 60 minutes, to reach baseline levels again after about 120 minutes (fasting plasma glucagon 9.4 ± 2.9; glucagon iAUC0-30min OGTT −0.23 ± 0.7; glucagon iAUC30-120min OGTT −2.80 ± 3.8; glucagon iAUC0-120min OGTT −2.94 ± 4.5 [all pmol/L, mean ± SD]). Deteriorating glycemic control over time was associated with insufficient glucagon-suppression during OGTT (56, 60) and an early lack of glucagon suppression exists in prediabetes (118). In keeping with this, Ichikawa et al. found glucagon-levels to be less suppressed during OGTT in T2D and prediabetes than in individuals with normal glucose tolerance (NGT) as well as higher fasting glucagon (prediabetes: 34.4 ± 4.6, T2D 44.1 ± 5.0, NGT: 20.6 ± 3.6, all pg/mL). This decrease of glucagon suppression was also reported in two articles investigating genetic variants and glucagon secretion during OGTT (57, 61). Engelbrechtsen et al. explored common variants in the human ether-aí-go-go related (hERG) gene resulting in a dysfunctional Kv11.1 voltage-gated potassium channel. Authors reported the minor G-allele of rs1805123 to be associated with decreased fasting glucagon release: if combined with the minor A- allele of rs36210421 a suppressed glucagon response to increased glucose levels during an OGTT was reported (57). Jonsson et al. performed a genome-wide association study to identify novel loci that affected plasma glucagon levels. The authors documented that higher plasma glucagon levels at 30 min during the OGTT (Beta 0.145, SE 0.038, P = 1.2 × 10⁻⁴) were significantly associated with a T2D variant in EYA2, noting a 7.4% increase in plasma glucagon level per effect allele. Jonsson et al. identified a marker in the MARCH1 locus, significantly associated with a reduced glucagon suppression during the first 30 min of the OGTT (Beta − 0.210, SE 0.037, P = 1.9 × 10⁻⁸), (8.2% less suppression per effect allele). They also found nine additional independent markers, not previously associated with T2D, that demonstrated suggestive associations with a reduced suppression of glucagon during the first 30 min of the OGTT (P < 1.0 × 10⁻⁵) (61).
Wagner et al. investigated the glucagon response in three cohorts (TUEF study, Bonita-PPP study, Tulip study) with a total of 4194 subjects. They found no suppression of glucagon during OGTT (glucagon120min) in 21-34% of subjects (in all three cohorts). These individuals were leaner, had a higher insulin sensitivity, a lower risk for impaired glucose tolerance (IGT) (OR 0,44-0,53 in all cohorts, p<=0.009) and lower fasting glucagon levels. The authors concluded that there was an association between non-suppressed glucagon at 120 minutes of OGTT and a metabolically healthier phenotype with lower IGT risk (odds ratio [OR] was 0.44–0.53 in all cohorts, p ≤ 0.009) (53). Comparing glucagon suppression between the groups (i.e., NGT, IFG, and IGT) and in the TUEF study at the intervals 0–30, 0–60, 0–90, and 0–120 minutes, only fold change glucagon120/0 minutes was different. In the PPP- Bonita study, of the 98 individuals with incident diabetes, significantly fewer had increasing or stable glucagon120min than subjects without diabetes (25 vs. 39%, P = 0.002). Glucagon120min in NGT was 15.2 median (12.6-18.9 [IQR/95%CI]), while in IGT it was 13.5 median (11.5-18.1 [IQR/95%CI]). The TULIP study assessed glucagon (fasting and 120 minutes during OGTT) before and nine months after a lifestyle intervention. Lifestyle intervention reduced fasting glucagon (19 vs. 17.5 [median] and 15.2-25.6 vs. 14.4-20.7 [IQR/95%CI]) as well as glucagon after 120 minutes (16.2 vs. 15.2 [median] and 12.4-20.4 vs. 13.4 vs. 18.1 [IQR/95%CI], all pg/mL) (53). Wagner et al. compared their results to those by Faerch et al. (118), that had registered lower early suppression of glucagon (minutes 0-30) and higher late suppression of glucagon (minutes 30-120) in patients with prediabetes and incident diabetes, compared to individuals with NGT (118). The authors found comparable data on late glucagon suppression, however, the TUEF study did not show differences between prediabetes and NGT for shorter intervals (30/0, 60/0, and 90/0). Also, glucagon levels were about two-fold higher than those of Faerch et al. (118). Wagner et al. stated that similar AUCs for glucagon levels and additional controlling for fasting glucagon suggest that fasting glucagon does explain the association between glucagon suppression and insulin sensitivity. Additionally, they found a strong inverse association of hepatic triglyceride content with non-suppressed glucagon120min in their data (51). Similarly, Gar et al. found four patterns of glucagon dynamics that did not match metabolic phenotypes in female patients. While Gar et al. reported fasting hyperglucagonemia and delayed glucagon suppression in prediabetes and T2D (median Q1 to Q3 for fasting plasma glucagon: 6.0 [4.6 to 8.2] vs 7.7 [5.6 to 11.2] in controls); early glucagon suppression: 47.6 [32.8 to 57.9] vs 32.0 in controls [14.5 to 51.3, all pmol/L], respectively. This applied to only 21% of cases and 8% of the control group. Delayed glucagon suppression was clearly associated with obesity and metabolic syndrome. One cluster of seven individuals with low fasting glucagon had rising glucagon levels during the OGTT. The women in this cluster were lean, insulin sensitive, and displayed low plasma glucose (58). The study with the smallest population was done by Kosuda et al., who investigated glucagon response to an OGTT in 17 patients with idiopathic postprandial syndrome (IPS). They reported two types of glucagon dynamics. The first was characterized by lower fasting glucagon and further suppression during OGTT, and the second with fasting hyperglucagonemia and drastic decrease during OGTT. The authors concluded that glucagon suppression in patients with IPS is more substantial than in healthy individuals (59).
Two publications addressed glucagon levels during an OGTT in a pediatric collective, which are presented in the section on pediatric data below (62, 71). Of the studies that included intravenous glucose administration, one study by Wang et al. was on rhesus monkeys. They performed i.v. glucose tolerance tests every six months and measured glucagon levels during tests. In the T2D group with obesity, glucagon remained elevated. In the non-T2D group with obesity, it increased gradually to become significantly higher in the 7th year test. In lean monkeys, glucagon immediately decreased after i.v. glucose and returned to baseline within an hour. In the T2D group, glucagon initially decreased after the glucose challenge to increase to a considerably higher level than baseline after 60 minutes (55). In human studies, Knop reports hyperglucagonemia during OGTT in T2D patients specifying they responded with normal suppression of glucagon during an isoglycemic intravenous glucose infusion (IVGI) (7, 119). The author documents the reproduction of this effect in a number of studies (120–122). Knop found the same reaction in other forms of diabetes (e.g., secondary diabetes after pancreatitis) (7). In a publication on incretin hormones and glucagon in liver disease, Junker included a summary of three separate studies. The first investigated the influence of NAFLD on the previously mentioned hormones in individuals with normal glucose tolerance and or T2D. All patients underwent OGTT (50g glucose) and an isoglycemic intravenous glucose infusion (IVGI). In the first study, only fasting glucagon was measured. Incretin effect in controls was stronger than in NAFLD and T2D. Fasting hyperglucagonemia was associated with NAFLD independent of T2D. Controls and T2D without the liver disease had similar fasting glucagon levels. The second study concentrated on patients with cirrhosis. Fasting hyperglucagonemia was present in cirrhosis and both oral (50g glucose OGTT) and i.v. glucose suppressed plasma glucagon. Junker concluded that cirrhosis complicates the treatment of oral glucose and reduces the incretin effect, possibly contributing to glucose intolerance in cirrhotic patients. The third study included no glucagon measurements (54).
3.5 Effects of glucagon on amino acids and vice versa
Glucagon is known to stimulate the influx of AAs into liver cells to provide substrates for gluconeogenesis (106). In order to do so, glucagon stimulates AA transporters expression in the liver for alanine, glutamine, asparagine, and histidine (123, 124). After the influx of AAs into the hepatocytes, the AAs are processed for gluconeogenesis and ureagenesis (85, 125). Under pharmacological blockade of the glucagon receptor signal, plasma concentrations of AAs increase while ureagenesis decreases (13, 28, 126–131). Inhibition of glucagon signaling reduces the expression of genes involved in hepatic AA uptake and AA metabolism, thus resulting in hyperaminoacidemia (10, 13, 14, 17, 28, 132, 133). Wewer Albrechtsen et al., Longuet et al., Kim et al. and Dean et al. reported that amino acids regulate glucagon secretion and the alpha cell mass and its proliferation (10, 14, 16, 17, 22). Most AAs stimulate glucagon and insulin secretion with varying potency (29–33). Additionally, there also seem to be differences among species (34). Otten et al. found fifteen AAs potentially signaling to the alpha cell to increase glucagon secretion. They proposed alanine as the main signal molecule, arguing that, if administered intravenously, it is a potent stimulator of glucagon secretion (134–136). However, in the fasting state, results for alanine remain unclear. While elevated fasting levels of alanine are associated with elevated fasting glucose (137, 138) alanine was not associated with glucagon (136). Elevated glucagon secretion has also been reported following the administration of arginine, cysteine, lysine, glycine, and proline (136). Results for glutamine remain controversial. In cell culture models, it is known to cause alpha cell proliferation but does not cause glucagon secretion in the perfused mouse pancreas (10, 136). Leucine was associated with alpha cell proliferation in isolated mouse islets (10, 17), but the results on glucagon secretion for BCAAs remain inconclusive. BCAAs were reported to not stimulate glucagon secretion (30, 32, 136, 139), except for one study on a perfused rat pancreas (29). In contrast, another study reported significant correlations between postprandial glucagon and leucine, and isoleucine and valine (134). The prolonged administration of AAs led to alpha cell proliferation as shown in isolated pancreatic mouse islets (14), and certain AAs (alanine, glutamine, glutamate, and leucine) were consistently associated with alpha cell proliferation (10, 17). AA concentrations, as shown with BCAA, vary with disease. Patients with NAFLD presented with increased plasma concentrations of BCAAs, aromatic AAs, glutamate, alanine, and lysine, and decreased glycine and threonine (140). Interestingly plasma concentrations of glucagonotropic amino acids were elevated in patients with NAFLD, and AA concentrations correlated with glucagon concentrations (141).
3.6 Effects of experimental oral glucose administration on amino acids
Seven articles investigated the dynamics of amino acids during isolated glucose intervention (i.e., OGTT) in the context of LACA (20, 63–68). Table 2 lists the articles containing information on amino acid dynamics during OGTT as well as their results and conclusions.
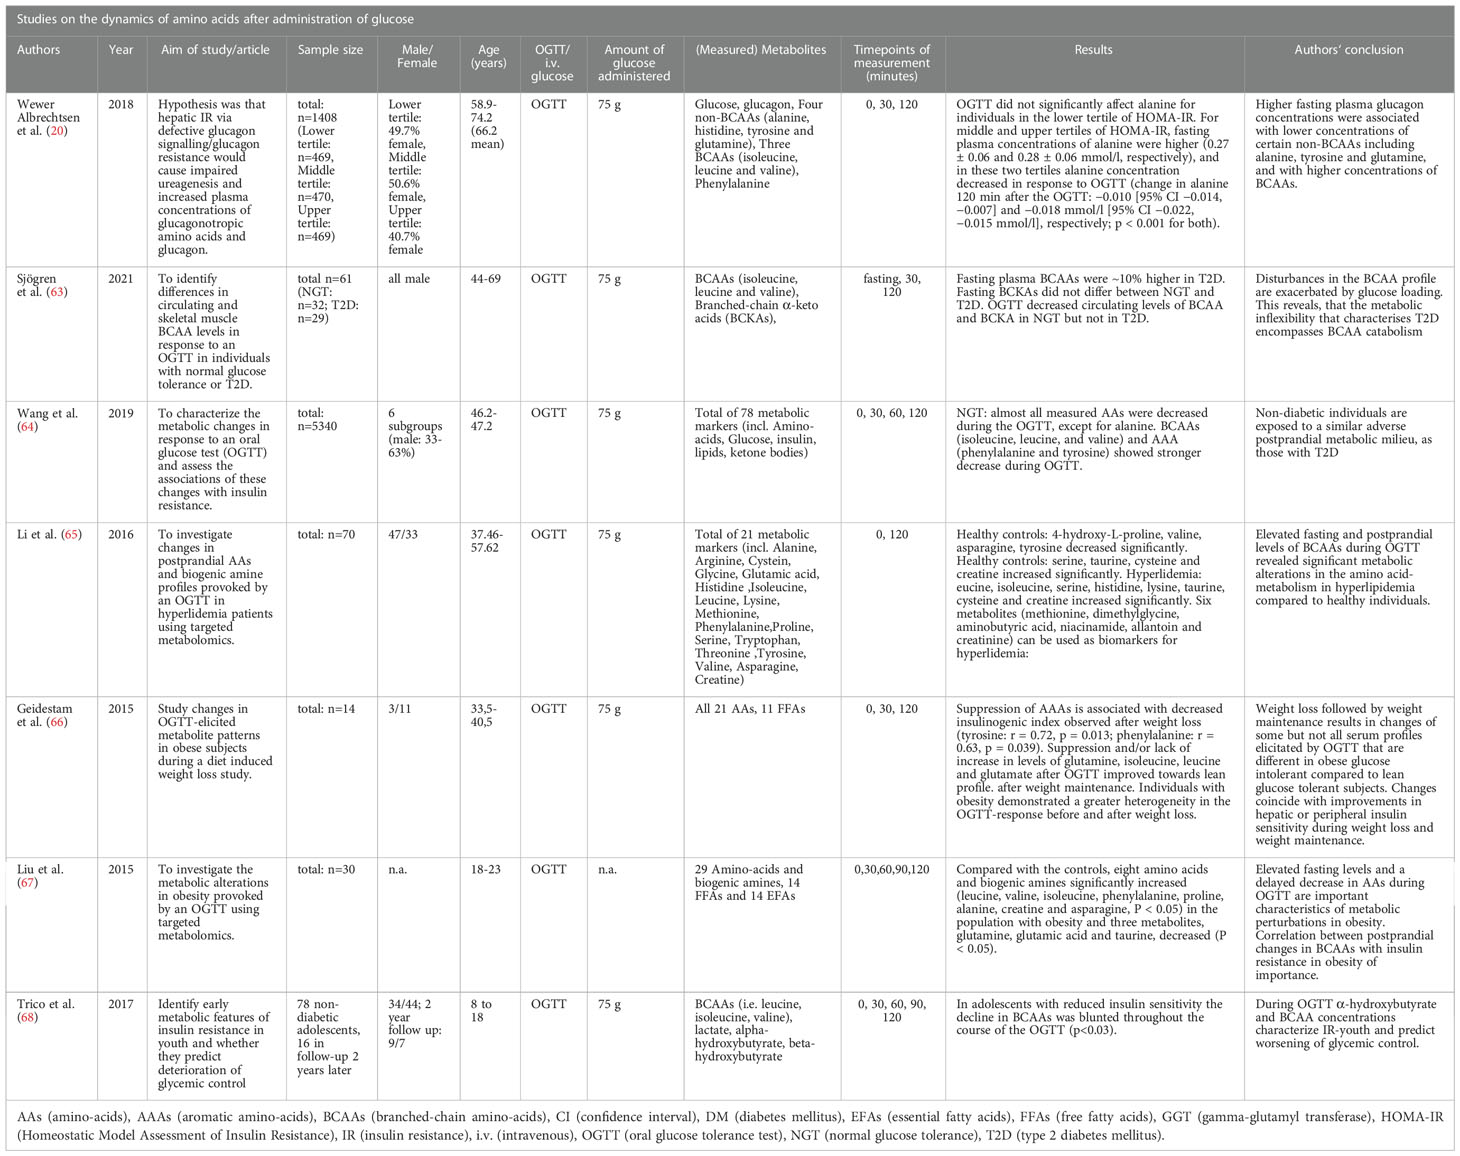
Table 2 Studies on the dynamics of glucagon after administration of glucose.
In a previously mentioned study from 2018, Wewer Albrechtsen et al. analyzed glucagon and eight AAs during an OGTT (20). The study included 1408 adult individuals from the Danish ADDITION-PRO study that underwent a 75g OGTT. Blood samples were drawn at 0, 30 and 120 minutes to analyze serum glucose, glucagon, and eight AAs. The AAs were four non-BCAAs (alanine, histidine, glutamine, and tyrosine), three BCAAs (isoleucine, leucine, and valine), and phenylalanine. During the OGTT, plasma concentration for glucagon and alanine decreased. Alanine concentrations differed by HOMA-IR tertile. Individuals in the lower HOMA-IR tertile were not significantly affected (fasting: 0.26 ± 0.06 mmol/L change in alanine 120 min after the OGTT: −0.003 mmol/L [95%CI −0.007, 0.000 mmol/L], p=0.076). Middle and upper tertiles for HOMA-IR showed higher fasting alanine (0.27 ± 0.06 and 0.28 ± 0.06 mmol/L, respectively). In these tertiles, a significant decrease occurred during OGTT (change in alanine 120 min after the OGTT: −0.010 [95% CI −0.014, −0.007] and −0.018 mmol/L [95% CI −0.022, −0.015 mmol/L], respectively; p<0.001 for both). Authors found statistically significant non-linear associations with fasting glucagon levels for phenylalanine, isoleucine, leucine and valine (p ≤ 0.049). They also found a modifying effect of hepatic insulin resistance on the associations with fasting plasma glucagon (p ≤ 0.040) for alanine, tyrosine, phenylalanine, ‘total non-BCAA’ (alanine, tyrosine, histidine and glutamine), isoleucine, leucine, and total BCAA. Wewer Albrechtsen et al. found that increasing levels of hepatic insulin resistance (but not peripheral IR) (p > 0.166) attenuated the association between glucagon and circulating levels of alanine, glutamine, and tyrosine. This was also significantly associated with hyperaminoacidaemia and hyperglucagonaemia (20). The association between insulin resistance and BCAAs during an OGTT was also investigated by Sjögren et al. They investigated differences in circulating BCAA levels in response to an OGTT between the circulatory system and skeletal muscles (63). For the purpose of this review, the plasma levels of BCAAs were of interest. The study population included thirty-two men with normal glucose tolerance (NGT) and 29 men with T2D. The authors found that the impaired BCAA catabolism in T2D under fasting conditions was exacerbated during OGTT. In NGT, the OGTT resulted in a 37-56% reduction of BCAAs, with no detected changes in patients with T2D. Fasting BCAAs levels (isoleucine, leucine, and valine) were ~10% higher in T2D than in NGT, no significant changes were recorded for corresponding branched-chain α-keto acids (BCKAs). The OGTT decreased circulating levels of BCAA and BCKA in NGT. The authors concluded that a glucose challenge may unmask defects at several steps of BCAA catabolism in T2D. The circulating concentrations of leucine, isoleucine, and derived BCKAs exhibited a positive correlation (r=0.64–0.77) with blood glucose, HOMA-IR, and HbA1c after an OGTT (63). A 2021 study by Wang et al. came to similar conclusions concerning BCAAs. They analyzed 78 metabolic parameters during fasting and during an OGTT. In individuals with NGT almost all measured AAs decreased during the OGTT, except for alanine. BCAAs (isoleucine, leucine, and valine) and aromatic amino acids (AAA) (phenylalanine and tyrosine) showed a more noticeable decrease (15 to 45%) than the other amino acids (not specified by authors) (6 to 10%) at 120 minutes. In insulin resistance (IR), the BCAAs were higher at baseline and had a weaker decrease at 2 hours. Individuals with NGT and IR showed a less favorable metabolic profile than insulin-sensitive individuals with NGT (P<0.0006 and consistent when stratified by sex). Individuals with diabetes or prediabetes showed marginal differences in metabolic responses concerning branched-chain amino acids. Authors concluded, subjects with NGT and IR have a similar metabolic pattern and cardiovascular risk level as in T2D. The article did not include absolute values of AAs (64).
Two studies focused on AA dynamics during OGTT in the context of obesity. Liu et al. measured AAs after an OGTT in a cohort of 15 young adults with obesity (18-23 years) and compared values with those from 15 lean controls. In the group with obesity, baseline (i.e., fasting) BCAAs (leucine, valine, isoleucine) as well as phenylalanine, proline, alanine, creatine, and asparagine were significantly increased (P<0.05), while glutamine, glutamic acid, and taurine were decreased (P<0.05). During the OGTT 2h-glucose was positively associated with leucine (r=0,84, P<0.05) and tryptophan (r=0.77, P<0.05) in controls. In the group with obesity, changes in arginine and histidine were positively associated with parameters for obesity (P<0.05). Increasing fasting glucose was positively associated with changes in histidine concentrations (P=0.004). HOMA-IR correlated with changes in leucine, isoleucine, phenylalanine, lysine, and histidine during the OGTT (67). The second study, by Geidenstam et al. analyzed 21 AAs during an OGTT in 14 individuals with obesity during weight loss. Results suggested different metabolic patterns during weight loss and weight maintenance, and only a few profile changes towards the lean reference. They reported that after weight-loss a suppression of aromatic amino acids was associated with decreased insulinogenic index (tyrosine: r = 0.72, p = 0.013; phenylalanine: r=0.63, p=0.039). Moreover, OGTT-elicited suppression or lack of increase in levels of glutamine, isoleucine, leucine, and glutamate improved towards the lean profile in weight maintenance following weight loss, and improved glucose tolerance (AUC Glutamine (weight-loss: r=0.76, p=0.003 and weight-maintenance: r=0.85, p=0.0002, respectively). Subjects with obesity’s response to OGTT before and after weight loss was more heterogeneous than in lean patients, although reduced during weight maintenance (66). One study was included individuals with known hyperlipidemia and compared their AA dynamics during OGTT to healthy controls. Li et al. investigated 21 metabolic parameters before and after an OGTT (plasma samples at minutes 0 and 120). In healthy controls, the levels of 4‐hydroxy‐L‐proline, valine, asparagine, tyrosine decreased, and the concentrations of four amino acids (serine, taurine, cysteine and creatine) increased significantly after the OGTT. In HLP there were significant increases in leucine, isoleucine, serine, histidine, lysine, taurine, cysteine, and creatine, while reductions in six metabolites (methionine, dimethylglycine, aminobutyric acid, niacinamide, allantoin, and creatinine) were noted after the OGTT. Li et al. reported that their data positively associated the postprandial changes in isoleucine and HOMA-IR. The study only listed fasting values and used graphics for measurements at 120 minutes and their association to clinical parameters (e.g., insulin concentrations) (65). The study on the effect of an OGTT on BCAAs in a pediatric population by Trico et al. is listed in section 3.8. on pediatric data (68).
3.7 Further studies on experimental glucose administration
In their study on the role of glucagon and muscle wasting in critical illness, Thiessen et al. infused critically ill patients with insulin and glucose, failing to lower glucagon, instead raising it with parenteral administration of amino acids. The authors suggested the effect of adrenaline and cortisol to avoid a decline in glucagon levels after glucose administration. They concluded that during critical illness hyperglucagonemia increases hepatic AA-catabolism without affecting muscle wasting or blood glucose (142). A study by Kelly et al. included two mathematical models of glucagon effectiveness and sensitivity from an OGTT (not included in the previous sections. These models were used to calculate how various degrees of patient glucagon-sensitivity and effectiveness might affect serum glucose and glucagon concentrations during IVGTT and insulin infusion tests. These suggested that the models could provide a mathematical platform from which the effect of glucagon during a glucose test may be predicted (143). In another publication, Lund et al. examined the glucagon of ten pancreatectomy patients and ten healthy controls. They found glucagon present in patients without a pancreas, demonstrating the existence of extrapancreatic glucagon. The authors suggested that this gut-derived extrapancreatic glucagon may play an unrecognized role in diabetes secondary to total pancreatectomy (144).
3.8 Pediatric data
Four studies focused on amino acids in a pediatric population. The study by Suzuki et al. included 26 children with obesity (15 male, age 122.2 ± 4.2 months; 11 female, age 122.9 ± 4.1 months). Elevated branched-chain AAs (BCAAs) leucine, isoleucine, and valine are associated with impaired glucose tolerance and hyperuricemia at early stages of pediatric obesity (72). In this study, HOMA-IR positively correlated with BCAAs, phenylalanine, tryptophan, methionine, threonine, lysine, alanine, tyrosine, glutamate, proline, arginine, and ornithine. In children with obesity and decreased HOMA-IR, levels of BCAAs, aspartic acid, alanine, tyrosine, glutamate, and proline decreased, but levels of glycine and serine increased after six months of lifestyle intervention (i.e., nutrition and exercise, no medication). After intervention in children with obesity and high HOMA-IR, all AA-levels declined (72). Cosentino et al. reported that leucine (19% (p=0.015)), isoleucine (21% (p=0.024)), and valine (21% [p=0.025]) as well as aromatic AAs (AAA, i.e., phenylalanine and tyrosine) were more elevated in children with obesity compared to healthy controls. A lifestyle-intervention program only showed negligible differences in BCAA- and AAA-changes (p>0.05) (145). Goffredo et al. found that plasmatic BCAAs negatively correlated with peripheral and hepatic insulin sensitivity. Dysregulation of BCAAs in adolescents with obesity was considered a characteristic of NAFLD and, therefore, a predictor of an increase in liver fat content (69). The only study to report changes in amino acid levels in a pediatric population during an OGTT was by Trico et al. (see Table 2). The study reports BCAA levels and included 78 non-diabetic children and adolescents aged 8-18 who underwent an OGTT (1,75g/kg body weight, up to 75g). Sixteen participants underwent a second OGTT two years later. Insulin sensitivity was estimated from the OGTT using Whole-body insulin sensitivity index (WBISI). In adolescents with a lower WBISI, fasting BCAA levels had increased. During the OGTT, BCAAs showed a more blunted decline after glucose administration in individuals with a lower WBISI (WBISI effect p<0.03 for all BCAAs). BCAA curves were not significantly different between insulin-sensitive and insulin-resistant individuals during the OGTT (146).
We found two publications on glucagon dynamics during an OGTT in a pediatric population. The study by Manell et al. investigated the plasma levels of glucagon, GLP-1, and glicentin in adolescents with obesity and T2D. In line with adult data, the authors found that adolescents with T2D and obesity had fasting hyperglucagonemia twice the level of the NGT group. Adolescents with obesity and NGT had 30% higher fasting glucagon than controls, glucagon levels increased with a decline in glucose tolerance. Fasting glucagon did not differ between NGT and IGT. During the OGTT, glucagon levels in lean adolescents decreased between minutes 5 to 10. Maximum suppression was achieved after 30 minutes. In adolescents with obesity (both NGT and IGT), glucagon levels showed an increasing trend in the first five minutes without declining below baseline in the first 30 minutes. In adolescents with obesity and T2D there was an increase in the first 15 minutes and no decline below baseline until 60 minutes after the start of the OGTT. Boxplots and fasting glucose concentrations are indicated for each subpopulation (62). The second study’s objective was to determine how the hyperresponsiveness of the beta cell and the insulin resistance in youth compared to adults (both with IGT or T2D) was due to an increased glucagon release. Data was gathered from the RISE study (66 youth and 350 adults), and patients on antidiabetic drugs were excluded. The younger population was 10-19 years of age with a Tanner stage >1. Fasting glucagon and steady-state glucagon did not differ between younger and adult participants. While fasting glucose and glucagon were positively correlated in adults (r=0.133, p=0.012), they negatively correlated in the younger group (r= -0.143, p=0.251). At comparable fasting glucagon levels, the 10-19 years olds had higher C-peptide levels and a lower insulin sensitivity. During a hyperglycemic clamp (blood glucose at around 11.1. mmol/L and >25 mmol/L), glucagon suppression was similar between the pediatric and the adult collectives. In the course of the OGTT, glucagon decreased in both groups, although absolute glucagon levels were lower in the young patients at multiple time points. Notably, the decline was steeper in the younger population in the first 30 minutes, but AUC for glucagon did not differ significantly between the two groups. Following an arginine infusion, glucagon levels in this study increased in youth and adults, but the response was significantly lower in the pediatric population. Higher fasting glucagon concentrations were associated with lower insulin sensitivity for both age groups. The authors had hypothesized that hyperglucagonemia would significantly contribute to the hyperresponsiveness of beta cells and insulin resistance in youth. As glucagon concentrations were lower in youth, the authors dismissed their hypothesis of direct beta cell stimulation via glucagon, suggesting a greater beta cell sensitivity towards glucagon in youths (71).
4 Discussion
The LACA is an established concept and disruption of the LACA may trigger hyperglucagonemia and hyperaminoacidemia. To this day, the underlying mechanisms are incompletely understood (22). As amino acids are considered to be drivers of the LACA (i.e., they stimulate glucagon secretion and alpha cell proliferation), their dynamics during glucose administration is of interest (29–33).
In healthy adults without steatosis and with NGT, fasting amino acid levels are normal and AA levels decrease readily during OGTT. However, while results for specific AAs are partly inconclusive (e.g., alanine) (22, 64, 140), BCAAs have consistently been linked to metabolic impairment (e.g., HOMA-IR as surrogate for hepatic insulin resistance) (147). Fasting BCAA-levels are elevated in adults with obesity, NAFLD, and T2D and are also associated with cardiovascular diseases (148). In individuals with diabetes and prediabetes, BCAA catabolism is impaired and plasmatic levels decrease slower during OGTT as in individuals with normal glucose metabolism (20, 64, 67). Hence, the OGTT might be useful in demasking defects in BCAA-catabolism (e.g. T2D) (63). BCAA catabolism involves a reversible and an irreversible process. The first takes place either in the cytosol or the mitochondria and is catalyzed via a branched-chain aminotransferase (BCAT). The second process is catalyzed in the mitochondria by branched-chain keto-acid-dehydrogenase (BCKDH), leading to formation of substrates that enter the Krebs cycle (149–151). In individuals with diabetes, BCAT and BCKDH expression may be decreased due to genetic variants (152, 153). However, a deranged function of the two enzymes has also been related to increased levels of insulin, fatty acids, and proinflammatory mediators, linking these hallmarks of obesity-associated metabolic impairment to BCAA catabolism and the LACA (154).
While a number of publications on fasting glucagon exist, there is very limited data on its dynamics after glucose administration. In general, glucagon levels are expected to decline when blood glucose levels rise. In adults, this response has been constantly observed after i.v. glucose administration, while responses to oral glucose vary. Of note, T2D is not only attributed to beta-cell dysfunction but also alpha-cell dysfunction. In keeping with this, hyperglucagonemia was repeatedly reported during OGTT in T2D and has been attributed to an incretin effect as well as to intestinal glucagon secretion (7, 119). Additionally, endogenous glucose production is higher during OGTT than after i.v. glucose administration (7). The lack of early glucagon suppression, especially within the first 30-60 minutes, may be an early and reliable hallmark of prediabetes and IGT in adults (56, 60, 118), although contradictory results question this (53). It is of interest that increased glucagon levels upon oral glucose challenge can also be found in healthy individuals and has even been associated with a lower risk for impaired glucose tolerance (IGT) (53). A potential explanation may be a protective effect of glucagon against acute hypoglycemia to counterbalance a strong insulin response to the glucose load and genetic variants involved in ion-channels regulating glucagon secretion (55, 56, 58, 155). Still, higher fasting glucagon and late glucagon-suppression during OGTT are consistent findings in prediabetes, T2D, obesity and the metabolic syndrome (53). The degree of obesity has been positively associated with glucagon levels, independent of insulin-resistance (25) and individuals suffering from hepatic dysfunctions display fasting hyperglucagonemia without altered glucose tolerance (156). As NAFLD has been demonstrated to be even more strongly associated with hyperglucagonemia than T2D, Wewer-Albrechtsen et al. considered the different degrees of liver fat in patients with T2D the reason for varying glucagon levels. However, the extent to which the steatotic liver is also partially resistant to the hyperglycemic actions of glucagon is unknown (22). As hyperglucagonemia is associated with fasting hyperglycemia and elevated HbA1c-levels in adults (22), the question arises if hyperglucagonemia precedes the impairment in glucose metabolism. In adults, the glucagon receptor seems to remain functional for the glucose pathway while the AA-pathway is impaired (157). Glucagon effects are mainly exerted via glycogenolysis via molecular pathways that are clearly separated from those of gluconeogenesis and ureagenesis (22). In in vitro studies, glucagon modulated beta cell function as well as endocrine hormonal function and parasympathetic levels (158).
Of note, dysregulated glucagon secretion is not as significant in adolescents as in adults with T2D. This speaks against a causal role of alpha cell dysfunction in the gradual progression from normal to impaired glucose metabolism and eventually T2D (159). Moreover, contrary to adults, glucagon was negatively associated with fasting glucose in a study by Stinson et al., as they investigated the influence of childhood obesity in 4012 Danish individuals (age 6-10 years). While fasting glucagon was associated with cardiometabolic risk markers (e.g., BMI SDS, body fat percentage, liver fat percentage, triglycerides, blood pressure), it was not associated with hyperglycemia. Thus, hyperglucagonemia might precede impairments in glucose regulation (160). This finding is in line with the pediatric data from the RISE study (71). Kahn et al. also reported an inverse relationship between glucagon and fasting glucose in their collective of 10-19 year old patients. In the RISE study there was no difference in glucagon suppression during OGTT between the age groups, however, arginine administration resulted in significantly lower glucagon levels in the pediatric population. In youth with IGT or newly diagnosed T2D, hypersecretion of beta cells and reduced insulin sensitivity have been described. At comparable glucagon levels as adults have, they also display higher C-peptide levels. Kahn et al. concluded that alpha cell dysfunction in youth does not explain beta cell dysfunction but suggests a greater glucagon-sensitivity in the pediatric population (71). In a pediatric population with obesity and T2D, glucagon-levels showed an early rise during OGTT (62). Manell et al. concluded that insulin or glucose were not responsible for hyperglucagonemia, but gut-derived glucagon or an altered glucagonotropic response to GIP. Additionally, a blunted GLP-1 response to affect glucagon was ruled out, as neither the response of GLP-1, nor insulin correlated with the glucagon-response. In this study, the lower GLP-1 response in adolescents with obesity, independent of glucose tolerance, corroborates previous findings from adult studies (48, 161). Pediatric studies only reported fasting concentrations of AA levels (22, 68, 69, 72). In accordance with adult data, elevated fasting BCAAs correlated with obesity and insulin resistance (22, 72) and were predictors of liver fat content (69). This indicates similarities of BCAAs in the role of metabolic diseases between pediatric and adult patients.
The limitations of this study were a relative paucity of studies on glucose and the LACA, the small number of pediatric studies, and the type of study design (i.e., mainly cross-sectional). Only one article by Dean included a single specific paragraph on the effect of glucose on the LACA (36). Most studies focused on fasting levels of glucagon and/or AAs. One challenge in studies involving the measurement of glucagon is quantifying exact plasma levels. Measurements have conventionally been performed with radioimmunoassay (RIA), deemed unreliable, especially at lower concentrations (51, 52, 60). Wagner at al. reported glucagon levels two times higher than Faerch et al. (118), both studies were performed in 2016 using different assays (53). The enzyme-linked immunosorbent assay (ELISA) may produce more accurate results (60). The main findings of this systematic review include a synopsis on what is known on the relationship of glucose and the liver-alpha cell axis. Certain aspects (e.g., inverse association between glucagon and glucose in youth vs. adults, change of AA-levels with age) hint towards potential differences between adults and children concerning LACA and pathophysiology and need further investigation (69, 71, 162, 163). Many aspects of glucagon-secretion (e.g., in hyperglycemia) are still incompletely understood (92–95). While hyperglycemia might directly attenuate alpha cell function, the consequences for the LACA remain unclear (114). Impaired glucagon response during OGTT is not only present in patients with T2D, but also in healthy individuals (58). The results on AAs in the fasting state remain partly inconclusive, but BCAAs are associated with metabolic impairments and show different dynamics in an altered LACA (63). In conclusion, the concept of the LACA is of great interest but still understudied. The LACA may provide better insight into metabolic diseases, and the dynamics of glucagon and amino acids during standardized glucose challenge tests may hold a predictive or diagnostic value.
Data availability statement
The original contributions presented in the study are included in the article/supplementary material. Further inquiries can be directed to the corresponding author.
Author contributions
Conceptualization, TP, DF and DW; Methodology, DW, TP, AL and NS; Analysis, TP, DF, KG and AS; Writing—Original Draft Preparation, TP, DF, VJ and DT; Writing—Review and Editing, TP, KG, KMö, KMa, HM, EA, CDand NS; Supervision, DW; Project Administration, TP and DF. All authors discussed the results and commented on the manuscript. All authors have read and agreed to the published version of the manuscript.
Conflict of interest
The authors declare that the research was conducted in the absence of any commercial or financial relationships that could be construed as a potential conflict of interest.
The handling editor AMG declared a past co-authorship with the authors DT and DW.
Publisher’s note
All claims expressed in this article are solely those of the authors and do not necessarily represent those of their affiliated organizations, or those of the publisher, the editors and the reviewers. Any product that may be evaluated in this article, or claim that may be made by its manufacturer, is not guaranteed or endorsed by the publisher.
References
1. Vajro P, Mandato C, Franzese A, Ciccimarra E, Lucariello S, Savoia M, et al. Vitamin e treatment in pediatric obesity-related liver disease: a randomized study. J Pediatr Gastroenterol Nutr (2004) 38(1):48–55. doi: 10.1097/00005176-200401000-00012
2. (NCD-RisC) NRFC. Worldwide trends in body-mass index, underweight, overweight, and obesity from 1975 to 2016: a pooled analysis of 2416 population-based measurement studies in 128·9 million children, adolescents, and adults. Lancet (2017) 390(10113):2627–42.
3. Welsh JA, Karpen S, Vos MB. Increasing prevalence of nonalcoholic fatty liver disease among united states adolescents, 1988-1994 to 2007-2010. J Pediatr (2013) 162(3):496–500.e1. doi: 10.1016/j.jpeds.2012.08.043
4. Anderson EL, Howe LD, Jones HE, Higgins JP, Lawlor DA, Fraser A. The prevalence of non-alcoholic fatty liver disease in children and adolescents: A systematic review and meta-analysis. PloS One (2015) 10(10):e0140908. doi: 10.1371/journal.pone.0140908
5. Schwimmer JB, Deutsch R, Kahen T, Lavine JE, Stanley C, Behling C. Prevalence of fatty liver in children and adolescents. Pediatrics (2006) 118(4):1388–93. doi: 10.1542/peds.2006-1212
6. Lobstein T, Brinsden H, Neveux M, Cavalcanti OB, Barquera S, Baur L, et al. World obesity atlas 2022. (2022). Available at: https://www.worldobesityday.org/assets/downloads/World_Obesity_Atlas_2022_Web.pdf
7. Knop FK. EJE PRIZE 2018: A gut feeling about glucagon. Eur J Endocrinol (2018) 178(6):R267–R80. doi: 10.1530/EJE-18-0197
8. Janah L, Kjeldsen S, Galsgaard KD, Winther-Sørensen M, Stojanovska E, Pedersen J, et al. Glucagon receptor signaling and glucagon resistance. Int J Mol Sci (2019) 20(13):3314. doi: 10.3390/ijms20133314
9. Holst JJ, Wewer Albrechtsen NJ, Pedersen J, Knop FK. Glucagon and amino acids are linked in a mutual feedback cycle: The liver-α-Cell axis. Diabetes (2017) 66(2):235–40. doi: 10.2337/db16-0994
10. Dean ED, Li M, Prasad N, Wisniewski SN, Von Deylen A, Spaeth J, et al. Interrupted glucagon signaling reveals hepatic α cell axis and role for l-glutamine in α cell proliferation. Cell Metab (2017) 25(6):1362–73.e5. doi: 10.1016/j.cmet.2017.05.011
11. Boden G, Master RW, Rezvani I, Palmer JP, Lobe TE, Owen OE. Glucagon deficiency and hyperaminoacidemia after total pancreatectomy. J Clin Invest. (1980) 65(3):706–16. doi: 10.1172/JCI109717
12. Muller WA, Berger M, Suter P, Cüppers HJ, Reiter J, Wyss T, et al. Glucagon immunoreactivities and amino acid profile in plasma of duodenopancreatectomized patients. J Clin Invest. (1979) 63(5):820–7. doi: 10.1172/JCI109381
13. Winther-Sørensen M, Galsgaard KD, Santos A, Trammell SAJ, Sulek K, Kuhre RE, et al. Glucagon acutely regulates hepatic amino acid catabolism and the effect may be disturbed by steatosis. Mol Metab (2020) 42:101080. doi: 10.1016/j.molmet.2020.101080
14. Solloway MJ, Madjidi A, Gu C, Eastham-Anderson J, Clarke HJ, Kljavin N, et al. Glucagon couples hepatic amino acid catabolism to mTOR-dependent regulation of α-cell mass. Cell Rep (2015) 12(3):495–510. doi: 10.1016/j.celrep.2015.06.034
15. Suppli MP, Lund A, Bagger JI, Vilsbøll T, Knop FK. Involvement of steatosis-induced glucagon resistance in hyperglucagonaemia. Med Hypotheses. (2016) 86:100–3. doi: 10.1016/j.mehy.2015.10.029
16. Longuet C, Robledo AM, Dean ED, Dai C, Ali S, McGuinness I, et al. Liver-specific disruption of the murine glucagon receptor produces α-cell hyperplasia: evidence for a circulating α-cell growth factor. Diabetes (2013) 62(4):1196–205. doi: 10.2337/db11-1605
17. Kim J, Okamoto H, Huang Z, Anguiano G, Chen S, Liu Q, et al. Amino acid transporter Slc38a5 controls glucagon receptor inhibition-induced pancreatic α cell hyperplasia in mice. Cell Metab (2017) 25(6):1348–61.e8. doi: 10.1016/j.cmet.2017.05.006
18. Gromada J, Franklin I, Wollheim CB. Alpha-cells of the endocrine pancreas: 35 years of research but the enigma remains. Endocr Rev (2007) 28(1):84–116. doi: 10.1210/er.2006-0007
19. Reaven GM, Chen YD, Golay A, Swislocki AL, Jaspan JB. Documentation of hyperglucagonemia throughout the day in nonobese and obese patients with noninsulin-dependent diabetes mellitus. J Clin Endocrinol Metab (1987) 64(1):106–10. doi: 10.1210/jcem-64-1-106
20. Wewer Albrechtsen NJ, Færch K, Jensen TM, Witte DR, Pedersen J, Mahendran Y, et al. Evidence of a liver-alpha cell axis in humans: hepatic insulin resistance attenuates relationship between fasting plasma glucagon and glucagonotropic amino acids. Diabetologia (2018) 61(3):671–80. doi: 10.1007/s00125-017-4535-5
21. Galsgaard KD. The vicious circle of hepatic glucagon resistance in non-alcoholic fatty liver disease. J Clin Med (2020) 9(12):4049. doi: 10.3390/jcm9124049
22. Wewer Albrechtsen NJ, Pedersen J, Galsgaard KD, Winther-Sørensen M, Suppli MP, Janah L, et al. The liver-α-Cell axis and type 2 diabetes. Endocr Rev (2019) 40(5):1353–66. doi: 10.1210/er.2018-00251
23. Mu J, Qureshi SA, Brady EJ, Muise ES, Candelore MR, Jiang G, et al. Anti-diabetic efficacy and impact on amino acid metabolism of GRA1, a novel small-molecule glucagon receptor antagonist. PloS One (2012) 7(11):e49572. doi: 10.1371/journal.pone.0049572
24. Junker AE, Gluud L, Holst JJ, Knop FK, Vilsbøll T. Diabetic and nondiabetic patients with nonalcoholic fatty liver disease have an impaired incretin effect and fasting hyperglucagonaemia. J Intern Med (2016) 279(5):485–93. doi: 10.1111/joim.12462
25. Ferrannini E, Muscelli E, Natali A, Gabriel R, Mitrakou A, Flyvbjerg A, et al. Association of fasting glucagon and proinsulin concentrations with insulin resistance. Diabetologia (2007) 50(11):2342–7. doi: 10.1007/s00125-007-0806-x
26. Hayashi Y, Seino Y. Regulation of amino acid metabolism and α-cell proliferation by glucagon. J Diabetes Investig (2018) 9(3):464–72. doi: 10.1111/jdi.12797
27. John AM, Schwartz RA. Glucagonoma syndrome: a review and update on treatment. J Eur Acad Dermatol Venereol. (2016) 30(12):2016–22. doi: 10.1111/jdv.13752
28. Galsgaard KD, Winther-Sørensen M, Ørskov C, Kissow H, Poulsen SS, Vilstrup H, et al. Disruption of glucagon receptor signaling causes hyperaminoacidemia exposing a possible liver-alpha-cell axis. Am J Physiol Endocrinol Metab (2018) 314(1):E93–E103. doi: 10.1152/ajpendo.00198.2017
29. Assan R, Attali JR, Ballerio G, Boillot J, Girard JR. Glucagon secretion induced by natural and artificial amino acids in the perfused rat pancreas. Diabetes (1977) 26(4):300–7. doi: 10.2337/diab.26.4.300
30. Kuhara T, Ikeda S, Ohneda A, Sasaki Y. Effects of intravenous infusion of 17 amino acids on the secretion of GH, glucagon, and insulin in sheep. Am J Physiol (1991) 260(1 Pt 1):E21–6. doi: 10.1152/ajpendo.1991.260.1.E21
31. Pipeleers DG, Schuit FC, Van Schravendijk CF, Van de Winkel M. Interplay of nutrients and hormones in the regulation of glucagon release. Endocrinology (1985) 117(3):817–23. doi: 10.1210/endo-117-3-817
32. Rocha DM, Faloona GR, Unger RH. Glucagon-stimulating activity of 20 amino acids in dogs. J Clin Invest. (1972) 51(9):2346–51. doi: 10.1172/JCI107046
33. Unger RH, Ohneda A, Aguilar-Parada E, Eisentraut AM. The role of aminogenic glucagon secretion in blood glucose homeostasis. J Clin Invest. (1969) 48(5):810–22. doi: 10.1172/JCI106039
34. Wendt A, Eliasson L. Pancreatic α-cells - the unsung heroes in islet function. Semin Cell Dev Biol (2020) 103:41–50. doi: 10.1016/j.semcdb.2020.01.006
35. Ahrén B. Autonomic regulation of islet hormone secretion–implications for health and disease. Diabetologia (2000) 43(4):393–410. doi: 10.1007/s001250051322
36. Dean ED. A primary role for α-cells as amino acid sensors. Diabetes (2020) 69(4):542–9. doi: 10.2337/dbi19-0021
37. Briant LJB, Dodd MS, Chibalina MV, Rorsman NJG, Johnson PRV, Carmeliet P, et al. CPT1a-dependent long-chain fatty acid oxidation contributes to maintaining glucagon secretion from pancreatic islets. Cell Rep (2018) 23(11):3300–11. doi: 10.1016/j.celrep.2018.05.035
38. Walker JN, Ramracheya R, Zhang Q, Johnson PR, Braun M, Rorsman P. Regulation of glucagon secretion by glucose: paracrine, intrinsic or both? Diabetes Obes Metab (2011) 13 Suppl 1:95–105. doi: 10.1111/j.1463-1326.2011.01450.x
39. Zeigerer A, Sekar R, Kleinert M, Nason S, Habegger KM, Müller TD. Glucagon’s metabolic action in health and disease. Compr Physiol (2021) 11(2):1759–83. doi: 10.1002/cphy.c200013
40. Ellenbroek JH, Töns HAM, Hanegraaf MAJ, Rabelink TJ, Engelse MA, Carlotti F, et al. Pancreatic α-cell mass in obesity. Diabetes Obes Metab (2017) 19(12):1810–3. doi: 10.1111/dom.12997
41. Pedersen JS, Rygg MO, Kristiansen VB, Olsen BH, Serizawa RR, Holst JJ, et al. Nonalcoholic fatty liver disease impairs the liver-alpha cell axis independent of hepatic inflammation and fibrosis. Hepatol Commun (2020) 4(11):1610–23. doi: 10.1002/hep4.1562
42. Gar C, Haschka SJ, Kern-Matschilles S, Rauch B, Sacco V, Prehn C, et al. The liver-alpha cell axis associates with liver fat and insulin resistance: a validation study in women with non-steatotic liver fat levels. Diabetologia (2021) 64(3):512–20. doi: 10.1007/s00125-020-05334-x
43. Ramnanan CJ, Edgerton DS, Kraft G, Cherrington AD. Physiologic action of glucagon on liver glucose metabolism. Diabetes Obes Metab (2011) 13 Suppl 1:118–25. doi: 10.1111/j.1463-1326.2011.01454.x
44. Mitrakou A, Kelley D, Veneman T, Jenssen T, Pangburn T, Reilly J, et al. Contribution of abnormal muscle and liver glucose metabolism to postprandial hyperglycemia in NIDDM. Diabetes (1990) 39(11):1381–90. doi: 10.2337/diab.39.11.1381
45. Knop FK, Aaboe K, Vilsbøll T, Vølund A, Holst JJ, Krarup T, et al. Impaired incretin effect and fasting hyperglucagonaemia characterizing type 2 diabetic subjects are early signs of dysmetabolism in obesity. Diabetes Obes Metab (2012) 14(6):500–10. doi: 10.1111/j.1463-1326.2011.01549.x
46. Færch K, Pilgaard K, Knop FK, Hansen T, Pedersen O, Jørgensen T, et al. Incretin and pancreatic hormone secretion in Caucasian non-diabetic carriers of the TCF7L2 rs7903146 risk T allele. Diabetes Obes Metab (2013) 15(1):91–5. doi: 10.1111/j.1463-1326.2012.01675.x
47. Mitrakou A, Kelley D, Mokan M, Veneman T, Pangburn T, Reilly J, et al. Role of reduced suppression of glucose production and diminished early insulin release in impaired glucose tolerance. N Engl J Med (1992) 326(1):22–9. doi: 10.1056/NEJM199201023260104
48. Wewer Albrechtsen NJ. Glucagon receptor signaling in metabolic diseases. Peptides (2018) 100:42–7. doi: 10.1016/j.peptides.2017.11.016
49. Holst JJ, Holland W, Gromada J, Lee Y, Unger RH, Yan H, et al. Insulin and glucagon: Partners for life. Endocrinology (2017) 158(4):696–701. doi: 10.1210/en.2016-1748
50. Kazda CM, Ding Y, Kelly RP, Garhyan P, Shi C, Lim CN, et al. Evaluation of efficacy and safety of the glucagon receptor antagonist LY2409021 in patients with type 2 diabetes: 12- and 24-week phase 2 studies. Diabetes Care (2016) 39(7):1241–9. doi: 10.2337/dc15-1643
51. Wewer Albrechtsen NJ, Hartmann B, Veedfald S, Windeløv JA, Plamboeck A, Bojsen-Møller KN, et al. Hyperglucagonaemia analysed by glucagon sandwich ELISA: nonspecific interference or truly elevated levels? Diabetologia (2014) 57(9):1919–26. doi: 10.1007/s00125-014-3283-z
52. Bak MJ, Albrechtsen NW, Pedersen J, Hartmann B, Christensen M, Vilsbøll T, et al. Specificity and sensitivity of commercially available assays for glucagon and oxyntomodulin measurement in humans. Eur J Endocrinol (2014) 170(4):529–38. doi: 10.1530/EJE-13-0941
53. Wagner R, Hakaste LH, Ahlqvist E, Heni M, Machann J, Schick F, et al. Nonsuppressed glucagon after glucose challenge as a potential predictor for glucose tolerance. Diabetes (2017) 66(5):1373–9. doi: 10.2337/db16-0354
54. Junker AE. The role of incretin hormones and glucagon in patients with liver disease. Dan Med J (2017) 64(5):B5363.
55. Wang C, Xiao Y, Wang J, Hou N, Cui W, Hu X, et al. Dynamic changes in insulin and glucagon during disease progression in rhesus monkeys with obesity-related type 2 diabetes mellitus. Diabetes Obes Metab (2019) 21(5):1111–20. doi: 10.1111/dom.13624
56. Koopman ADM, Beulens JW, van der Heijden A, Elders P, Dekker JM, Alssema M, et al. A prospective study on glucagon responses to oral glucose and mixed meal and 7-year change in fasting glucose. Clin Endocrinol (Oxf). (2019) 91(1):82–6. doi: 10.1111/cen.13977
57. Engelbrechtsen L, Mahendran Y, Jonsson A, Gjesing AP, Weeke PE, Jørgensen ME, et al. Common variants in the hERG (KCNH2) voltage-gated potassium channel are associated with altered fasting and glucose-stimulated plasma incretin and glucagon responses. BMC Genet (2018) 19(1):15. doi: 10.1186/s12863-018-0602-2
58. Gar C, Rottenkolber M, Sacco V, Moschko S, Banning F, Hesse N, et al. Patterns of plasma glucagon dynamics do not match metabolic phenotypes in young women. J Clin Endocrinol Metab (2018) 103(3):972–82. doi: 10.1210/jc.2017-02014
59. Kosuda M, Watanabe K, Koike M, Morikawa A, Saito H, Kohno G, et al. Glucagon response to glucose challenge in patients with idiopathic postprandial syndrome. J Nippon Med Sch. (2022) 89(1):102–7. doi: 10.1272/jnms.JNMS.2022_89-205
60. Ichikawa R, Takano K, Fujimoto K, Motomiya T, Kobayashi M, Kitamura T, et al. Basal glucagon hypersecretion and response to oral glucose load in prediabetes and mild type 2 diabetes. Endocr J (2019) 66(8):663–75. doi: 10.1507/endocrj.EJ18-0372
61. Jonsson A, Stinson SE, Torekov SS, Clausen TD, Færch K, Kelstrup L, et al. Genome-wide association study of circulating levels of glucagon during an oral glucose tolerance test. BMC Med Genomics (2021) 14(1):3. doi: 10.1186/s12920-020-00841-7
62. Manell H, Staaf J, Manukyan L, Kristinsson H, Cen J, Stenlid R, et al. Altered plasma levels of glucagon, GLP-1 and glicentin during OGTT in adolescents with obesity and type 2 diabetes. J Clin Endocrinol Metab (2016) 101(3):1181–9. doi: 10.1210/jc.2015-3885
63. Sjögren RJO, Rizo-Roca D, Chibalin AV, Chorell E, Furrer R, Katayama S, et al. Branched-chain amino acid metabolism is regulated by ERRα in primary human myotubes and is further impaired by glucose loading in type 2 diabetes. Diabetologia (2021) 64(9):2077–91. doi: 10.1007/s00125-021-05481-9
64. Wang Q, Jokelainen J, Auvinen J, Puukka K, Keinänen-Kiukaanniemi S, Järvelin MR, et al. Insulin resistance and systemic metabolic changes in oral glucose tolerance test in 5340 individuals: an interventional study. BMC Med (2019) 17(1):217. doi: 10.1186/s12916-019-1440-4
65. Li Q, Gu W, Ma X, Liu Y, Jiang L, Feng R, et al. Amino acid and biogenic amine profile deviations in an oral glucose tolerance test: A comparison between healthy and hyperlipidaemia individuals based on targeted metabolomics. Nutrients (2016) 8(6):379. doi: 10.3390/nu8060379
66. Geidenstam N, Danielsson AP, Spégel P, Ridderstråle M. Changes in glucose-elicited blood metabolite responses following weight loss and long term weight maintenance in obese individuals with impaired glucose tolerance. Diabetes Res Clin Pract (2016) 113:187–97. doi: 10.1016/j.diabres.2015.12.024
67. Liu L, Feng R, Guo F, Li Y, Jiao J, Sun C. Targeted metabolomic analysis reveals the association between the postprandial change in palmitic acid, branched-chain amino acids and insulin resistance in young obese subjects. Diabetes Res Clin Pract (2015) 108(1):84–93. doi: 10.1016/j.diabres.2015.01.014
68. Tricò D, Prinsen H, Giannini C, de Graaf R, Juchem C, Li F, et al. Elevated α-hydroxybutyrate and branched-chain amino acid levels predict deterioration of glycemic control in adolescents. J Clin Endocrinol Metab (2017) 102(7):2473–81. doi: 10.1210/jc.2017-00475
69. Goffredo M, Santoro N, Tricò D, Giannini C, D’Adamo E, Zhao H, et al. A branched-chain amino acid-related metabolic signature characterizes obese adolescents with non-alcoholic fatty liver disease. Nutrients (2017) 9(7):642. doi: 10.3390/nu9070642
70. Giannini C, Pietropaoli N, Polidori N, Chiarelli F, Marcovecchio ML, Mohn A. Increased GLP-1 response to oral glucose in pre-pubertal obese children. J Pediatr Endocrinol Metab (2016) 29(8):901–6. doi: 10.1515/jpem-2016-0050
71. Kahn SE, Mather KJ, Arslanian SA, Barengolts E, Buchanan TA, Caprio S, et al. Hyperglucagonemia does not explain the β-cell hyperresponsiveness and insulin resistance in dysglycemic youth compared with adults: Lessons from the RISE study. Diabetes Care (2021) 44(9):1961–9. doi: 10.2337/dc21-0460
72. Suzuki Y, Kido J, Matsumoto S, Shimizu K, Nakamura K. Associations among amino acid, lipid, and glucose metabolic profiles in childhood obesity. BMC Pediatr (2019) 19(1):273. doi: 10.1186/s12887-019-1647-8
73. Christensen M, Vedtofte L, Holst JJ, Vilsbøll T, Knop FK. Glucose-dependent insulinotropic polypeptide: a bifunctional glucose-dependent regulator of glucagon and insulin secretion in humans. Diabetes (2011) 60(12):3103–9. doi: 10.2337/db11-0979
74. Jiang G, Zhang BB. Glucagon and regulation of glucose metabolism. Am J Physiol Endocrinol Metab (2003) 284(4):E671–8. doi: 10.1152/ajpendo.00492.2002
75. Müller TD, Finan B, Clemmensen C, DiMarchi RD, Tschöp MH. The new biology and pharmacology of glucagon. Physiol Rev (2017) 97(2):721–66. doi: 10.1152/physrev.00025.2016
76. Heimberg H, De Vos A, Pipeleers D, Thorens B, Schuit F. Differences in glucose transporter gene expression between rat pancreatic alpha- and beta-cells are correlated to differences in glucose transport but not in glucose utilization. J Biol Chem (1995) 270(15):8971–5. doi: 10.1074/jbc.270.15.8971
77. Yasuda K, Yamada Y, Inagaki N, Yano H, Okamoto Y, Tsuji K, et al. Expression of GLUT1 and GLUT2 glucose transporter isoforms in rat islets of langerhans and their regulation by glucose. Diabetes (1992) 41(1):76–81. doi: 10.2337/diab.41.1.76
78. Quesada I, Tudurí E, Ripoll C, Nadal A. Physiology of the pancreatic alpha-cell and glucagon secretion: role in glucose homeostasis and diabetes. J Endocrinol (2008) 199(1):5–19. doi: 10.1677/JOE-08-0290
79. Habegger KM, Heppner KM, Geary N, Bartness TJ, DiMarchi R, Tschöp MH. The metabolic actions of glucagon revisited. Nat Rev Endocrinol (2010) 6(12):689–97. doi: 10.1038/nrendo.2010.187
80. Bankir L, Bouby N, Speth RC, Velho G, Crambert G. Glucagon revisited: Coordinated actions on the liver and kidney. Diabetes Res Clin Pract (2018) 146:119–29. doi: 10.1016/j.diabres.2018.10.004
81. Vieira E, Liu YJ, Gylfe E. Involvement of alpha1 and beta-adrenoceptors in adrenaline stimulation of the glucagon-secreting mouse alpha-cell. Naunyn Schmiedebergs Arch Pharmacol (2004) 369(2):179–83. doi: 10.1007/s00210-003-0858-5
82. De Marinis YZ, Salehi A, Ward CE, Zhang Q, Abdulkader F, Bengtsson M, et al. GLP-1 inhibits and adrenaline stimulates glucagon release by differential modulation of n- and l-type Ca2+ channel-dependent exocytosis. Cell Metab (2010) 11(6):543–53. doi: 10.1016/j.cmet.2010.04.007
83. Hamilton A, Zhang Q, Salehi A, Willems M, Knudsen JG, Ringgaard AK, et al. Adrenaline stimulates glucagon secretion by Tpc2-dependent Ca. Diabetes (2018) 67(6):1128–39. doi: 10.2337/db17-1102
84. Hevener AL, Bergman RN, Donovan CM. Novel glucosensor for hypoglycemic detection localized to the portal vein. Diabetes (1997) 46(9):1521–5. doi: 10.2337/diab.46.9.1521
85. Battezzati A, Simonson DC, Luzi L, Matthews DE. Glucagon increases glutamine uptake without affecting glutamine release in humans. Metabolism (1998) 47(6):713–23. doi: 10.1016/S0026-0495(98)90036-1
86. Brand CL, Jørgensen PN, Svendsen I, Holst JJ. Evidence for a major role for glucagon in regulation of plasma glucose in conscious, nondiabetic, and alloxan-induced diabetic rabbits. Diabetes (1996) 45(8):1076–83. doi: 10.2337/diab.45.8.1076
87. Brand CL, Jørgensen PN, Knigge U, Warberg J, Svendsen I, Kristensen JS, et al. Role of glucagon in maintenance of euglycemia in fed and fasted rats. Am J Physiol (1995) 269(3 Pt 1):E469–77. doi: 10.1152/ajpendo.1995.269.3.E469
88. Brand CL, Rolin B, Jørgensen PN, Svendsen I, Kristensen JS, Holst JJ. Immunoneutralization of endogenous glucagon with monoclonal glucagon antibody normalizes hyperglycaemia in moderately streptozotocin-diabetic rats. Diabetologia (1994) 37(10):985–93. doi: 10.1007/BF00400461
89. Gelling RW, Du XQ, Dichmann DS, Romer J, Huang H, Cui L, et al. Lower blood glucose, hyperglucagonemia, and pancreatic alpha cell hyperplasia in glucagon receptor knockout mice. Proc Natl Acad Sci U S A. (2003) 100(3):1438–43. doi: 10.1073/pnas.0237106100
90. Hojlund K, Wildner-Christensen M, Eshøj O, Skjaerbaek C, Holst JJ, Koldkjaer O, et al. Reference intervals for glucose, beta-cell polypeptides, and counterregulatory factors during prolonged fasting. Am J Physiol Endocrinol Metab (2001) 280(1):E50–8. doi: 10.1152/ajpendo.2001.280.1.E50
91. Felig P. The glucose-alanine cycle. Metabolism (1973) 22(2):179–207. doi: 10.1016/0026-0495(73)90269-2
92. Göpel SO, Kanno T, Barg S, Weng XG, Gromada J, Rorsman P. Regulation of glucagon release in mouse -cells by KATP channels and inactivation of TTX-sensitive na+ channels. J Physiol (2000) 528(Pt 3):509–20. doi: 10.1111/j.1469-7793.2000.00509.x
93. Ishihara H, Maechler P, Gjinovci A, Herrera PL, Wollheim CB. Islet beta-cell secretion determines glucagon release from neighbouring alpha-cells. Nat Cell Biol (2003) 5(4):330–5. doi: 10.1038/ncb951
94. Franklin I, Gromada J, Gjinovci A, Theander S, Wollheim CB. Beta-cell secretory products activate alpha-cell ATP-dependent potassium channels to inhibit glucagon release. Diabetes (2005) 54(6):1808–15. doi: 10.2337/diabetes.54.6.1808
95. Olsen HL, Theander S, Bokvist K, Buschard K, Wollheim CB, Gromada J. Glucose stimulates glucagon release in single rat alpha-cells by mechanisms that mirror the stimulus-secretion coupling in beta-cells. Endocrinology (2005) 146(11):4861–70. doi: 10.1210/en.2005-0800
96. Elliott AD, Ustione A, Piston DW. Somatostatin and insulin mediate glucose-inhibited glucagon secretion in the pancreatic α-cell by lowering cAMP. Am J Physiol Endocrinol Metab (2015) 308(2):E130–43. doi: 10.1152/ajpendo.00344.2014
97. Yu Q, Shuai H, Ahooghalandari P, Gylfe E, Tengholm A. Glucose controls glucagon secretion by directly modulating cAMP in alpha cells. Diabetologia (2019) 62(7):1212–24. doi: 10.1007/s00125-019-4857-6
98. Tengholm A, Gylfe E. cAMP signalling in insulin and glucagon secretion. Diabetes Obes Metab (2017) 19 Suppl 1:42–53. doi: 10.1111/dom.12993
99. Hughes JW, Ustione A, Lavagnino Z, Piston DW. Regulation of islet glucagon secretion: Beyond calcium. Diabetes Obes Metab (2018) 20 Suppl 2:127–36. doi: 10.1111/dom.13381
100. Ramracheya R, Ward C, Shigeto M, Walker JN, Amisten S, Zhang Q, et al. Membrane potential-dependent inactivation of voltage-gated ion channels in alpha-cells inhibits glucagon secretion from human islets. Diabetes (2010) 59(9):2198–208. doi: 10.2337/db09-1505
101. Gerich JE, Langlois M, Noacco C, Karam JH, Forsham PH. Lack of glucagon response to hypoglycemia in diabetes: evidence for an intrinsic pancreatic alpha cell defect. Science (1973) 182(4108):171–3. doi: 10.1126/science.182.4108.171
102. Bolli GB, Gerich JE. The “dawn phenomenon”–a common occurrence in both non-insulin-dependent and insulin-dependent diabetes mellitus. N Engl J Med (1984) 310(12):746–50. doi: 10.1056/NEJM198403223101203
103. Biggers DW, Myers SR, Neal D, Stinson R, Cooper NB, Jaspan JB, et al. Role of brain in counterregulation of insulin-induced hypoglycemia in dogs. Diabetes (1989) 38(1):7–16. doi: 10.2337/diab.38.1.7
104. Bolli G, De Feo P, Perriello G, De Cosmo S, Compagnucci P, Santeusanio F, et al. Mechanisms of glucagon secretion during insulin-induced hypoglycemia in man. role of the beta cell and arterial hyperinsulinemia. J Clin Invest. (1984) 73(4):917–22. doi: 10.1172/JCI111315
105. Lefebvre PJ, Luyckx AS. Glucagon and diabetes: a reappraisal. Diabetologia (1979) 16(6):347–54. doi: 10.1007/BF01223153
106. Almdal TP. Importance of glucagon for nitrogen loss in diabetes–via an accelerated hepatic conversion of amino nitrogen to urea nitrogen. Dan Med Bull (1991) 38(2):113–20.
107. Li XC, Liao TD, Zhuo JL. Long-term hyperglucagonaemia induces early metabolic and renal phenotypes of type 2 diabetes in mice. Clin Sci (Lond). (2008) 114(9):591–601. doi: 10.1042/CS20070257
108. Gosmain Y, Masson MH, Philippe J. Glucagon: the renewal of an old hormone in the pathophysiology of diabetes. J Diabetes (2013) 5(2):102–9. doi: 10.1111/1753-0407.12022
109. Lefèbvre PJ, Paquot N, Scheen AJ. Inhibiting or antagonizing glucagon: making progress in diabetes care. Diabetes Obes Metab (2015) 17(8):720–5. doi: 10.1111/dom.12480
110. Unger RH, Cherrington AD. Glucagonocentric restructuring of diabetes: a pathophysiologic and therapeutic makeover. J Clin Invest. (2012) 122(1):4–12. doi: 10.1172/JCI60016
111. Shen DM, Lin S, Parmee ER. A survey of small molecule glucagon receptor antagonists from recent patents (2006 - 2010). Expert Opin Ther Pat. (2011) 21(8):1211–40. doi: 10.1517/13543776.2011.587001
112. Scheen AJ, Paquot N, Lefèbvre PJ. Investigational glucagon receptor antagonists in phase I and II clinical trials for diabetes. Expert Opin Investig Drugs (2017) 26(12):1373–89. doi: 10.1080/13543784.2017.1395020
113. Junker AE, Gluud LL, van Hall G, Holst JJ, Knop FK, Vilsbøll T. Effects of glucagon-like peptide-1 on glucagon secretion in patients with non-alcoholic fatty liver disease. J Hepatol (2016) 64(4):908–15. doi: 10.1016/j.jhep.2015.11.014
114. Knudsen JG, Hamilton A, Ramracheya R, Tarasov AI, Brereton M, Haythorne E, et al. Dysregulation of glucagon secretion by hyperglycemia-induced sodium-dependent reduction of ATP production. Cell Metab (2019) 29(2):430–42.e4. doi: 10.1016/j.cmet.2018.10.003
115. Marchesini G, Forlani G, Zoli M, Angiolini A, Scolari MP, Bianchi FB, et al. Insulin and glucagon levels in liver cirrhosis. relationship with plasma amino acid imbalance of chronic hepatic encephalopathy. Dig. Dis Sci (1979) 24(8):594–601. doi: 10.1007/BF01333703
116. Holst JJ, Burcharth F, Kühl C. Pancreatic glucoregulatory hormones in cirrhosis of the liver: portal vein concentrations during intravenous glucose tolerance test and in response to a meal. Diabete Metab (1980) 6(2):117–27.
117. Bugianesi E, Kalhan S, Burkett E, Marchesini G, McCullough A. Quantification of gluconeogenesis in cirrhosis: response to glucagon. Gastroenterology (1998) 115(6):1530–40. doi: 10.1016/S0016-5085(98)70033-2
118. McGarry JD, Foster DW. Regulation of hepatic fatty acid oxidation and ketone body production. Annu Rev Biochem (1980) 49:395–420. doi: 10.1146/annurev.bi.49.070180.002143
119. Knop FK, Vilsbøll T, Madsbad S, Holst JJ, Krarup T. Inappropriate suppression of glucagon during OGTT but not during isoglycaemic i.v. glucose infusion contributes to the reduced incretin effect in type 2 diabetes mellitus. Diabetologia (2007) 50(4):797–805. doi: 10.1007/s00125-006-0566-z
120. Knop FK, Vilsbøll T, Højberg PV, Larsen S, Madsbad S, Vølund A, et al. Reduced incretin effect in type 2 diabetes: cause or consequence of the diabetic state? Diabetes (2007) 56(8):1951–9. doi: 10.2337/db07-0100
121. Muscelli E, Mari A, Casolaro A, Camastra S, Seghieri G, Gastaldelli A, et al. Separate impact of obesity and glucose tolerance on the incretin effect in normal subjects and type 2 diabetic patients. Diabetes (2008) 57(5):1340–8. doi: 10.2337/db07-1315
122. Oh TJ, Kim MY, Shin JY, Lee JC, Kim S, Park KS, et al. The incretin effect in Korean subjects with normal glucose tolerance or type 2 diabetes. Clin Endocrinol (Oxf). (2014) 80(2):221–7. doi: 10.1111/cen.12167
123. Kilberg MS, Barber EF, Handlogten ME. Characteristics and hormonal regulation of amino acid transport system a in isolated rat hepatocytes. Curr Top Cell Regul (1985) 25:133–63. doi: 10.1016/B978-0-12-152825-6.50009-6
124. Lim SK, Cynober L, De Bandt JP, Aussel C. A na(+)-dependent system a and ASC-independent amino acid transport system stimulated by glucagon in rat hepatocytes. Cell Biol Int (1999) 23(1):7–12. doi: 10.1006/cbir.1998.0321
125. Lacey JH, Bradford NM, Joseph SK, McGivan JD. Increased activity of phosphate-dependent glutaminase in liver mitochondria as a result of glucagon treatment of rats. Biochem J (1981) 194(1):29–33. doi: 10.1042/bj1940029
126. Vilstrup H, Hansen BA, Almdal TP. Glucagon increases hepatic efficacy for urea synthesis. J Hepatol (1990) 10(1):46–50. doi: 10.1016/0168-8278(90)90072-Y
127. Hamberg O, Vilstrup H. Regulation of urea synthesis by glucose and glucagon in normal man. Clin Nutr (1994) 13(3):183–91. doi: 10.1016/0261-5614(94)90099-X
128. Petersen KF, Hansen BA, Vilstrup H. Time dependent stimulating effect of glucagon on the capacity of urea-n synthesis in rats. Horm Metab Res (1987) 19(2):53–6. doi: 10.1055/s-2007-1011737
129. Almdal TP, Holst JJ, Heindorff H, Vilstrup H. Glucagon immunoneutralization in diabetic rats normalizes urea synthesis and decreases nitrogen wasting. Diabetes (1992) 41(1):12–6. doi: 10.2337/diab.41.1.12
130. Hamberg O, Vilstrup H. Effects of insulin and glucose on urea synthesis in normal man, independent of pancreatic hormone secretion. J Hepatol (1994) 21(3):381–7. doi: 10.1016/S0168-8278(05)80317-4
131. Kraft G, Coate KC, Winnick JJ, Dardevet D, Donahue EP, Cherrington AD, et al. Glucagon’s effect on liver protein metabolism in vivo. Am J Physiol Endocrinol Metab (2017) 313(3):E263–E72. doi: 10.1152/ajpendo.00045.2017
132. Galsgaard KD, Winther-Sørensen M, Pedersen J, Kjeldsen SAS, Rosenkilde MM, Wewer Albrechtsen NJ, et al. Glucose and amino acid metabolism in mice depend mutually on glucagon and insulin receptor signaling. Am J Physiol Endocrinol Metab (2019) 316(4):E660–E73. doi: 10.1152/ajpendo.00410.2018
133. Charlton MR, Adey DB, Nair KS. Evidence for a catabolic role of glucagon during an amino acid load. J Clin Invest. (1996) 98(1):90–9. doi: 10.1172/JCI118782
134. Otten J, Stomby A, Waling M, Chorell E, Ryberg M, Svensson M, et al. The liver-alpha-cell axis after a mixed meal and during weight loss in type 2 diabetes. Endocr Connect. (2021) 10(9):1101–10. doi: 10.1530/EC-21-0171
135. Müller WA, Faloona GR, Unger RH. The effect of alanine on glucagon secretion. J Clin Invest. (1971) 50(10):2215–8. doi: 10.1172/JCI106716
136. Galsgaard KD, Jepsen SL, Kjeldsen SAS, Pedersen J, Wewer Albrechtsen NJ, Holst JJ. Alanine, arginine, cysteine, and proline, but not glutamine, are substrates for, and acute mediators of, the liver-α-cell axis in female mice. Am J Physiol Endocrinol Metab (2020) 318(6):E920–E9. doi: 10.1152/ajpendo.00459.2019
137. Stancáková A, Civelek M, Saleem NK, Soininen P, Kangas AJ, Cederberg H, et al. Hyperglycemia and a common variant of GCKR are associated with the levels of eight amino acids in 9,369 Finnish men. Diabetes (2012) 61(7):1895–902. doi: 10.2337/db11-1378
138. Gonzalez-Franquesa A, Burkart AM, Isganaitis E, Patti ME. What have metabolomics approaches taught us about type 2 diabetes? Curr Diabetes Rep (2016) 16(8):74. doi: 10.1007/s11892-016-0763-1
139. Eisenstein AB, Strack I. Amino acid stimulation of glucagon secretion by perifused islets of high-protein-fed rats. Diabetes (1978) 27(4):370–6. doi: 10.2337/diab.27.4.370
140. Gaggini M, Carli F, Rosso C, Buzzigoli E, Marietti M, Della Latta V, et al. Altered amino acid concentrations in NAFLD: Impact of obesity and insulin resistance. Hepatology (2018) 67(1):145–58. doi: 10.1002/hep.29465
141. Wewer Albrechtsen NJ, Junker AE, Christensen M, Hædersdal S, Wibrand F, Lund AM, et al. Hyperglucagonemia correlates with plasma levels of non-branched-chain amino acids in patients with liver disease independent of type 2 diabetes. Am J Physiol Gastrointest. Liver Physiol (2018) 314(1):G91–G6. doi: 10.1152/ajpgi.00216.2017
142. Thiessen SE, Derde S, Derese I, Dufour T, Vega CA, Langouche L, et al. Role of glucagon in catabolism and muscle wasting of critical illness and modulation by nutrition. Am J Respir Crit Care Med (2017) 196(9):1131–43. doi: 10.1164/rccm.201702-0354OC
143. Kelly RA, Fitches MJ, Webb SD, Pop SR, Chidlow SJ. Modelling the effects of glucagon during glucose tolerance testing. Theor Biol Med Model (2019) 16(1):21. doi: 10.1186/s12976-019-0115-3
144. Lund A, Bagger JI, Wewer Albrechtsen NJ, Christensen M, Grøndahl M, Hartmann B, et al. Evidence of extrapancreatic glucagon secretion in man. Diabetes (2016) 65(3):585–97. doi: 10.2337/db15-1541
145. Cosentino RG, Churilla JR, Josephson S, Molle-Rios Z, Hossain MJ, Prado WL, et al. Branched-chain amino acids and relationship with inflammation in youth with obesity: A randomized controlled intervention study. J Clin Endocrinol Metab (2021) 106(11):3129–39. doi: 10.1210/clinem/dgab538
146. Tricò D, Caprio S, Rosaria Umano G, Pierpont B, Nouws J, Galderisi A, et al. Metabolic features of nonalcoholic fatty liver (NAFL) in obese adolescents: Findings from a multiethnic cohort. Hepatology (2018) 68(4):1376–90. doi: 10.1002/hep.30035
147. Mahendran Y, Jonsson A, Have CT, Allin KH, Witte DR, Jørgensen ME, et al. Genetic evidence of a causal effect of insulin resistance on branched-chain amino acid levels. Diabetologia (2017) 60(5):873–8. doi: 10.1007/s00125-017-4222-6
148. Yang R, Dong J, Zhao H, Li H, Guo H, Wang S, et al. Association of branched-chain amino acids with carotid intima-media thickness and coronary artery disease risk factors. PloS One (2014) 9(6):e99598. doi: 10.1371/journal.pone.0099598
149. Adeva-Andany MM, López-Maside L, Donapetry-García C, Fernández-Fernández C, Sixto-Leal C. Enzymes involved in branched-chain amino acid metabolism in humans. Amino Acids (2017) 49(6):1005–28. doi: 10.1007/s00726-017-2412-7
150. Bloomgarden Z. Diabetes and branched-chain amino acids: What is the link? J Diabetes (2018) 10(5):350–2. doi: 10.1111/1753-0407.12645
151. Zhang S, Zeng X, Ren M, Mao X, Qiao S. Novel metabolic and physiological functions of branched chain amino acids: a review. J Anim Sci Biotechnol (2017) 8:10. doi: 10.1186/s40104-016-0139-z
152. Gar C, Rottenkolber M, Prehn C, Adamski J, Seissler J, Lechner A. Serum and plasma amino acids as markers of prediabetes, insulin resistance, and incident diabetes. Crit Rev Clin Lab Sci (2018) 55(1):21–32. doi: 10.1080/10408363.2017.1414143
153. Hernández-Alvarez MI, Díaz-Ramos A, Berdasco M, Cobb J, Planet E, Cooper D, et al. Early-onset and classical forms of type 2 diabetes show impaired expression of genes involved in muscle branched-chain amino acids metabolism. Sci Rep (2017) 7(1):13850. doi: 10.1038/s41598-017-14120-6
154. Wang Q, Holmes MV, Davey Smith G, Ala-Korpela M. Genetic support for a causal role of insulin resistance on circulating branched-chain amino acids and inflammation. Diabetes Care (2017) 40(12):1779–86. doi: 10.2337/dc17-1642
155. Moher D, Liberati A, Tetzlaff J, Altman DG, Group P. Preferred reporting items for systematic reviews and meta-analyses: the PRISMA statement. PloS Med (2009) 6(7):e1000097. doi: 10.1371/journal.pmed.1000097
156. Raddatz D, Rossbach C, Buchwald A, Scholz KH, Ramadori G, Nolte W. Fasting hyperglucagonemia in patients with transjugular intrahepatic portosystemic shunts (TIPS). Exp Clin Endocrinol Diabetes (2005) 113(5):268–74. doi: 10.1055/s-2005-837546
157. Suppli MP, Bagger JI, Lund A, Demant M, van Hall G, Strandberg C, et al. Glucagon resistance at the level of amino acid turnover in obese subjects with hepatic steatosis. Diabetes (2020) 69(6):1090–9. doi: 10.2337/db19-0715
158. Huising MO. Paracrine regulation of insulin secretion. Diabetologia (2020) 63(10):2057–63. doi: 10.1007/s00125-020-05213-5
159. Elder DA, Prigeon RL, Wadwa RP, Dolan LM, D’Alessio DA. Beta-cell function, insulin sensitivity, and glucose tolerance in obese diabetic and nondiabetic adolescents and young adults. J Clin Endocrinol Metab (2006) 91(1):185–91. doi: 10.1210/jc.2005-0853
160. Stinson SE, Jonsson AE, de Retana Alzola IF, Lund MAV, Frithioff-Bøjsøe C, Aas Holm L, et al. Hyperglucagonemia in pediatric adiposity associates with cardiometabolic risk factors but not hyperglycemia. J Clin Endocrinol Metab (2022) 107(6):1569–76. doi: 10.1210/clinem/dgac108
161. Færch K, Torekov SS, Vistisen D, Johansen NB, Witte DR, Jonsson A, et al. GLP-1 response to oral glucose is reduced in prediabetes, screen-detected type 2 diabetes, and obesity and influenced by sex: The ADDITION-PRO study. Diabetes (2015) 64(7):2513–25. doi: 10.2337/db14-1751
162. Lomenick JP, White JR, Smart EJ, Clasey JL, Anderson JW. Glucagon-like peptide 1 and pancreatic polypeptide responses to feeding in normal weight and overweight children. J Pediatr Endocrinol Metab (2009) 22(6):493–500. doi: 10.1515/JPEM.2009.22.6.493
163. Yeow TP, Pacini G, Tura A, Hor CP, Lim SL, Tan FH, et al. Preserved glucagon-like peptide-1 responses to oral glucose, but reduced incretin effect, insulin secretion and sensitivity in young asians with type 2 diabetes mellitus. BMJ Open Diabetes Res Care (2017) 5(1):e000352. doi: 10.1136/bmjdrc-2016-000352
Keywords: liver-alpha cell axis, glucagon, glucose, liver, OGTT, pediatric
Citation: Pixner T, Stummer N, Schneider AM, Lukas A, Gramlinger K, Julian V, Thivel D, Mörwald K, Mangge H, Dalus C, Aigner E, Furthner D, Weghuber D and Maruszczak K (2023) The relationship between glucose and the liver-alpha cell axis – A systematic review. Front. Endocrinol. 13:1061682. doi: 10.3389/fendo.2022.1061682
Received: 04 October 2022; Accepted: 13 December 2022;
Published: 05 January 2023.
Edited by:
Aneta Monika Gawlik, Medical University of Silesia, PolandReviewed by:
Edgar Zenteno, National Autonomous University of Mexico, MexicoTamer Coskun, Eli Lilly, United States
Copyright © 2023 Pixner, Stummer, Schneider, Lukas, Gramlinger, Julian, Thivel, Mörwald, Mangge, Dalus, Aigner, Furthner, Weghuber and Maruszczak. This is an open-access article distributed under the terms of the Creative Commons Attribution License (CC BY). The use, distribution or reproduction in other forums is permitted, provided the original author(s) and the copyright owner(s) are credited and that the original publication in this journal is cited, in accordance with accepted academic practice. No use, distribution or reproduction is permitted which does not comply with these terms.
*Correspondence: Daniel Weghuber, d.weghuber@salk.at