


Malnutrition in all its forms (wasting/thinness, stunting/short stature, anaemia, overweight and obesity) is a world public health problem. Globally, one in three people is malnourished in one form or another(1). Malnutrition results from the interaction of poor-quality diets and poor-quality health, care environments and behaviours, which are shaped by political instability, poor economic development, conflict, inequality and globalization(1). The complex interplay of these determinants results in substantial health disparities, showing that malnutrition is not equally distributed according to social indicators(Reference Van de Poel, Hosseinpoor and Speybroeck2,Reference Arcaya, Arcaya and Subramanian3) . Socio-economic disparities in malnutrition denote the degree to which the prevalence of malnutrition in all its forms differs between more and less socially and economically advantaged groups(Reference Van de Poel, Hosseinpoor and Speybroeck2).
Latin America is one of the most inequitable areas in the world and while some countries such as Brazil, Colombia and the Dominican Republic have reduced inequalities in some nutritional outcomes (e.g. stunting in children aged <5 years), others like Guatemala have not(Reference Restrepo-Méndez, Barros and Requejo4,Reference Galicia, de Romana and Harding5) . In Guatemala, we have documented that the double burden of malnutrition is more prevalent in indigenous than in non-indigenous populations, both at household and individual levels(Reference Ramirez-Zea, Kroker-Lobos and Close-Fernandez6). However, data about how malnutrition in all its forms distributes across other socio-economic indicators (e.g. wealth status and educational level) for the subsequent identification of social disparities in health are lacking.
In the last decades, Guatemala has been focusing its efforts and interventions to address stunting, leaving aside other forms of malnutrition. Since the 1990s, Guatemala promoted a Food and Nutrition Security Initiative, which currently has a legal basis and a specific law, that established the National System of Food and Nutrition Security in 2005(7). More recently, two national strategies to address stunting, the Zero Hunger Plan and the National Strategy for the Prevention of Chronic Malnutrition 2016–2020, have been implemented(8). In 2018, a law initiative to address overweight and obesity was developed(9).
Identification of population groups at higher risk of malnutrition in all its forms will inform public health policy and aid in the design of appropriately targeted interventions to reduce health disparities(Reference Arcaya, Arcaya and Subramanian3). Therefore, our objective was to analyse disparities in malnutrition in all its forms by wealth, educational level and ethnicity in children aged <5 years, adolescent girls and women of reproductive age (WRA) in Guatemala.
Methods
Study population
We used available data from the 2014–2015 National Maternal and Child Health Survey done in Guatemala(10). A multistage, random, stratified cluster-sampling procedure was used to select a nationally representative sample. The survey was composed of 11 962 children aged <5 years, 1086 adolescent girls aged 15–19 years and 11 354 WRA aged 20–49 years. A detailed description of the sampling and data collection methods is given elsewhere(10).
Socio-economic indicators (wealth, education) and ethnicity
The National Maternal and Child Health Survey provided data on a wealth index that was developed using principal component analysis. The technique of principal component analysis generates a set of uncorrelated principal components. The first component is that which explains the greatest amount of variance and is commonly used to define the asset index(11). Weights are assigned to each of the assets or access to services (ownership of a motor vehicle (car, van, truck or motorcycle), television, refrigerator; the availability of electricity, clean water, toilet; and floor material of the household dwelling) and an aggregated score can be calculated for each of the surveyed households within a population. Then, this wealth index was categorized into tertiles (tertile 1, low wealth; tertile 2, medium wealth; tertile 3, high wealth).
Educational level was classified as low for 0–6 years completed years of education, medium for >6 to 12 years, and high for >12 years. For children and adolescent girls, we used the mother’s educational level and for WRA we used their own years of schooling. Ethnicity was defined as indigenous when respondents self-reported as being indigenous.
Malnutrition indicators
As indicators of malnutrition, we considered wasting/underweight, stunting/short stature (undernutrition), overweight, obesity, and overweight or obesity (excess BMI).
Malnutrition indicators were defined based on the 2006 WHO Child Growth Standards for children aged <5 years and the Child Growth Reference data for 5–19 years for adolescent girls(12,Reference de Onis, Onyango and Borghi13) . Wasting was defined as weight-for-height Z-score (WHZ) < −2 for children aged <5 years; BMI-for-age Z-score (BMIZ) < −2 for adolescents aged 15–19 years; and for women aged 20–49 years, thinness was defined as BMI < 18·5 kg/m2. Stunting was defined as height-for-age Z-score (HAZ) < −2 for children aged <5 years and adolescent girls aged 15–19 years; and short stature was defined as height < 149 cm for women aged 20–49 years(12). Overweight was defined as BMIZ > +2 and ≤+3 for children aged <5 years; BMIZ > +1 and ≤+2 for adolescent girls aged 15–19 years; and BMI ≥ 25 and <30 kg/m2 for women aged 20–49 years.
Obesity was defined as BMIZ > +3 for children aged <5 years; BMIZ > +2 for adolescent girls aged 15–19 years; and BMI ≥ 30 kg/m2 for women aged 20–49 years(12). We combined overweight and obesity into an overweight/obesity category using BMIZ > +2 for children aged <5 years; BMIZ > +1 for adolescent girls aged 15–19 years; and BMI ≥ 25 kg/m2 for women aged 20–49 years.
Statistical analysis
We estimated the national prevalence and 95 % CI for underweight/thinness, stunting/short stature, overweight and obesity in children aged <5 years, adolescent girls and WRA. Then, we evaluated whether the prevalence of all forms of malnutrition differed according different groups (e.g. wealth tertiles, categories of educational level, indigenous and non-indigenous population) by using linear combinations of estimators. This method is useful for viewing prevalence ratios or other estimators (e.g. odds ratios, hazard ratios) for one group relative to another groups(Reference Rubin and Weisberg14). P values of <0·05 were considered to indicate statistical significance. Disparities are shown as the ratio of low-to-high wealth tertile; low-to-high educational level; and indigenous to non-indigenous(11). All analyses considered the complex survey sampling design by using the ‘SVY’ module and sampling weights in the statistical software package Stata version 14.0.
Results
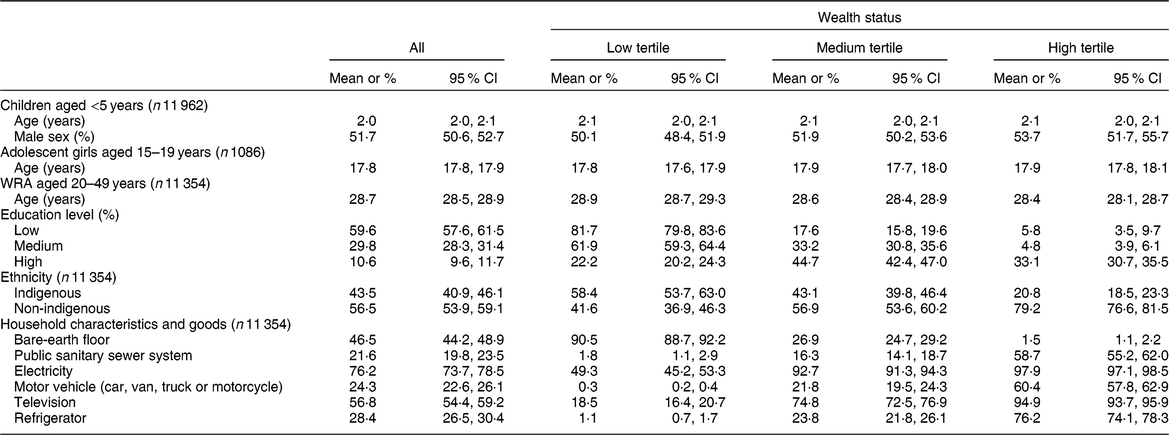
Mean age was 2·0 (95 % CI 2·0, 2·1) years in children, 17·8 (95 % CI 17·8, 17·9) years in adolescent girls and 28·7 (95 % CI 28·5, 28·9) years in WRA. More than half of WRA (59·6 %) reported a low educational level and 43·5 % of them were indigenous. Low-wealth-tertile households were characterized by having a high proportion of bare-earth floor (90·5 %) and lack of a public sanitary sewer system (98·2 %), electricity (50·7 %) and television ownership (81·5 %). In addition, low-wealth-tertile households were characterized as containing less-educated and indigenous women. Medium-wealth-tertile households were characterized by having a high proportion of electricity service (92·7 %) and television ownership (74·8 %). High-wealth-tertile households were characterized by having a high proportion of electricity service (97·9 %), television (94·9 %), motor vehicle (60·4 %) and refrigerator ownership (76·2 %; Table 1).
Table 1 Sample characteristics, overall and by tertile of wealth status, in Guatemala, 2014–2015 (data are from the National Maternal and Child Health Survey 2014–2015)
WRA, women of reproductive age.
Education level is based on years of education and is based on mother’s education level for children and adolescents.
* P < 0·05 v. low tertile/low education/indigenous.
† P < 0·05 v. medium tertile/medium education.
Malnutrition in all its forms in Guatemalan population
Wasting/thinness national prevalence among children, adolescent girls and WRA was low (<1·5 %) as expected. In contrast, stunting/short stature national prevalence was 46·7 (95 % CI 45·0, 48·6) % among children, 52·4 (95 % CI 48·3, 51·7) % among adolescent girls and 50·4 (95 % CI 48·7, 52·1) % among WRA. Overweight/obesity national prevalence was 4·9 (95 % CI 4·4, 5·5) % among children, 28·4 (95 % CI 25·7, 31·1) % among adolescent girls and 56·6 (95 % CI 55·7, 57·5) % among WRA (Table 2).
Table 2 Prevalence of malnutrition in all its forms by wealth status, educational level and ethnicity in vulnerable groups, Guatemala 2014–2015 (data are from the National Maternal and Child Health Survey 2014–2015)

WRA, women of reproductive age; WHZ, weight-for-height Z-score; BMIZ, BMI-for-age Z-score; HAZ, height-for-age Z-score.
Education level is based on years of education and is based on mother’s education level for children and adolescents.
* P < 0·05 v. low tertile/low education/indigenous.
† P < 0·05 v. medium tertile/medium education.
‡ Wasting: WHZ < −2 for children aged <5 years; and BMIZ < −2 for adolescent girls aged 15–19 years. Thinness: BMI < 18·5 kg/m2 for women aged 20–49 years.
§ Stunting: HAZ < −2 for children aged <5 years; and HAZ < −2 for adolescent girls aged 15–19 years. Short stature: height < 149 cm for women aged 20–49 years.
‖ Overweight: BMIZ > +2 and ≤+3 for children aged <5 years; BMIZ > +1 and ≤+2 for adolescent girls aged 15–19 years; and BMI ≥ 25 and <30 kg/m2 for women aged 20–49 years.
¶ Obesity: BMIZ > +3 for children aged <5 years; BMIZ > +2 for adolescent girls aged 15–19 years; and BMI ≥ 30 kg/m2 for women aged 20–49 years.
‡‡ Overweight/obesity: BMIZ > +2 for children aged <5 years; BMIZ > +1 for adolescent girls aged 15–19 years; and BMI ≥25 kg/m2 for women aged 20–49 years.
We found that stunting/short stature was more prevalent among low-income, low-educated and indigenous Guatemalan populations. In contrast, we found that overweight/obesity was more prevalent among high-income, more-educated and non-indigenous populations in children aged <5 years, adolescent girls and WRA (Table 2 and Fig. 1).

Fig. 1 Prevalence of stunting/short stature and overweight/obesity by (a) wealth status (![]() , low tertile;
, low tertile; ![]() , medium tertile;
, medium tertile; ![]() , high tertile), (b) education level (
, high tertile), (b) education level (![]() , low, 0–6 years;
, low, 0–6 years; ![]() , medium, 7–12 years;
, medium, 7–12 years; ![]() , high, >12 years) and (c) ethnicity (
, high, >12 years) and (c) ethnicity (![]() , indigenous;
, indigenous; ![]() , non-indigenous) among children aged <5 years (n 11 962), adolescent girls aged 15–19 years (n 1086) and women aged 20–49 years (women of reproductive age (WRA); n 11 354) in Guatemala. Education level is based on years of education and is based on mother’s education level for children and adolescents. *P < 0·05 v. low tertile/low education/indigenous; †P < 0·05 v. medium tertile/medium education. (Data are from the National Maternal and Child Health Survey 2014–2015)
, non-indigenous) among children aged <5 years (n 11 962), adolescent girls aged 15–19 years (n 1086) and women aged 20–49 years (women of reproductive age (WRA); n 11 354) in Guatemala. Education level is based on years of education and is based on mother’s education level for children and adolescents. *P < 0·05 v. low tertile/low education/indigenous; †P < 0·05 v. medium tertile/medium education. (Data are from the National Maternal and Child Health Survey 2014–2015)
Disparities in malnutrition by wealth status in Guatemala
Wasting/thinness prevalence among children was not significantly different by wealth status. However, among adolescent girls, those who were high-income and non-indigenous had a greater prevalence of thinness compared with their low-income and indigenous counterparts. In WRA, the non-indigenous had a greater prevalence of thinness. Meanwhile, stunting/short stature and overweight/obesity showed great disparities by wealth status in children, adolescent girls and WRA. The prevalence of stunting/short stature in these age groups was 2·8 (62·0 % compared with 22·2 %; P < 0·05), 2·1 (68·3 % compared with 33·3 %; P < 0·05) and 2·0 (62·8 % compared with 31·1 %; P < 0·05) times significantly higher in the poorest wealth tertile than in the richest tertile, respectively. Finally, the prevalence of overweight/obesity in these same age groups was 1·6 (6·8 % compared with 4·3 %; P < 0·05), 2·1 (40·8 % compared with 19·3 %; P < 0·05) and 1·8 (75·4 % compared with 41·7 %; P < 0·05) times significantly higher in the richest wealth tertile than in the poorest, respectively (Table 2 and Fig. 1).
Disparities in malnutrition by educational level in Guatemala
Wasting/thinness prevalence among children and adolescent girls was not significantly different by mothers’ educational level, whereas among WRA it was significantly different among educational groups. The prevalence of wasting/thinness in WRA was 1·7 (1·7 % compared with 1·0 %; P < 0·05) times significantly higher in the medium educational level than in the lower level, respectively. Stunting/short stature and overweight/obesity showed great disparities by educational level in children, adolescent girls and WRA. The prevalence of stunting/short stature in these age groups was 2·9 (57·9 % compared with 19·7 %; P < 0·05), 2·9 (59·4 % compared with 20·4 %; P < 0·05) and 2·1 (59·6 % compared with 28·3 %; P < 0·05) times significantly higher in the lower educational level than in the highest level, respectively. Finally, the prevalence of overweight/obesity in these age groups was 1·6 (6·2 % compared with 4·0 %; P < 0·05), 1·3 (36·4 % compared with 27·2 %; P < 0·05) and 1·3 (68·1 % compared with 53·5 %; P < 0·05) times significantly higher in the higher educational level than in the lowest level, respectively (Table 2 and Fig. 1).
Disparities in malnutrition by ethnicity in Guatemala
Wasting/thinness prevalence among children was not significantly different among indigenous and non-indigenous populations, whereas it was significantly different according to ethnicity among adolescent girls and WRA. The prevalence of wasting/thinness in these age groups was 1·3 (0·8 % compared with 0·6 %; P < 0·05) and 2·6 (1·8 % compared with 0·7 %; P < 0·05) times significantly higher in the non-indigenous than in the indigenous, respectively. Stunting/short stature and overweight/obesity showed great disparities by ethnicity in children, adolescent girls and WRA. The prevalence of stunting/short stature in these age groups was 1·7 (60·1 % compared with 36·4 %; P < 0·05), 1·7 (67·8 % compared with 40·1 %; P < 0·05) and 1·6 (64·0 % compared with 39·8 %; P < 0·05) times significantly higher in indigenous than in non-indigenous, respectively. In contrast, the prevalence of overweight/obesity was higher in the non-indigenous population in all age groups. The prevalence of overweight/obesity in these age groups was 1·3 (5·4 % compared with 4·3 %; P < 0·05), 1·7 (34·7 % compared with 20·6 %; P < 0·05) and 1·3 (62·0 % compared with 49·4 %; P < 0·05) times significantly higher in non-indigenous than in indigenous, respectively (Table 2 and Fig. 1).
Discussion
The main finding of the present study was that stunting/short stature affected the poorest, less educated and indigenous two times more than the richest, more educated and non-indigenous in all vulnerable groups. At the same time, overweight/obesity affected to a greater extent the wealthiest, more educated and non-indigenous populations in children, adolescent girls and WRA. These results indicate that Guatemala is in the first stage of the obesity transition(Reference Jaacks, Vandevijvere and Pan15). Stage 1 of the obesity transition is characterized by a high prevalence of obesity in WRA, a higher prevalence in those with higher socio-economic status than their counterparts with low socio-economic status and a higher prevalence in adults than in children(Reference Jaacks, Vandevijvere and Pan15). It is highly likely that we are transiting to stage 2 because the prevalence of obesity in WRA is above 20 % but in children remains nearer to 5 %.
Over the last decades, stunting has shown a slow decline amounting to only one percentage point per year(Reference Martorell16). Unless effective policies and programmes are implemented, it will take more than four decades to eradicate stunting in Guatemala(Reference Martorell16). In addition, interventions that do not have an equity focus may inadvertently exacerbate disparities, even when national averages indicate overall improvements(11,Reference Carrera, Azrack and Begkoyian17) .
Similar results have been shown in previous studies in Guatemala(Reference Ramirez-Zea, Kroker-Lobos and Close-Fernandez6). We showed that the double burden of malnutrition is more prevalent in indigenous populations at the household and individual levels(Reference Ramirez-Zea, Kroker-Lobos and Close-Fernandez6). Given generations of stunting in indigenous children, this may be linked to long-term vulnerability to obesity and obesity-related non-communicable diseases(Reference Montenegro and Stephens18,Reference Kline, Jones-Smith and Jaime Miranda19) inadvertently exacerbating disparities in the long term. Our results show that Guatemala is in a situation of extreme vulnerability, facing a nutrition paradox that requires the implementation of effective and integrated equity-based policies to reduce both poverty and all forms of malnutrition. Moreover, not addressing health disparities will preserve a vicious cycle of poverty and malnutrition in all its forms. Yet progress on ending all forms of malnutrition is still limited and insufficient, and it remains a serious concern.
In the last decades, Guatemala has been focusing its efforts and interventions to address stunting, leaving aside other forms of malnutrition. Therefore, there is a need to scale up key nutrition-specific interventions and leverage existing actions (e.g. the National Strategy for the Prevention of Chronic Malnutrition 2016–2020) designed to address one type of malnutrition to simultaneously reduce other types(Reference Hawkes, Demaio and Branca20).
Recently, Guatemala has been working to improve its culture of monitoring and evaluation. The intervention Plan Hambre Cero (Zero Hunger Plan) 2012–2015 aiming to address stunting and food insecurity among rural and poorer families was evaluated, showing that the interventions implemented had not been effective at reducing stunting in children aged <5 years(21). Therefore, in the current National Strategy for the Prevention of Chronic Malnutrition 2016–2020, which was approved in 2016 and which targets children under 2 years of age living in seven departments with higher rates of stunting and indigenous populations(8), the Government took account of recommendations derived from the Zero Hunger Plan impact evaluation and restructured the strategy’s components and geographically targeted population. This strategy implements evidence-based nutrition-specific interventions during the 1000 d window of opportunity such as micronutrient supplementation, promotion and protection of exclusive breast-feeding, improving maternal nutrition and antenatal care, and the promotion of appropriate early and complementary feeding in infants(8). This strategy will address stunting and anaemia disparities focusing on disadvantaged populations. However, although it is expected that these improvements will decrease stunting prevalence in the medium and long terms, still lacking are double-duty actions to address overweight and obesity and to ensure that current interventions designed to address stunting do not raise the longer-term risks posed by other forms of malnutrition(Reference Hawkes, Demaio and Branca20,Reference Doak, Campos Ponce and Vossenaar22) .
Conditional cash transfers (CCT) are considered nutrition-sensitive interventions because their main objective is to reduce poverty and social vulnerability through the delivery of services designed to increase access to health care and education and to improve nutritional status(Reference Galicia, de Romana and Harding5,Reference Segura-Perez, Grajeda and Perez-Escamilla23) . Latin American countries such as Brazil, Colombia and Mexico have reported a positive impact of CCT on child nutrition and health outcomes, providing an opportunity to integrate nutrition actions in intersectoral platforms(Reference Galicia, de Romana and Harding5,Reference Segura-Perez, Grajeda and Perez-Escamilla23) . Therefore, this is an area of opportunity to improve or reform the implementation of CCT in our country, as their aim is to address social determinants of health and to break the intergenerational cycle of poverty(Reference Segura-Perez, Grajeda and Perez-Escamilla23). Since 2015, the Ministry of Social Development of Guatemala has been implementing a CCT pilot programme targeted to pregnant women and families in poverty and extreme poverty with children under 2 years old in a limited number of municipalities. Therefore, to accelerate our progress in reducing the alarmingly high prevalence of stunting in children (~0·5–1·0 % points/year), our main challenges are to: enhance and expand the quality and coverage of nutrition-specific interventions; maximize the nutrition sensitivity of interventions, such as agriculture, social protection, water and sanitation endorsed by high-level political authority; scale up resources for nutrition with transparent tracking of nutrition budget lines within the health and allied sectors; achieve the awareness of civil society; and ensure political commitment and continued implementation of national policies, strategies and interventions in a regular and sustained way across elections and governments(Reference Ruel and Alderman24–Reference Olney, Leroy and Bliznashka26).
The more socially advantaged Guatemalan population is more affected by overweight/obesity likely due to changes in dietary patterns because of the high availability of ultra-processed foods and urbanization, the transition to sedentary lifestyles and exposure to obesogenic environments across the life course (e.g. aggressive and unethical marketing of breast-milk substitutes and products with high content of sugar, fat and sodium). This indicates that we are currently facing stage 1 of the obesity transition(Reference Jaacks, Vandevijvere and Pan15). To address this epidemic and prevent increasing overweight and obesity rates in children, adolescents and WRA, evidence has shown that food environment regulations such as effective front-of-pack nutrition labelling systems, restriction of marketing targeted to children and the implementation of fiscal measures (e.g. taxes on sugar-sweetened beverages and energy-dense foods)(Reference Cecchini, Sassi and Lauer27) are interventions that enable a healthier food supply and the adoption of healthier diets at the population level(Reference Swinburn, Sacks and Hall28–Reference Nakhimovsky, Feigl and Avila30). Therefore, their implementation in Guatemala will be key to curb the overweight and obesity epidemic. Some efforts have been made. For example, the School-Feeding Law (Ley de Alimentación Escolar, Decreto 16-2017) was enacted in 2017(31). This law includes an increase in the amount allocated to each student for school meals, the implementation of educational vegetable gardens at schools and public purchases from family farming. It took the previous national budgetary allocation for school meals from $US 0·15 per child per school day up to $US 0·41 by the start of 2018 and followed by a further increase to $US 0·54 slated for 2019(31). The increase will help guarantee healthy meals and adequate portions for school-aged children. Furthermore, since 2018 the Guatemalan Government and academic institutions have been promoting a Law Initiative for ‘Healthy Food Promotion’ that includes mandatory front-of-pack warning labels, a ban on advertisements and sales promotions of ultra-processed food products that target children and adolescents, and the inclusion of nutritional education on the curricula of public and private schools(9). This will help to attenuate the transition to stage 2 of the obesity transition. In addition, following Mexico’s experiences will be helpful as it is moving to integrated interventions to address all forms of malnutrition (stunting, anaemia and overweight/obesity) by focusing on interventions during pregnancy and the first 2 years of life to promote linear growth, as well as implementing food environment regulations that will contribute with the prevention of rapid weight gain at population level(Reference Galicia, de Romana and Harding5,Reference Victora and Rivera32) .
Our study had strengths and limitations. We are using the most updated data with national representation. In addition, we are showing a complete representation of population health rather than just the national average. It is key to assess stunting and overweight/obesity rates at sub-national levels to better inform programmes and policies, and to generate new hypotheses regarding the underlying mechanisms leading to all forms of malnutrition. Moreover, including adolescent girls is a great advance as this age group represents an additional window of opportunity to target in nutrition programmes and to improve our life-cycle approach to reduce the intergenerational effects of all forms of malnutrition. However, our analysis might not fully explain the relationship between social disparities and all forms of malnutrition, as we did not consider macro-level contextual factors. Also, by using the ratio of low-to-high wealth tertile and low-to-high educational level to show disparities we ignored other subgroups (e.g. medium level) as they were not being compared.
Conclusion
In conclusion, stunting/short stature was more prevalent among the low-income, low-educated and indigenous populations. In contrast, overweight/obesity prevalence was higher among those from higher-income, more-educated and non-indigenous populations. These outcomes demonstrate socio-economic and ethnic disparities for malnutrition in all its forms, the high double burden of malnutrition at population level and that Guatemala is currently in the first stage of the obesity transition. Therefore, a national priority should be given to generate a common agenda and a set of equity- and evidence-based multisectoral policies and interventions to address all forms of malnutrition.
Acknowledgements
Acknowledgements: The authors would like to thank the Latin American Nutrition Leadership Program (Programa LILANUT) for the coordination of the supplement ‘Malnutrition in all its forms by wealth, education and ethnicity in Latin America: who are more affected?’. Financial support: DSM Nutritional Products provided funds for the publication of this manuscript. DSM Nutritional Products had no role in the design, analysis or writing of this article. Conflict of interest: None of the authors declared a conflict of interest. Authorship: M.M. designed the study, oversaw the development of the overall research plan, conducted the statistical analysis and wrote the manuscript. M.F.K.-L. contributed to the statistical analysis and critically reviewed the manuscript. M.R.-Z. contributed to and critically reviewed the manuscript. M.M. has primary responsibility for the final content. All the authors read and approved the final manuscript. Ethics of human subject participation: Not applicable.


