


Severe acute malnutrition (SAM) is defined as a low weight-for-height/length (severe wasting; below −3 sd of the median weight-for-height/length of the WHO growth standards), or the presence of visible severe wasting or nutritional oedema, or in children aged 6–59 months, a mid-upper arm circumference (MUAC) of <115 mm( 1 ). Management of SAM was estimated to be the most important nutrition intervention to scale up; at 90 % coverage, this mediation could save between 285 000 and 482 000 lives per year( Reference Bhutta, Das and Rizvi 2 ). Community-based management is recommended for the overwhelming majority (~85 %) of children with uncomplicated SAM, including specially formulated diets like ready-to-use therapeutic foods( 1 , Reference Lenters, Wazny and Webb 3 ).
Accurate recording of weight and height/length and their subsequent translation into weight-for-height/length Z-scores can be quite challenging in community settings for health workers. Several large community management of acute malnutrition programmes are therefore increasingly utilizing MUAC to identify SAM. This measurement offers advantages because it requires minimal equipment and is simple, relatively inexpensive and reasonably accurate. However, there can be substantial disagreement between the two anthropometric criteria (weight-for-height/length and MUAC) for identifying children with SAM( Reference Walters, Sibson and McGrath 4 – Reference Laillou, Prak and de Groot 9 ). Thus, remedial suggestions have included an increase in the MUAC cut-off( Reference Laillou, Prak and de Groot 9 ) and that the two anthropometric criteria should be used independently to diagnose acute malnutrition( Reference Grellety and Golden 6 ). Further, the MUAC cut-off of 115 mm was based predominantly on African data. It is plausible that the association between MUAC and weight-for-height varies in South Asian settings; for example, it is now established that for a specific BMI, Asians have a higher percentage of body fat than Europeans( 10 ). The present cross-sectional study was therefore designed to evaluate the predictive ability of various MUAC cut-offs for detecting severe wasting among children aged 6–59 months in a rural area of Meerut District, Uttar Pradesh, India.
Subjects and methods
The current community-based cross-sectional study was conducted between September 2012 and October 2013 in Meerut District, Uttar Pradesh, India. Uttar Pradesh State had a high prevalence of severe wasting (5·1 %) among children under 5 years old in the National Family Health Survey 3( 11 ). Two adjoining rural blocks were identified and their seventy contiguous villages were selected.
The research team members were trained in the methodology of undertaking surveys, recording anthropometry, assessment of age including use of a calendar of local events, and clinical examination for severe visible wasting and bipedal oedema. The training was imparted by two authors (U.K. and R.B.) and experts from the National Institute of Nutrition, Hyderabad, India. Services of village-level health and nutrition functionaries like anganwadi workers, auxiliary nurse midwives and accredited social health activists were utilized for identification of households with children under 5 years of age. However, these functionaries did not participate in any process of data collection including anthropometric measurements.
Children between 6 and 59 months old who were permanent residents of the study area and were not expected to migrate were eligible for inclusion. Children with severe illnesses and physical deformities were excluded. Eligible children likely to be present in each village were estimated from the National Census, 2011. House visits were undertaken to locate them. Subjects who were temporarily unavailable were visited again. ‘Mopping-up’ of each village was done for 2–3 d to ensure inclusion of the maximum number of eligible children. After written informed consent from parents, eligible children were evaluated by the trained research team at local anganwadi centres or health sub-centres or schools. Ethical clearance was obtained from the All India Institute of Medical Sciences.
Sociodemographic profile was recorded on a pre-tested proforma. Exact age was verified through the child’s birth certificate, horoscope or hospital record. If such verification was not possible, age was assessed through a local event calendar. Children born on any date of the month were counted as born on the first day of the month. Anthropometric measurements were conducted using standard techniques( 12 ). Length was measured for infants below 24 months of age using a SECA 417 infantometer and height was measured for children 24–59 months old using a SECA 213 digital stadiometer, with a least count of 0·1 cm. Weight to the nearest 10 g was recorded using a SECA 383 digital weighing scale with minimal clothing. MUAC was measured by a SECA 212 fibreglass tape to the nearest 0·1 cm. The weighing scales, infantometer and stadiometer were calibrated on a weekly basis prior to data collection with standard weights (1, 2 and 5 kg) and a metre rod (100 cm). Technical errors of measurement for inter-observer and intra-observer variations were below 2 %. Each child was also clinically examined for visible severe wasting and bipedal oedema. WHO reference Z-scores were calculated for three anthropometric indices (length/height-for-age, weight-for-age and weight-for-length/height)( 13 ).
Parents or caregivers of SAM children were given appropriate nutritional counselling by the project staff and these subjects were referred to the nearest primary health centre for further management. At the time of conducting the study, there was no dedicated community management of SAM programme in Uttar Pradesh State.
Statistical methods
Sample size considerations were based on identification of an MUAC cut-off that had a sensitivity of at least 70 %, with absolute precision of 5 % and 95 % CI, and a non-response rate of 5 %. The Rapid Survey on Children India, conducted in 2013–2014, had documented the prevalence of severe wasting in children under 5 years as 1·5 % (Siddharth Nagar and Sultanpur) and 1·8 % (Sitapur) in neighbouring districts( 14 ). The anticipated prevalence of severe wasting in study area was presumed to be 1·8 %. We were thus required to approach 19 400 subjects for enrolling 336 severely wasted participants; however, we approached 19 449 children.
Data analysis was performed using the statistical software packages IBM SPSS Statistics version 20.0 and Stata version 12.0. The receiver-operating characteristic (ROC) curve, sensitivity, specificity, positive and negative predictive values, and positive and negative likelihood ratios were calculated for identification of severe wasting with various MUAC cut-offs. Multiple regression and logistic regression analyses were conducted to evaluate the associations between MUAC and age and sex of the child.
Study oversight
The study was approved by the Government of India and the Uttar Pradesh State Government. Oversight was provided by the National Research Alliance for SAM established by the Indian Government. An independent institution (Clinical Development Services Agency) periodically audited the study and provided recommendations.
Results
Among the 19 449 children approached through house-to-house survey, 278 were excluded due to deformities while 186 were not within the age range of 6–59 months. Of the remaining 18 985 children, length/height was available for 18 595, weight for 18 474 and MUAC for 18 499. We further excluded eleven children from the data set because of unacceptable Z-scores (n 2), visible severe wasting (n 8) and bipedal oedema (n 1). The final data set for analysis comprised 18 456 children for whom both weight-for-height Z-score (WHZ; n 18 463) and MUAC were available. There were 9858 (53·4 %) boys. The mean (sd) age was 2·72 (1·29) years; children aged <12, 12–24 and >24 months comprised 11·9, 22·3 and 65·8 % of the sample, respectively.
Severe wasting was observed in 2·2 % of participants (409/18 463; 95 % CI 2·02, 2·44 %). The prevalence declined with increasing age (P = 0·001), with estimates in age groups of 6–11, 12–23, 24–35, 36–47 and 48–59 months being 4·2, 3·3, 1·6, 1·2 and 1·7 %, respectively. Severe stunting (height-for-age Z-score<−3) was documented in 16·2 % and moderate stunting (height-for-age Z-score ≥−3 to –2) in 29·1 % of 17 786 children for whom the exact date of birth was available. The prevalence of severe stunting (WHZ<–3) in age groups 6–11, 12–23, 24–35, 36–47 and 48–59 months was 11·9, 19·3, 20·5, 16·2 and 11·0 %, respectively.
Figure 1 depicts the ROC curve, whereas Table 1 summarizes the diagnostic test accuracies for varying MUAC cut-offs with severe wasting as the ‘gold standard’. The area under the ROC curve was 0·933. Across the lower range of MUAC cut-offs (110–120 mm), specificity was excellent (99·1–99·9 %) but sensitivity was poor (13·4–37·2 %); with higher cut-offs (140–150 mm), sensitivity increased substantially (94·9–98·8 %) but at the expense of specificity (37·6–71·9 %). With <115 mm as MUAC cut-off, 76·8 % of subjects with severe wasting were missed but only 0·3 % of screened negatives were severely wasted. The optimal MUAC cut-off to detect severe wasting was 135 mm; only 11·7 % of subjects with severe wasting were missed while 15·4 % of screened negatives were severely wasted.
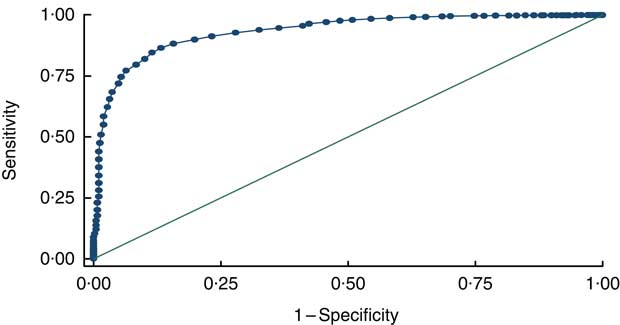
Fig. 1 Receiver-operating characteristic (ROC) curve plotting the sensitivity and specificity of different mid-upper arm circumference cut-offs for detecting severe wasting (weight-for-height Z-score<–3 as the ‘gold standard) among children (n 18 456) aged 6–59 months, rural Uttar Pradesh, India, September 2012–October 2013 (area under the ROC curve = 0·9334)
Table 1 Diagnostic test accuracy measures for varying cut-offs of mid-upper arm circumference (MUAC) in predicting severe wasting (weight-for-height Z-score<–3 as the ‘gold standard) among children (n 18 456) aged 6–59 months, rural Uttar Pradesh, India, September 2012–October 2013
Table 2 summarizes the prevalence of SAM using various combinations of MUAC cut-offs and WHZ<−3. The prevalence of severe wasting was constant at 2·2 %. However, the prevalence of MUAC screened positive increased substantially with higher cut-offs, with values of 0·76 % and 17·00 % for <115 and <135 mm, respectively. The corresponding burden of SAM, defined as either severe wasting or low MUAC, increased from 2·46 to 17·26 % with cut-offs of <115 and <135 mm, respectively.
Table 2 Prevalence of severe acute malnutrition using various combinations of mid-upper arm circumference (MUAC) cut-offs and weight-for-height Z-score (WHZ) <−3 in the surveyed population of children (n 18 456) aged 6–59 months, rural Uttar Pradesh, India, September 2012–October 2013
MUAC was higher in older children and boys, even after adjustment for the weight-for-height status (P<0·001). An MUAC cut-off of <115 mm preferentially selected children aged ≤12 months (OR=11·8; 95 % CI 8·4, 16·6) or ≤24 months (OR=23·4; 95 % CI 12·7, 43·4) and girls (OR=2·2; 95 % CI 1·6, 3·2). These OR were lower with an MUAC cut-off of <135 mm: children aged ≤12 months (OR=5·0; 95 % CI 4·5, 5·5) or ≤24 months (OR=6·0; 95 % CI 5·5, 6·5).
Discussion
The diagnostic test accuracy of MUAC for severe wasting was excellent (area under ROC curve = 0·933). However, at lower MUAC cut-offs (110–120 mm), specificity was excellent but sensitivity was poor; while with higher cut-offs (140–150 mm), sensitivity was excellent but specificity was poor. The optimal MUAC cut-off to detect severe wasting was 135 mm. Although the prevalence of severe wasting was constant at 2·2 %, the SAM burden, defined as either severe wasting or low MUAC, increased from 2·46 to 17·26 % with cut-offs of <115 and <135 mm, respectively.
Our data reaffirm earlier observations( Reference Roberfroid, Huybregts and Lachat 5 , Reference Grellety and Golden 6 , Reference Laillou, Prak and de Groot 9 , Reference Dasgupta, Sinha and Jain 15 – Reference Fernandez, Delchevalerie and Van Herp 17 ) that MUAC<115 mm is not the optimal cut-off to detect severe wasting among children aged between 6 months and 5 years. The optimal cut-off in the current community-based data set is similar to that found in earlier analyses from Cambodia (133 mm)( Reference Laillou, Prak and de Groot 9 ) and ten mostly African countries (<135 mm)( Reference Fernandez, Delchevalerie and Van Herp 17 ). This suggests that there are no noteworthy ethnic or geographical differences in the predictive ability of MUAC cut-offs for severe wasting. Even after accounting for weight-for-height status, an MUAC<115 mm preferentially identified children aged ≤12 months and girls. This finding is in consonance with the contention that MUAC<115 mm and WHZ<−3 identify a distinctly different set of children with malnutrition, with little overlap between the two indicators( Reference Laillou, Prak and de Groot 9 , Reference Berkley, Mwangi and Griffiths 18 ). It is hypothesized that the two indicators measure different aspects of body composition, reflecting perhaps different categories of malnutrition( Reference Laillou, Prak and de Groot 9 ). Earlier studies in children showed that weight-for-height cannot discriminate between fat and lean body mass( Reference Wells, Fewtrell and Williams 19 ) whereas MUAC is strongly related to fat mass but poorly related to fat-free mass or overall weight( Reference Chomtho, Fewtrell and Jaffe 20 ). Unfortunately, our data set precludes an examination of this hypothesis.
Strengths and limitations
The present community-based study was conducted on a representative and large sample size with good quality control and monitoring. However, the following limitations merit consideration: (i) age approximation was necessitated in a small proportion as exact date of birth was not verifiable; (ii) data collection had to be discontinued for a short period (January 2013) due to severe winter; and (iii) prospective mortality outcomes were not evaluated for the cohort because of ethical considerations. However, these limitations are unlikely to bias the association between weight-for-height and MUAC.
Implications for policy
The prime objective of identifying children with SAM is to save their lives by enrolling them in a community management of acute malnutrition programme( 1 , Reference Lenters, Wazny and Webb 3 ). Ideally, analyses to define SAM cut-offs should identify the optimal combination of MUAC and weight-for-height using mortality as outcome; however, ethical considerations preclude this in the current era. Therefore, we have to rely (among other aspects) on earlier evidence using mortality as outcome( Reference Pelletier 21 , Reference Briend, Maire and Fontaine 22 ), suggested key properties for screening and case detection in the community( Reference Myatt, Khara and Collins 23 ), congruence with recent related international guidelines( 24 ) and logistical considerations. The most consistent evidence across studies is that weight-for-height is a less effective predictor of mortality than MUAC in community settings( Reference Pelletier 21 , Reference Briend, Maire and Fontaine 22 ). Further, MUAC alone had better predictive ability than either of the two possible combinations of WHZ <−3 and/or MUAC ≤115 mm( Reference Briend, Maire and Fontaine 22 ). For screening and case detection in the community, simplicity and high specificity are desirable properties( Reference Myatt, Khara and Collins 23 ). A high specificity would also be in tune with the recent WHO guidelines( 24 ) which recommend ‘not to provide formulated supplementary foods on a routine basis to children who are moderately wasted’. Based on the above considerations, the following possibilities, with their attendant pros and cons, deserve deliberation for reaching a programmatic consensus, especially in the Indian context.
Using the optimal MUAC cut-off to increase the sensitivity for detecting severe wasting, a child with SAM could be identified using MUAC<135 mm or WHZ<−3. However, this enhances the case load sevenfold (2·46 to 17·26 %), creating immense logistical and resource challenges. Using the simpler measure, MUAC<135 mm alone (17 %), also presents similar difficulties. A two-step model has been suggested( Reference Laillou, Prak and de Groot 9 ). MUAC<135 mm could be used for screening at community level, followed by MUAC and weight-for-height measurements at a primary health care unit, with both indicators used independently to diagnose SAM and treatment being initiated when either MUAC<115 mm or WHZ<−3. Apart from substantially increasing the logistical requirements, the high false positives – six children will be turned away for every child treated – are likely to undermine confidence in the programme( Reference Laillou, Prak and de Groot 9 ).
If specificity is the overriding consideration, then a modification in the current WHO definition of SAM may not be warranted. However, accurate recording of length or height in community settings in low- and middle-income countries poses considerable challenges and many national programmes prefer to use MUAC alone for identification of SAM. Cut-offs of 115 or 120 mm offer an excellent combination of specificity and logistical requirements based on SAM burden (0·76–1·7 %). Additional advantages include simplicity and feasibility of measurement, and preferential identification of children below 12 months of age and girls, which probably enhances the risk prediction for mortality.
Conclusion
In conclusion, the diagnostic test accuracy of MUAC for severe wasting was excellent (area under ROC curve=0·933). The optimal MUAC cut-off to detect severe wasting was 135 mm. Although the prevalence of severe wasting was constant at 2·2 %, the SAM burden, defined as either severe wasting or low MUAC, increased from 2·46 to 17·26 % with cut-offs <115 and <135 mm, respectively. Based on important considerations for screening and case detection in the community, modification of the current WHO definition of SAM may not be warranted, especially in the Indian context.
Acknowledgements
Acknowledgements: The authors are grateful to the Clinical Development Services Agency (CDSA) team at the Department of Biotechnology, Government of India for providing supportive supervision and monitoring the quality of the survey; and the Steering Committee and Technical Advisory Group of the National SAM Alliance (consisting of the Ministry of Health and Family Welfare, Department of Biotechnology, Indian Council of Medical Research) for their technical support and guidance. Financial support: The authors are extremely grateful to the Indian Council of Medical Research for providing the financial grant for conducting this study (sanctioned vide letter number ICMR 5/97/506/2011-NUT). The funder had no role in the design, analysis or writing of this article. Conflict of interest: The authors declare no conflicts of interest. Authorship: U.K.: concept and design of the study; acquisition, analysis and interpretation of the data; drafted the manuscript and final approval of the manuscript. R.M.P.: design of the work; acquisition and analysis of the data; final approval of the manuscript. R.B.: design of the work; acquisition of the data; final approval of the manuscript. B.P.: design of the work; final approval of the manuscript. A.M.V.: design of the work; final approval of the manuscript. C.P.Y.: data analysis. S.S.: data analysis; interpretation of data. N.S.: interpretation of data; drafted the manuscript. H.S.S.: concept and design of the study; acquisition, analysis and interpretation of the data; drafted the manuscript and final approval of the manuscript. Ethics of human subject participation: Ethical clearance for the study was obtained from the ethics committees of the All India Institute of Medical Sciences, New Delhi, India and Subharti Medical College, Meerut, India. Written informed consent was taken from the parent/guardian of each eligible child.


