


Obesity has become a worldwide epidemic and is on the rise both in developed and developing countries(Reference James, Rachel and Eleni1, Reference Seidell2). According to the WHO's recent global estimations, over one billion adults are overweight (BMI ≥ 25 kg/m2) and nearly 300 million are obese (BMI ≥ 30 kg/m2) worldwide(3). Unequivocal evidence exists on the association of overweight and obesity with adverse medical, psychological, social and economical consequences(Reference Lean4). Moreover, obesity significantly increases the risk of morbidity and mortality in many common disorders such as diabetes mellitus, CVD, musculoskeletal disorders and certain malignancies(Reference Must, Spadano and Coakley5). Obesity is also known to reduce quality of life and life expectancy(Reference Peeters, Barendregt and Willekens6).
Abdominal adiposity, which is also called central obesity, is associated with a higher risk of the development of chronic diseases such as diabetes mellitus(Reference Seidell, Han, Feskens and Lean7) and CVD(Reference Dipietro, Katz and Nadel8). BMI is widely used to assess obesity worldwide(9). However, it may not be a good index to measure body-fat distribution, particularly in those predominantly having abdominal obesity(Reference Deurenberg, Yap and van Staveren10). Many studies have shown waist circumference (WC) to be a better predictor of abdominal obesity and to be associated with higher CVD risk(Reference Lofgren, Herron and Zern11). However, some studies have demonstrated waist-to-hip ratio (WHR) to be superior to BMI and WC(Reference Esmaillzadeh, Mirmiran and Azizi12).
Differences exist in the susceptibility to adiposity and its adverse metabolic and cardiovascular complications between different ethnic groups(Reference Cossrow and Falkner13). South Asians (SA) have a higher prevalence of obesity associated with chronic diseases such as diabetes mellitus and CVD at a relatively lower BMI(14–Reference McKeigue, Ferrie and Pierpoint16).
The anthropometric cut-off values widely used for defining overweight and obesity are based on data from Caucasians(9). Due to ethnic-specific differences in susceptibility to obesity and its health risks, the WHO has suggested adopting population-specific anthropometric cut-off values for different populations(17). However, there are very few published data for SA countries with regard to anthropometric cut-off values(Reference Snehalatha, Viswanathan and Ramachandran18, Reference Misra, Vikram and Gupta19). There are no published data on anthropometric cut-off values for the Sri Lankan adult population. The primary objective of the present study was to define population-specific anthropometric cut-off values to define CVD risk for Sri Lankan adults.
Subjects and methods
Data from a nationally representative epidemiological study (Sri Lanka Diabetes and Cardiovascular Study) were used in deriving ethnic-specific cut-off values. The Sri Lanka Diabetes and Cardiovascular Study was a cross-sectional population study conducted between August 2005 and September 2006. The present study was conducted according to the guidelines laid down in the Declaration of Helsinki and was approved by the Review Committee, Faculty of Medicine, University of Colombo, Sri Lanka. Written informed consent was obtained from all participants before data collection. Detailed sampling has previously been described(Reference Katulanda, Constantine and Mahesh20). A multi-stage random cluster sampling method was used to select a sample of 5000 non-institutionalised adults aged ≥ 18 years from seven of the nine provinces in Sri Lanka. A total of 4474 (males 1767 and females 2707) subjects participated in the study.
Measurements
Anthropometric measurements were performed by trained nurses adhering to the WHO guidelines using calibrated equipment(21). Height was recorded as the maximum distance to the uppermost position on the head from the heel to the nearest 0·1 cm, with the individual standing barefoot and in full inspiration using Harpenden pocket stadiometers (Chasmors Limited, London, UK). Body weight was measured in indoor light clothing to the nearest 0·1 kg using a SALTER 920 digital weighing scale (Salter Limited, Tonbridge, Kent, UK). WC was measured midway between the iliac crest and the lower rib margin at the end of normal expiration using a plastic flexible tape to the nearest 0·1 cm. Similarly, hip circumference was also measured as the widest distance of the buttocks in the inter-trochantric level to the nearest 0·1 cm. BMI was calculated as weight in kg divided by height in m2 (kg/m2).
Blood pressure was measured twice with an interval of at least 10 min rest in a seated position using an Omron IA2 digital blood pressure apparatus (Omron Healthcare, Asia-Pacific Region, Singapore); the two readings of blood pressure were used for both systolic and diastolic blood pressure in the analysis.
Overnight fasting venous blood samples were collected to measure HDL-cholesterol, TAG and glucose. The cholesterol and TAG were measured by an enzymatic colorimetric method in a RxDaytona™ chemical analyser (Randox Laboratories Limited, Crumlin, Antrim, UK). Participants who did not have a history of diagnosed diabetes (n 4084) had an oral glucose tolerance test. Blood specimens were processed at the field centres, were kept in ice and stored at − 20°C within 6–12 h of collection. Chemical analyses were performed in a central laboratory in Colombo.
Definitions
Individual ‘obesity-related CVD risk factors’ were defined as shown below according to the International Diabetes Federation criteria for the diagnosis of the metabolic syndrome(Reference Alberti, Zimmet and Shaw22):
(1) Raised TAG: ≥ 1500 mg/l (1·7 mmol/l) or specific treatment for hypertriacylglycerolaemia.
(2) Low HDL-cholesterol: < 400 mg/l (1·03 mmol/l) in males and < 500 mg/l (1·29 mmol/l) in females or specific treatment for low HDL-cholesterol.
(3) Raised blood pressure: systolic blood pressure ≥ 130 mmHg or diastolic blood pressure ≥ 85 mmHg or treatment for previously diagnosed hypertension.
(4) Dysglycaemia: fasting plasma glucose ≥ 1000 mg/l (5·6 mmol/l) and/or 2 h post-oral glucose tolerance test glucose ≥ 7·8 mmol/l.
Obesity-related high CVD risk was defined as the presence of two or more of these factors (except the obesity variable) and was considered as the dependent variable in defining anthropometric cut-off values.
Statistical analysis
Age-adjusted linear regression and correlation analysis was performed to determine the association of anthropometric variables with blood glucose, blood pressure, HDL-cholesterol and TAG taken as continuous variables. Receiver-operating characteristic curve analysis(Reference Zweig and Campbell23) was performed with ‘obesity-related high CVD risk’ as the dependent variable to define the cut-off points for BMI, WC and WHR. The same procedure was performed using individual risk factors as dependent variables.
The individual anthropometric values with the highest combined sensitivity and specificity to define ‘obesity-related high CVD risk’ were considered the optimal cut-off levels. Finding the point that had the highest sensitivity and specificity was made easier by plotting the product of sensitivity and specificity against the anthropometric values. Binary logistic regression analysis was performed with ‘obesity-related high CVD risk’ as the dependent variable and the (age-adjusted) anthropometric indices as covariates (as categorical variables) to confirm that the cut-off values selected by receiver-operating characteristic curve analysis were associated with statistically significant high risk. For binary logistic regression, BMI was categorised starting from ≤ 16 kg/m2 using intervals of 2·5, WC from ≤ 60 cm with intervals of 5 cm and WHR starting from ≤ 0·7 with intervals of 0·05. The prevalence of obesity based on the newly derived and existing cut-off values and their sensitivity, specificity, positive predictive value and negative predictive value to identify ‘obesity-related high CVD risk factors’ were compared with the existing cut-off values for Caucasians and proposed cut-off values for Asians.
Results
Characteristics of the study sample
Characteristics of the study variables are summarised in Table 1. The mean age of males was 46·3 (sd 15·8) years and that of females was 46·0 (sd 14·6) years. Males had significantly higher WC, WHR, mean systolic blood pressure and TAG. Females had significantly higher BMI, 2 h plasma glucose, total cholesterol, LDL-cholesterol and HDL-cholesterol.
Table 1 Demographic, anthropometric and metabolic profiles of the study sample
(Mean values and standard deviations)
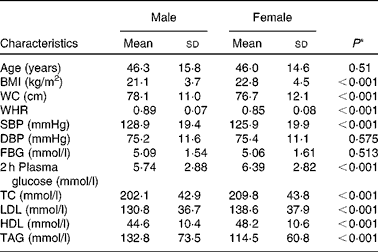
WC, waist circumference; WHR, waist-to-hip ratio; SBP, systolic blood pressure; DBP, diastolic blood pressure; FBG, fasting blood glucose; TC, total cholesterol.
* t Test for equality of means between males and females.
Association of anthropometric measurements and cardiovascular risk factors in Sri Lankan adults
The age-adjusted BMI, WC and WHR had a significant correlation with individual CVD risk factors analysed as continuous variables (P < 0·0001 for all correlations). However, the correlation coefficient was less than 0·3 for most associations (Table 2). In men, the correlation coefficients for total cholesterol and WC, and TAG for all three indicators, and that between diastolic blood pressure and WC were >0·3. In women, the correlation coefficients between diastolic blood pressure, and BMI and WC were >0·3. The associations of the anthropometric indices with HDL-cholesterol were negative.
Table 2 Age-adjusted correlation coefficients (r) between anthropometric indices and blood glucose, blood pressure and lipids
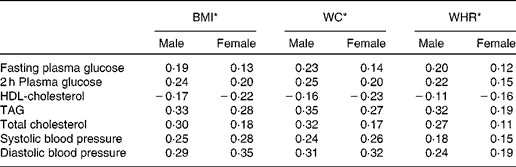
WC, waist circumference; WHR, waist-to-hip ratio.
* Correlation coefficient values were significant (P < 0·0001) for all associations in both men and women.
Anthropometric cut-off values for Sri Lankan adults in predicting high obesity-associated CVD risk
The cut-off values derived from receiver-operating characteristic curve analysis for BMI, WC and WHR are shown in Table 3. The cut-off values for BMI, WC and WHR for males were 20·7 kg/m2, 76·5 cm and 0·89, respectively. The respective values for females were 22·0 kg/m2, 76·3 cm and 0·85. The common cut-off value for BMI for males and females was 21·5 kg/m2. Similarly, the WC and WHR cut-off values for both males and females were 76·3 cm and 0·87, respectively.
Table 3 Anthropometric cut-off values for high obesity-related CVD risk*, diabetes mellitus, hypertension and dyslipidaemia for males and females (Sri Lankan adults)
(Area-under-the-curve (AUC) values and 95 % confidence intervals)

* ‘High obesity-related CVD risk’ implies the presence of two or more of TAG ≥ 1500 mg/l (1·7 mmol/l) or specific treatment for hypertriacylglycerolaemia, HDL-cholesterol (HDL-C) < 400 mg/l (1·03 mmol/l) in males and < 500 mg/l (1·29 mmol/l) in females or specific treatment for low HDL-C, systolic blood pressure ≥ 130 mmHg or diastolic blood pressure ≥ 85 mmHg or treatment for hypertension and fasting plasma glucose ≥ 1000 mg/l (5·6 mmol/l) and/or 2 h post oral glucose tolerance test glucose ≥ 7·8 mmol/l.
† Both males and females – only the cut-off value to identify high obesity-related CVD risk is shown for both females and males together.
The cut-off values of anthropometric indices for the prediction of diabetes were higher than those for obesity-related CVD risk as well as for all other risk factors alone (Table 3). The area under the curve for the prediction of low HDL-cholesterol was lower than that for all other risk factors and for obesity-related CVD risk.
Anthropometric indices and CVD risk
In both males and females, the OR for BMI in predicting obesity-related high CVD risk had a continuous rise starting from lower BMI levels and became significant at the BMI category 18·50–20·99 kg/m2 (Table S1, supplementary material for this article, can be found at http://www.journals.cambridge.org/bjn). The OR had an approximately linear increase starting from the lowest BMI category. The highest OR in men was in the highest BMI category (>28·5 kg/m2), but in females, it was in the category below the highest (26·00–28·49 kg/m2). The trend was significant at P < 0·001 for both sexes. Similarly, the OR for WC in predicting obesity-related CVD risk showed a continuous increase (Table S2, supplementary material for this article, can be found at http://www.journals.cambridge.org/bjn) starting with the lowest WC level in both males and females. The trend was significant at P < 0·001 for both sexes. In both males and females, the OR for WHR increased starting from the lowest level ( < 0·75) (Table S3, supplementary material for this article, can be found at http://www.journals.cambridge.org/bjn). However, the level at which there was a significant difference in males was higher than that for females (males: 0·91–0·95 and females: 0·75–0·80).
The sensitivity, specificity, positive predictive value and negative predictive value of the newly derived anthropometric cut-off values were compared with the global cut-off values and those proposed for Asians by the WHO(9) recently (Table 4). The WHO-recommended BMI cut-off values for overweight for SA and Caucasians are 23 and 25 kg/m2, respectively(9). The sensitivity to detect obesity-related high CVD risk for the newly derived cut-off values, Asian cut-off values and that for Caucasians was 66, 52 and 34 %, respectively. The specificity had an inverse relationship, with it being 88 % for a BMI cut-off value of 25 kg/m2, compared with a specificity of 67 % for a BMI cut-off value of 21·5 kg/m2. Similarly, the positive predictive value increased with a higher cut-off value at the expense of the negative predictive value.
Table 4 Comparison of sensitivity and specificity for the new and pre-existing anthropometric cut-off values for overweight and obesity in the Sri Lankan population to predict obesity-related high CVD risk

PPV, positive predictive value; NPV, negative predictive value; WC, waist circumference; WHR, waist-to-hip ratio.
* Newly derived cut-off value.
† Asian cut-off value for overweight(17).
‡ WHO cut-off value for overweight(9).
§ International Diabetes Federation (IDF) cut-off value for women(Reference Zweig and Campbell23).
∥ IDF cut-off value for men(Reference Zweig and Campbell23).
¶ WHO cut-off value for women(9).
** WHO cut-off value for men(9).
The cut-off values recommended for Asians by the International Diabetes Federation for WC are 80 cm for females and 90 cm for males(Reference Alberti, Zimmet and Shaw22). However, according to the Sri Lankan data, the cut-off values for males and females did not differ very much from each other (male 76·5 cm and female 76·3 cm) (Table 3). Therefore, a cut-off value of 75 cm was considered for both males and females, considering the practicability of a single cut-off value for public health action. For males, the sensitivities of waist cut-off values of 75, 80 and 90 cm were 76, 62 and 27 %, respectively. For females, the sensitivities of the same cut-off points were 72, 57 and 25 %.
The WHO has defined a high WHR for males as >1·0 and for females as >0·85. A WHR of >1·0 had a sensitivity of 6·7 % for males, whereas the cut-off value of 0·90 (round up value of 0·89) gave a sensitivity of 60 % in males. For females, the WHO-recommended cut-off point of >0·85 was similar to the derived value and had a sensitivity of 67 % and a specificity of 60 %.
Discussion
This is the first attempt to identify anthropometric cut-off values to predict obesity-related CVD risk for indigenous Sri Lankan adults. In particular, SA tend to have relatively high adiposity and increased disease risk compared with other ethnic groups for a given BMI(Reference Deurenberg, Deurenberg-Yap and Guricci24–Reference Lear, Toma and Birmingham26). In addition, SA develop diabetes mellitus and CVD at a younger age and perhaps more aggressively(Reference Ehtisham, Crabtree and Clark27–Reference Joshi, Islam and Pais30).
A WHO expert committee has demonstrated the value of population-specific anthropometric cut-off values for Asian countries(17). In fact, few studies have pointed out much lower anthropometric cut-off values for SA compared with other major Asian population groups(Reference Deurenberg-Yap, Schmidt and van Staveren25, Reference Razak, Anand and Shannon31). In Sri Lanka, the prevalence of diabetes was 10·3 %(Reference Katulanda, Constantine and Mahesh20), and obesity-associated CVD have become the leading cause of death in the adult population(Reference Mendis32). The present results show that Sri Lankan adults have a high obesity-related CVD risk factor clustering at obesity levels lower than the existing cut-off levels proposed by the WHO for BMI and WC. The existing cut-off levels based on Caucasian data as well as the proposed cut-off levels for Asians have lower sensitivity in predicting obesity-related CVD risk among Sri Lankans.
The cut-off values derived using these data are consistent with the cut-off values presented by Misra et al. (Reference Misra, Vikram and Gupta19) (BMI 21 kg/m2; WC 78 cm (male), 73 cm (female)) for the Asian Indian population and the cut-off values for the prediction of diabetes proposed by Snehalatha et al. (Reference Snehalatha, Viswanathan and Ramachandran18) (BMI 23 kg/m2; WC 85 cm (male), 80 cm (female)) for South Indians. The cut-off values derived for an Arabic population in Oman using similar methods to the present study have shown higher values for BMI (male 23·2 kg/m2, female 26·8 kg/m2), WC (male 80 cm, female 84·5 cm) and WHR (male 0·91, female 0·91)(Reference Al-Lawati and Jousilahti33). For Japanese adults, WC >85 cm for males and 80 cm for females has been proposed to identify two components of the metabolic syndrome(Reference Nishimura, Nakagami and Tominaga34). Since we have evaluated the highest sensitivity and specificity for ≥ 2 components of the metabolic syndrome excluding the anthropometric variable, the WC cut-off value proposed here can similarly be used to identify those with the metabolic syndrome in Sri Lanka.
Based on the present data, and considering the similar data from Misra et al. (Reference Misra, Vikram and Gupta19) from India, we propose a BMI of 21·5 kg/m2 as the cut-off level for diagnosing overweight in Sri Lankan adults. In the absence of a firm basis for differentiating overweight and obesity, we considered the higher CVD risk and the necessity to be pragmatic in proposing a BMI cut-off value for obesity in Sri Lanka. Accordingly, we propose a BMI cut-off value of >25 kg/m2 for defining obesity in Sri Lankan adults. An Indian consensus statement also suggested a BMI of >25 kg/m2 as a cut-off value for obesity for Asian Indians(Reference Misra, Chowbey and Makkar35).
Although the present data suggest a strong association between obesity and CVD risk, prospective data on BMI, morbidity and mortality among SA are needed to confirm the effect of these associations on clinical outcomes. A WC cut-off value of 75 cm (or 30 inches) is proposed for both men and women based on the present findings. The WHR cut-off values proposed are 0·85 for women and 0·90 for men. WHR was least predictive of obesity-related CVD risk in Sri Lankan adults (Table 3). Compared with BMI and WC, the calculation of WHR needs two relatively difficult measurements and hence can be subject to more errors. Therefore, BMI and WC may be used in preference to WHR for clinical and epidemiological purposes in Sri Lankan adults.
These data as well as data from other SA populations clearly demonstrate that SA have an increased risk for obesity-associated chronic diseases at lower BMI and WC compared with other ethnic groups(Reference Deurenberg-Yap, Schmidt and van Staveren25–Reference Mendis32). Therefore, adoption of these findings has important public health implications in reducing diabetes and other obesity-related chronic diseases in the Sri Lankan and other SA populations. Although it may appear unrealistic to adopt such low anthropometric cut-off levels when compared with the global guidelines based on data for Western populations, these data highlight the need of ethnic- and population-specific information for public health action. Prospective studies on mortality and CVD incidence based on these new findings are urgently needed to further evaluate the implications of these findings. The authors would also like to make it clear that these proposed anthropometric cut-off levels and recommendations may not be applicable for non-SA populations.
Conclusions
The anthropometric cut-off values derived for Sri Lankan adults to predict high CVD risks were much lower than the existing cut-off values for Caucasians and those proposed by the WHO for Asians. To overcome the burden of high obesity-associated CVD and diabetes mellitus in Sri Lanka and other SA countries, accurate identification of at-risk populations is urgently needed. An application of anthropometric cut-off values derived here would help public health professionals and clinicians to offer ethnic-specific preventive and curative strategies to Sri Lankans and similar ethnic groups in regional countries and immigrant populations.
Acknowledgements
The National Science Foundation of Sri Lanka was the main source of funding for the Sri Lanka Diabetes and Cardiovascular Study. Additional support was provided from the Oxford Centre for Diabetes, Endocrinology and Metabolism, UK, and the National Institute for Health Research (NIHR) Biomedical Research Centre Programme. P. K. was a Commonwealth Postgraduate Scholar. We thank the Diabetes Association of Sri Lanka and the WHO Office in Colombo for the support for lipid assays. The authors thank all individuals and institutions who helped and worked for the Sri Lanka Diabetes and Cardiovascular Study. The authors declare no conflict of interest. P. K. designed the study; P. K. and M. A. R. J. carried out the statistical analyses. M. A. R. J., P. K. and D. R. M. were responsible for writing the manuscript. M. H. R. S. and D. R. M. supervised the work and contributed to the final editorial work.


